Enhanced MACD Pro
- 지표
- 버전: 2.0
Enhanced MACD MT4 – Advanced Momentum and Trend Oscillator
The Enhanced MACD MT4 is a versatile technical analysis tool that builds upon the classic Moving Average Convergence Divergence framework. It provides a refined 4-color histogram system and a comprehensive notification engine, designed to visualize momentum shifts and trend reversals with high precision.
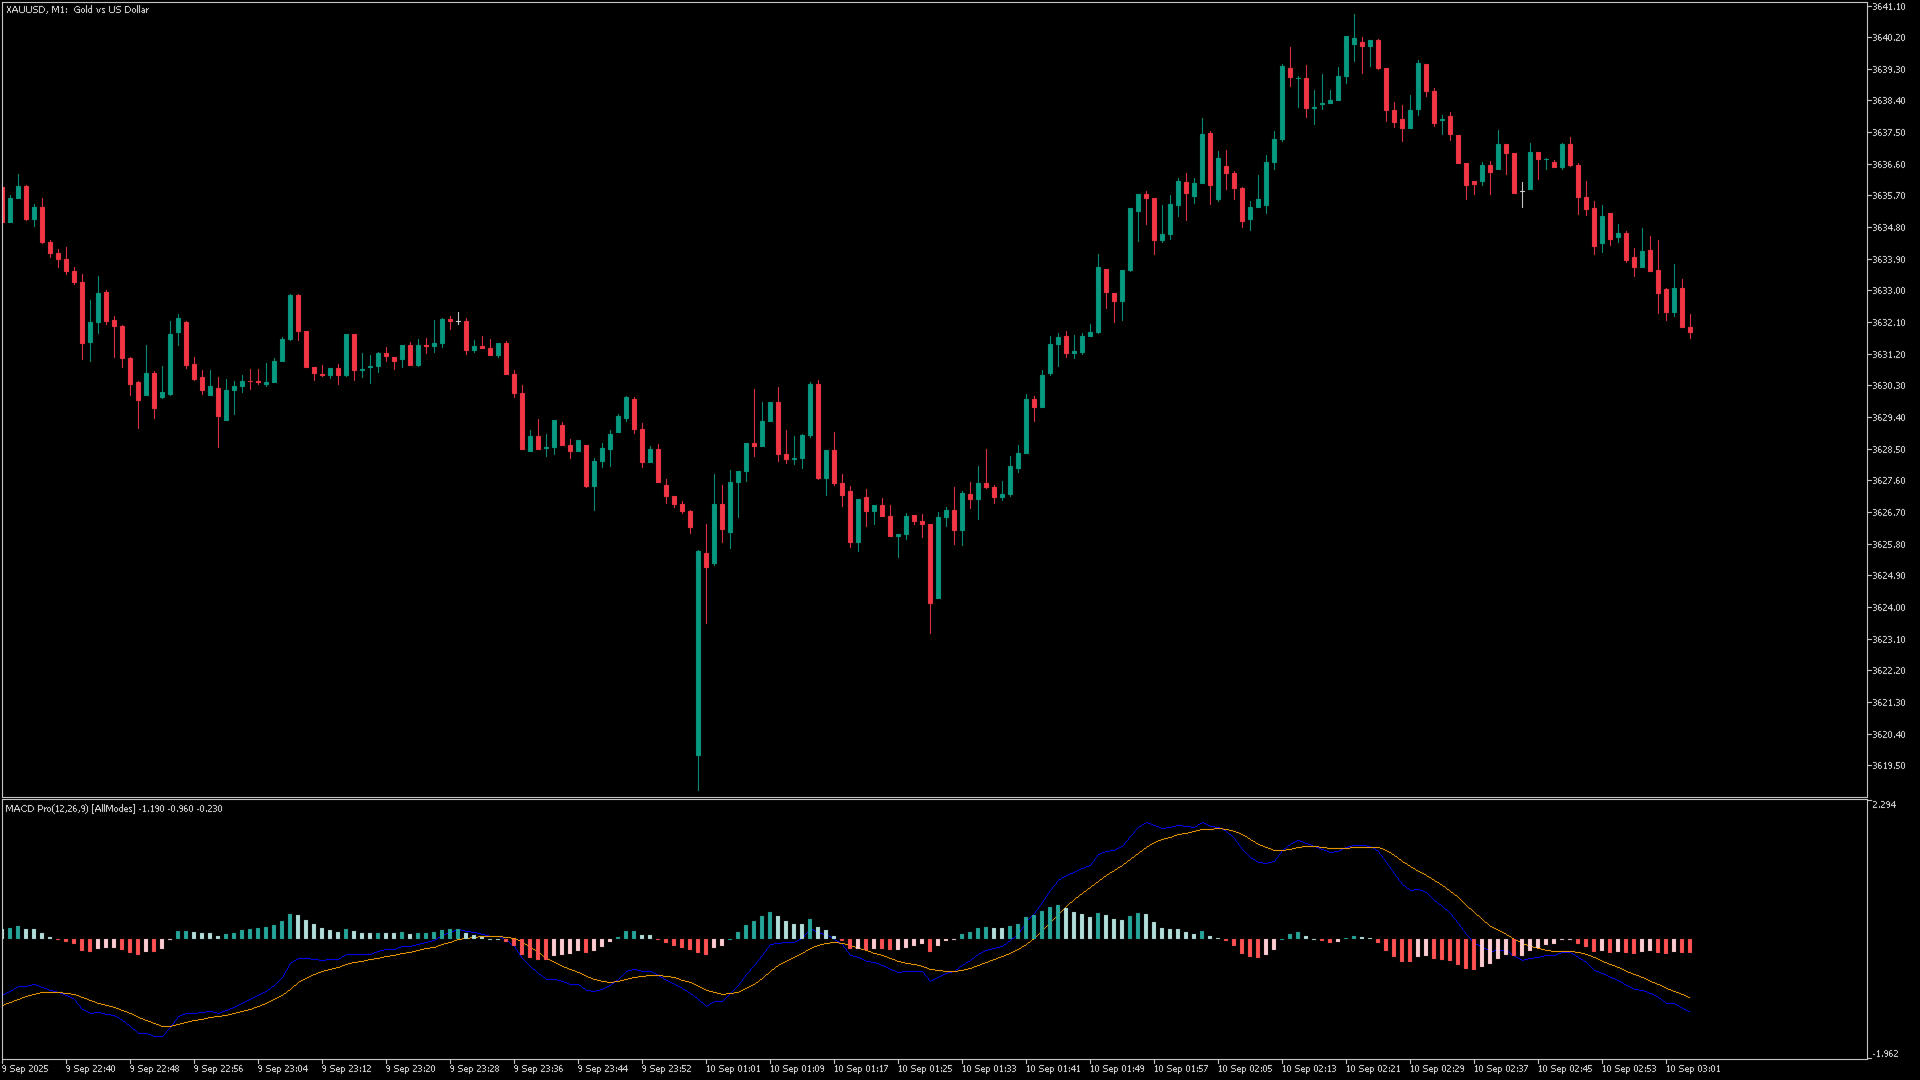
Functional Overview
This implementation focuses on providing a clear visual representation of market dynamics through three primary components:
-
The MACD Line: Measures the distance between two moving averages.
-
The Signal Line: A smoothed average of the MACD line for crossover detection.
-
4-Color Histogram: Dynamically tracks the acceleration and deceleration of momentum, allowing traders to distinguish between strengthening and weakening trends at a glance.
Visual Logic & Market States
The histogram utilizes a color-coded system to represent four distinct market conditions:
-
Dark Green: Bullish momentum is increasing.
-
Light Green: Bullish momentum is losing strength.
-
Dark Red: Bearish momentum is increasing.
-
Light Pink: Bearish momentum is losing strength.
Notification & Alert System
To ensure you are notified of critical price action without constant screen monitoring, the indicator includes a multi-mode alert system:
-
Signal Crossovers: Notifications for MACD and Signal line intersections.
-
Zero Line Cross: Alerts when the histogram shifts from positive to negative territory or vice versa.
-
Momentum Shifts: Trigger alerts based on histogram color changes (early momentum detection).
-
Delivery Methods: Supports Terminal Popups, Audio Alerts, Email Notifications, and Mobile Push (Notifications via MetaQuotes ID).
Key Technical Features
-
Adjustable Smoothing: Independently configure Fast EMA, Slow EMA, and Signal periods to match your analysis requirements.
-
Calculation Flexibility: Choose from multiple price types (Close, Open, High, Low, Median, Typical, Weighted) and MA methods (SMA/EMA).
-
Signal Filtering: Directional filters allow you to receive alerts for Buy-side only, Sell-side only, or both.
-
Resource Efficient: Optimized code ensures minimal impact on terminal performance even when applied to multiple charts.
Technical Specifications
-
Symbol Compatibility: Works on all instruments including Forex, Metals, Indices, and Commodities.
-
Timeframe Agnostic: Applicable to any period from M1 to MN1.
-
EA Ready: Exports all visual signals via standard output buffers for easy integration with Expert Advisors.