Gold Levels MTF MT5
- 지표
-
Sergei Linskii
 2010년부터 외환 거래 경험. 저는 수동 거래를 위한 거래 전략과 전문가 자문가의 자동 거래를 위한 알고리즘을 개발하는 활동적인 거래자이자 개발자입니다. 지금은 거래와 안정적인 수익에 가장 적합한 기호인 금만 수동으로 거래합니다.
💥 내 텔레그램 >>> https://t.me/venamax - 버전: 1.5
- 업데이트됨: 9 1월 2024
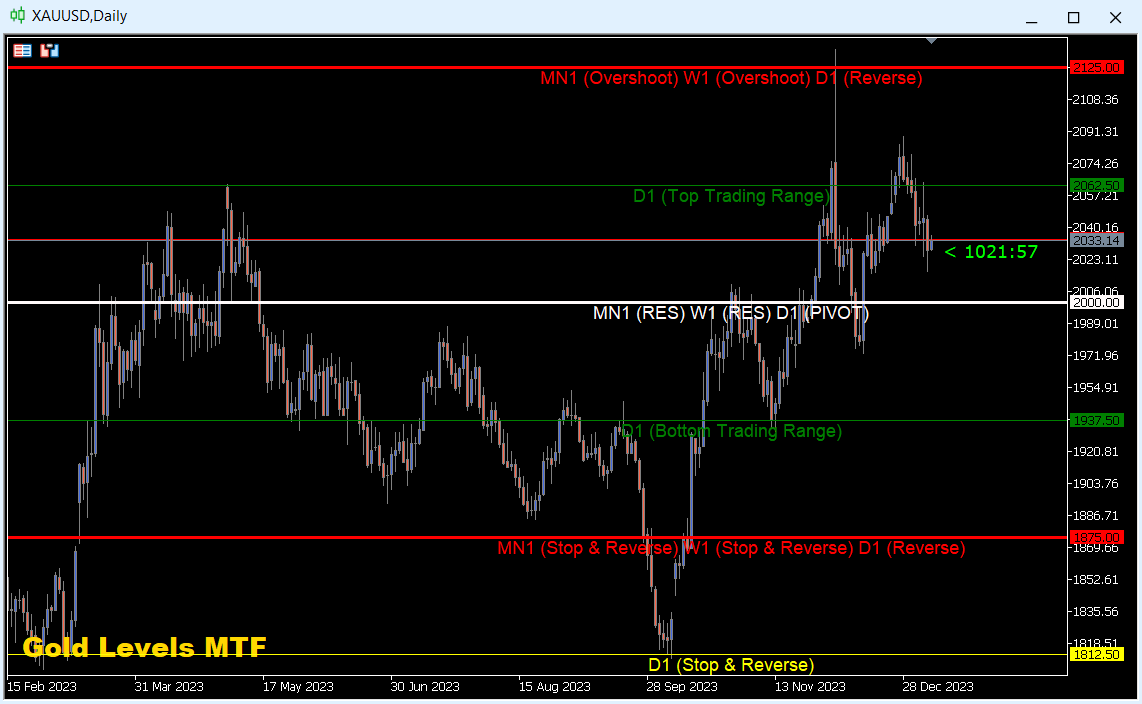
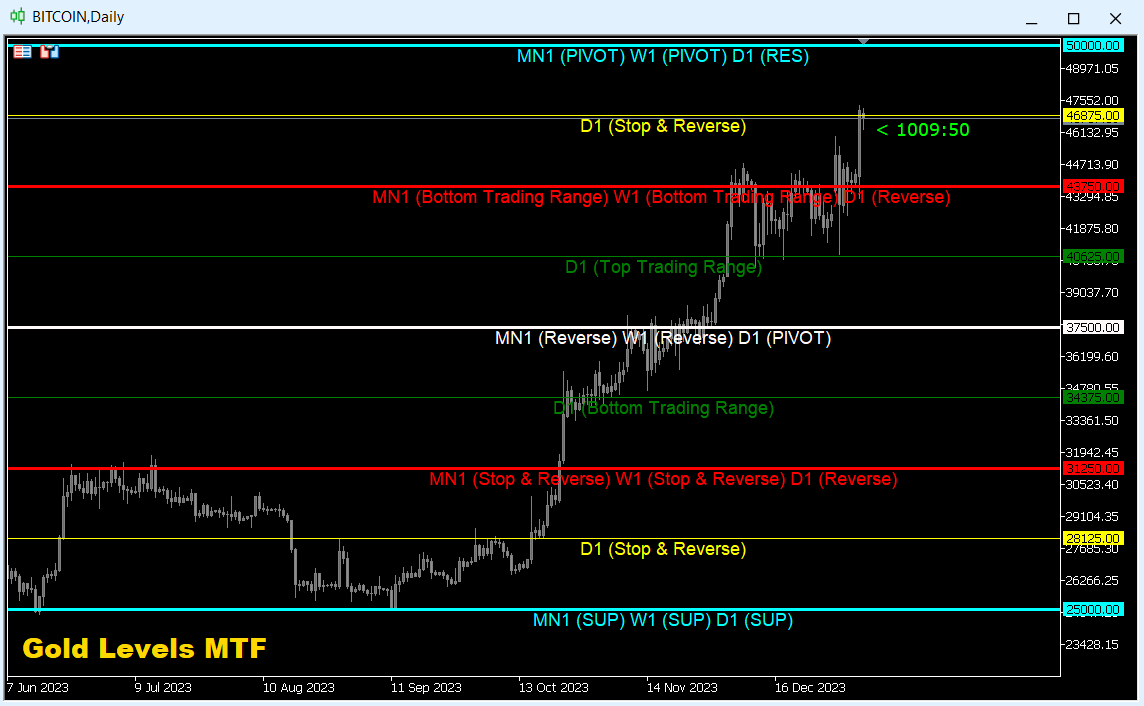
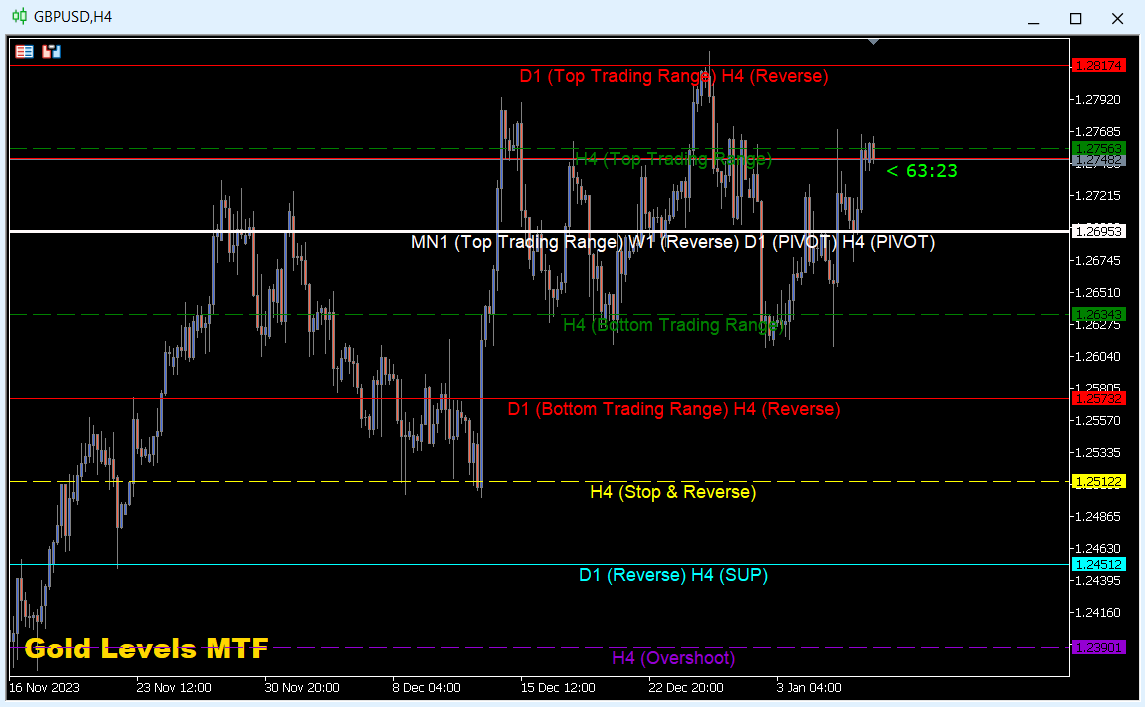
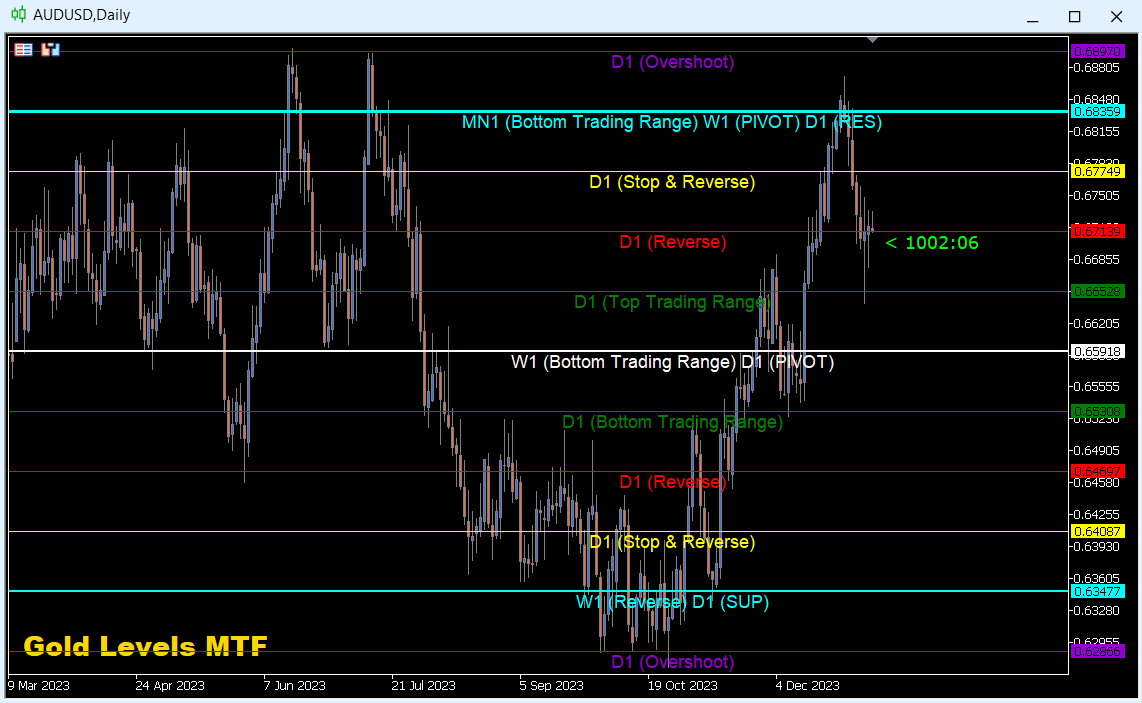
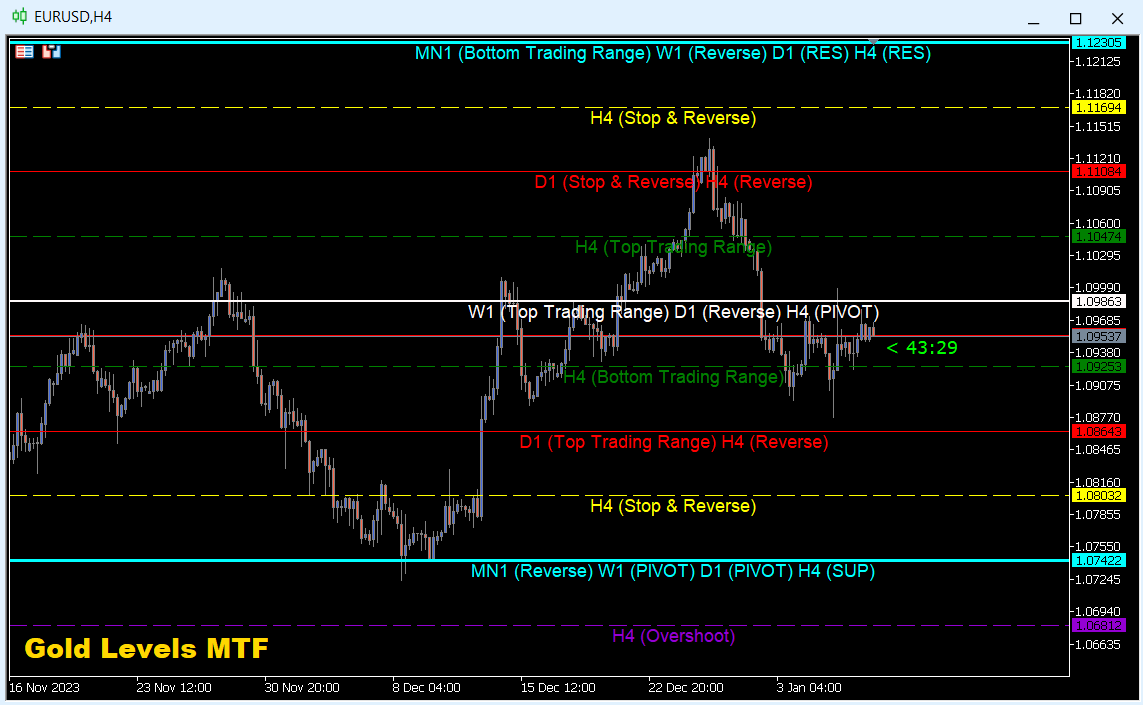
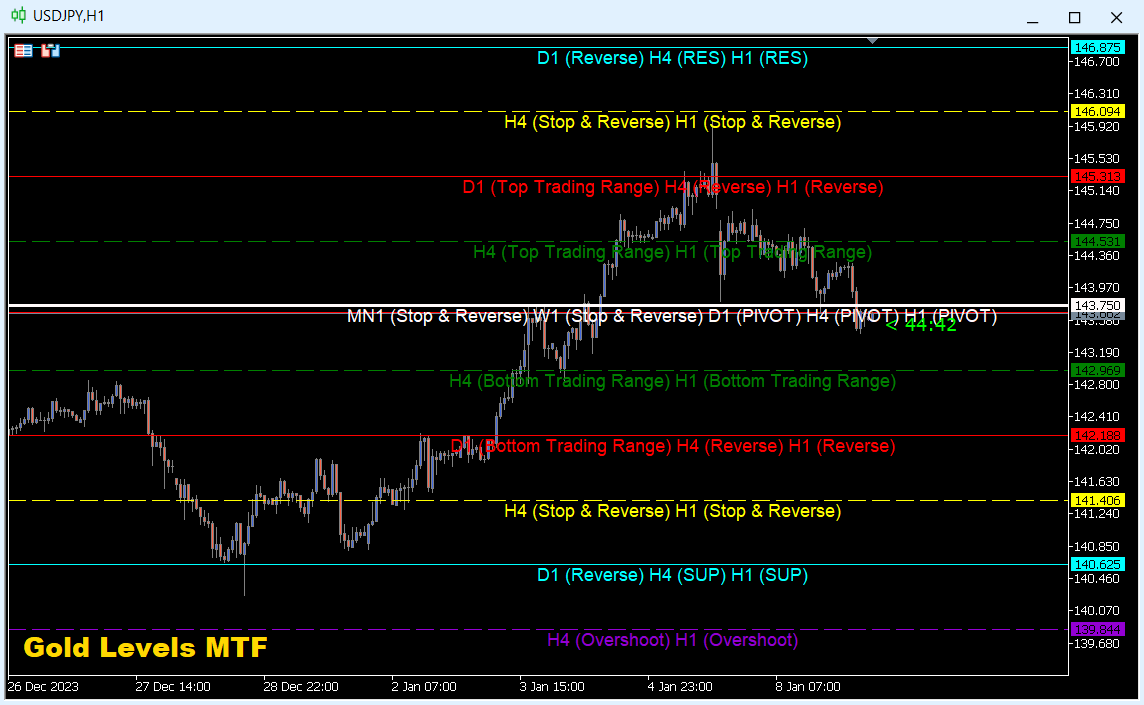
Gold Levels MTF - this is a fine stock technical indicator. The indicator algorithm analyzes the movement of the asset price, displays price levels of support and resistance from all time frames (TF) using the Murray method based on the Gann theory. The indicator indicates overbought and oversold fields, giving an idea of possible reversal points and at the same time giving some idea of the strength of the current trend.
Description of levels:
(Extreme Overshoot) - these levels are the ultimate support/resistance. After the price breaks through these levels, the indicator automatically recalculates and sets new levels. The reason behind the new calculations is the narrowing and expansion of the range of price fluctuations per unit of time / volatility.
(Overshoot) - is a weak level. If the price has gone too far and too fast and if it has stopped near this level, then it will turn quickly upward. If the price does not stop near this level, it will continue to move.
(SUP / RES) - these levels are the strongest and provide the strongest resistance and support.
(Stop & Reverse) - is a weak level. If the price has gone too far and too fast and if it has stopped near this level, then it will turn down quickly. If the price does not stop near this level, it will continue to move.
(Reverse) - these levels are capable of completely reversing the price movement.
(Top Trading Range) - if the price tends to remain above this level, then it will remain higher. If, however, the price falls below this level, then it is likely to continue fall further to the next resistance level.
(Bottom Trading Range) - if prices are below this level and move up, then it will be difficult for the price to break through this level. If they break through this level and remain above it for 10-12 days, then prices will remain above this level.
(PIVOT) - is the main resistance/support level. This level provides the greatest resistance/support. This level is the best for a new purchase or sale. If the price is above this level, then this is a strong support level. If the price is below this level, then this is an excellent resistance level.
Benefits of the indicator:
1. The indicator displays price levels with high accuracy.
2. You can trade on the MetaTrader 5 trading platform of any broker.
3. You can trade any assets (currencies, metals, cryptocurrencies, stocks, indices etc.).
4. You can trade on any timeframes (H1-H4 medium-term trading / D1-W1-MN long-term trade).
5. The indicator can be used as an excellent main addition to your trading system, as well as an independent trading system.
Version of the Gold Levels MTF indicator for MetaTrader 4
I wish you all good luck in trading and stable profit!


в целом отличный индикатор, иногда не отображается линия уровня, не пойму почему, может так и должно быть, название уровня есть а линии нет, в целом работе не мешает, так что очень хороший индикатор