MFI Modern PRO

4.92
Default settings are just for visualisation, it can not be profitable with it. 


Get a Free EA as a Bonus when you Purchase the Indicator! Plus, Receive 4 Interesting Additional Indicators.

Recommended set files for backtesting the indicator on recommended pairs are available in the comments section (last page).

Please note that this product is exclusively sold on the MQL5 market. Any other sources offering it are scams, and the author bears no responsibility.

To receive the bonus gifts, please contact me privately through direct messages.

With the latest upgrade, the MFI period has become dynamic, and a +1 filter has been added.

If you don't see arrows with any set file, simply adjust the "Volatile" setting to "Not use" or set the filterMFI to false.

Here is the EA from the video for easily backtesting the indicator entries before making a purchase: [https://www.mql5.com/en/market/product/85876]. Don't forget to use the recommended set files available in the comments section.

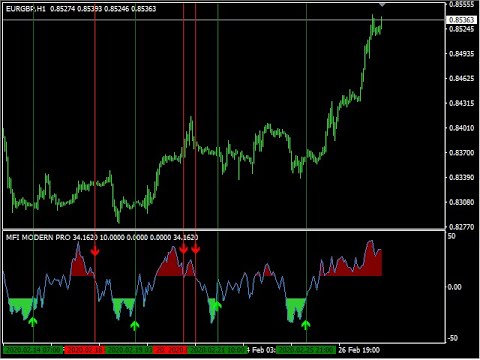
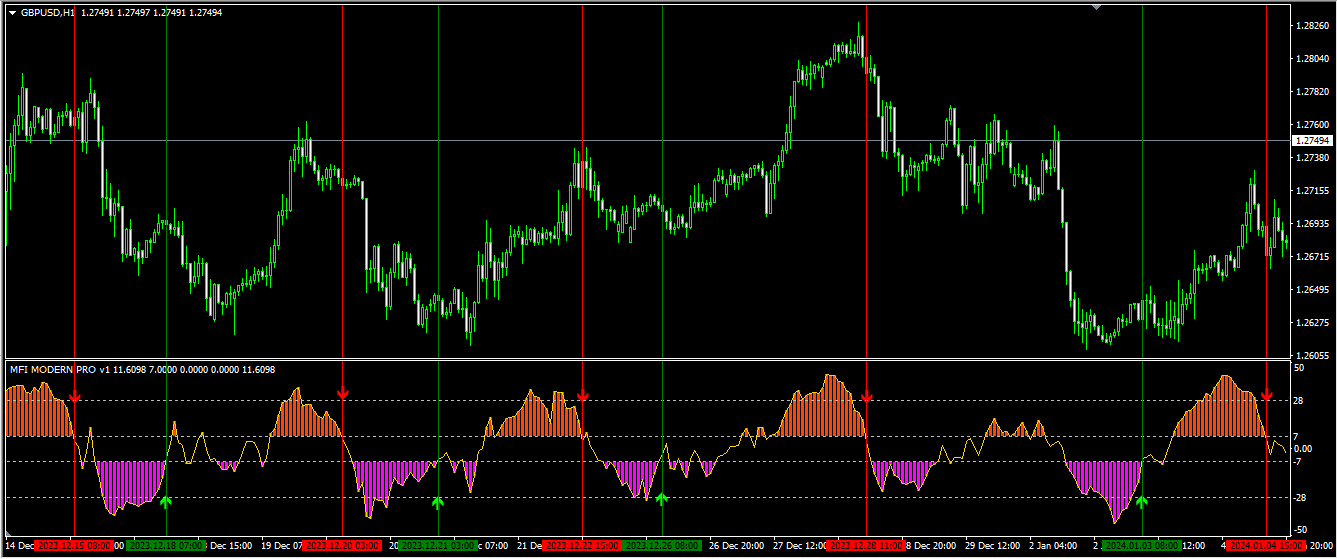
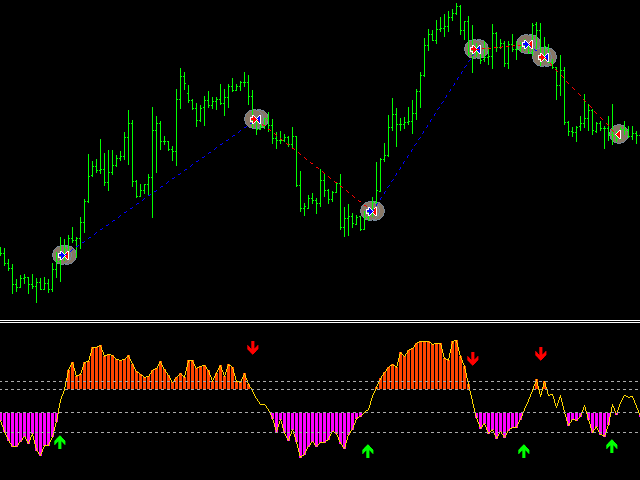
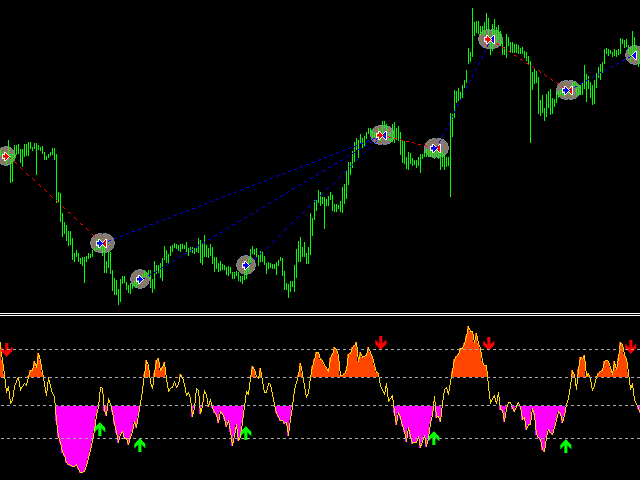
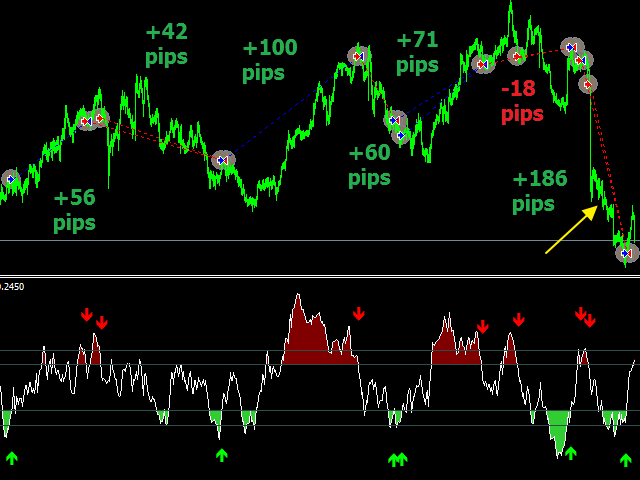
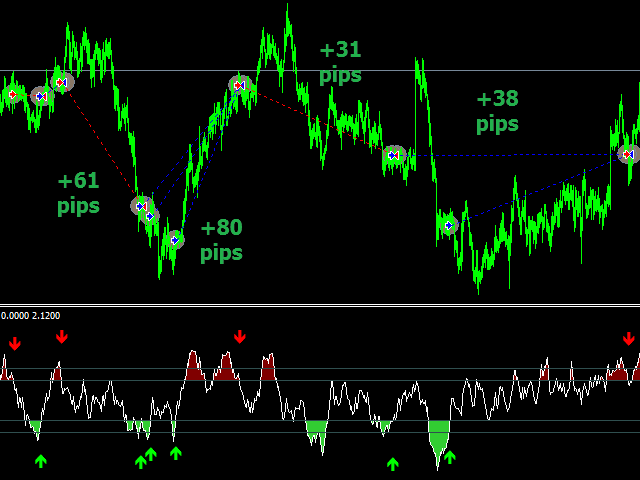
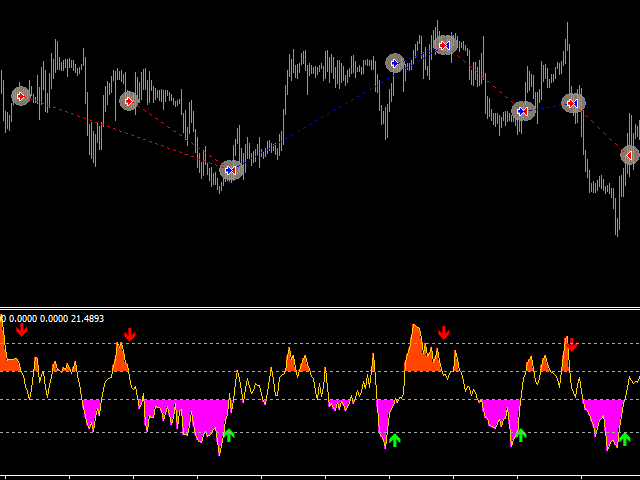
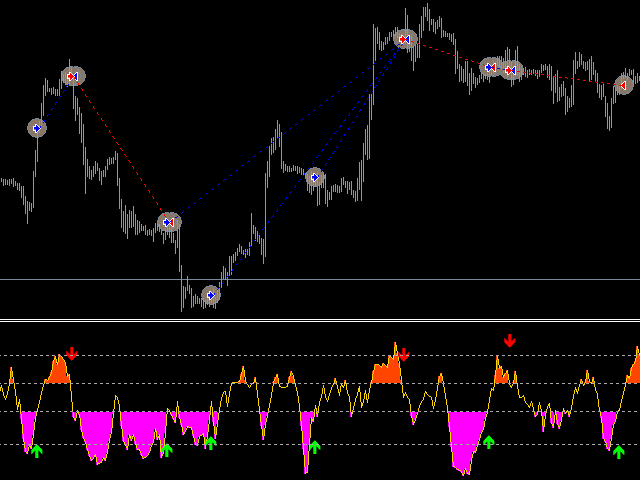
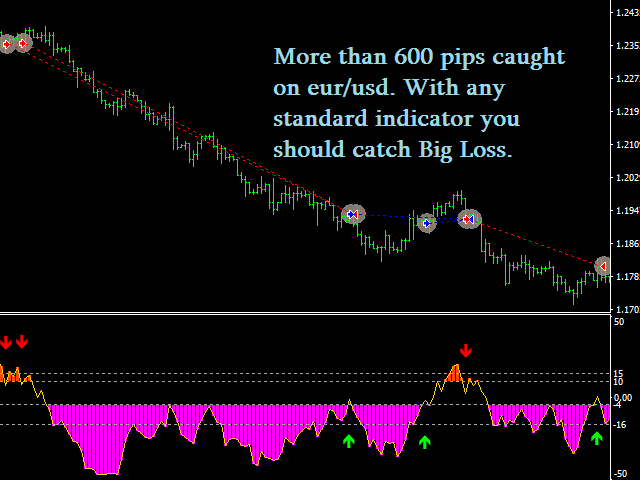
MFI Modern Pro is an enhanced version of the standard MFI indicator. It displays clouds at the intersection of various levels and draws arrows upon the completion of each cloud formation. These clouds represent zones where overbought or oversold conditions are active and are about to end. When the MFI line exits one of these zones, arrows appear, indicating the direction for Buy or Sell trades. Each opposite signal serves as an exit for the previous signal. For instance, a red arrow indicates a sell signal and simultaneously serves as an exit signal for the previous green arrow (buy signal). Occasionally, a similar sell or buy signal may appear when we already have a  position in plus from the previous signal. This behavior is completely normal. 

Watch the video to see the indicator entries in action (Please note that the EA in the video is solely for demonstration purposes and not available for sale. It is provided as a gift to customers who purchase the indicator).

     MFI Modern Pro includes the following input parameters:

  • mfiPeriod: period for the MFI indicator.
  • mfiPeriodadd: number of periods to add to mfiPeriod to allow dynamic and automatic changes (linked to CCI).
  • mfiSellProof: MFI level to cross from up to down initially to confirm a sell arrow.
  • mfiSellCross: MFI level to cross from up to down after Proof to draw a sell arrow.
  • mfiBuyCross: MFI level to cross from down to up after proof to draw a buy arrow.
  • mfiBuyProof: MFI level to cross from down to up initially to confirm a buy arrow.
  • FilterMfi: Enable/disable an extra condition for arrow confirmation.
  • FilterTFmfi: Choose timeframe for confirmation.
  • FilterBuyProofMFI: Level for buy order confirmation (e.g., if we buy when MFI exits the oversold zone on H1, it should not be near the overbought zone on lower timeframes like M30-M15. If filterMFI is false, this option is not used).
  • FilterSellProofMFI: Level for sell order confirmation (e.g., if we sell when MFI exits the overbought zone on H1, it should not be near the oversold zone on lower timeframes like M30-M15. If filterMFI is false, this option is not used).
  • Volatile: Choose "Not Use," "Higher," or "Lower." For Higher, the volatility number should be higher than the entered level to draw an arrow. For Lower, the volatility number should be lower than the entered level to draw an arrow (this is an independent indicator built-in from my products).
  • VolTF: Timeframe for detecting volatility factor.
  • VolPeriod: Period of volatility.
  • VolLevel: Level for volatility.
  • UseCCI: Enable/disable CCI for making the MFI period dynamic. It adds the Periodadd number to the main period of MFI (first input).
  • cciTF: Timeframe for CCI.
  • cciPeriod: Period for CCI.
  • cciPrice: CCI Price.
  • cciLevel: CCI level (if set to 150, it will use 150 and -150 as the upper and lower thresholds, respectively, which are added to the period of MFI as specified in Periodadd).
  • UseBB: Enable/disable Bollinger Bands filter. If enabled, the price must be below the upper band to draw a sell arrow (according to the conditions described above), and the price must be above the lower band to draw a buy arrow (according to the conditions described above).
  • alerts: All available alerts provided by the indicator.

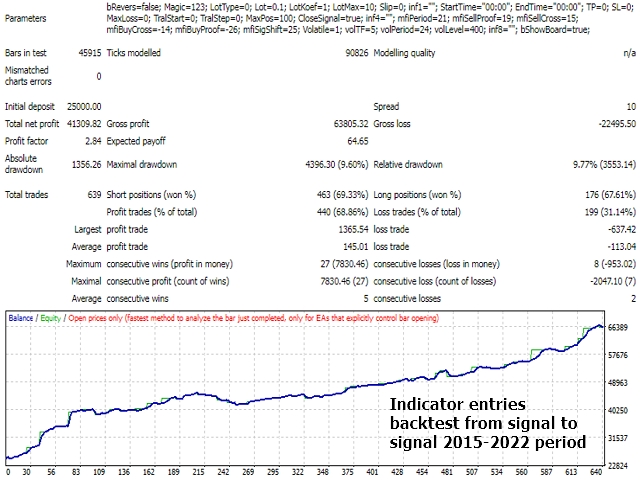
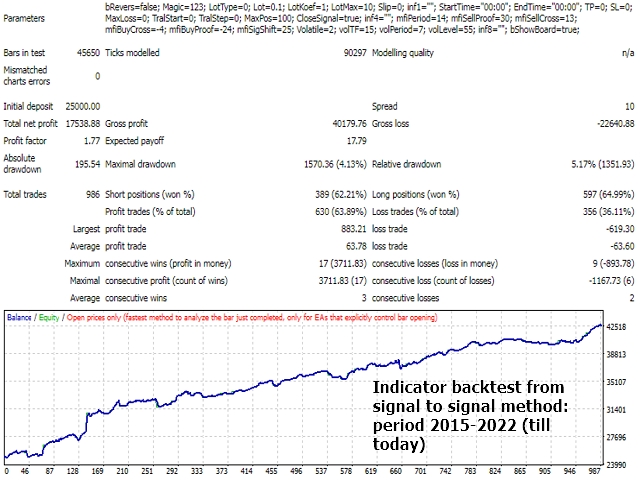
This indicator is the result of 11 years of trading experience. Tests have been conducted using the "from signal to signal" method, without the use of stop losses, to showcase its accuracy solely based on signals. Every trader should determine suitable stop loss levels based on their preferences and trading styles, as variables can vary significantly depending on the type of trader. The Gift EA can assist in quickly and easily researching different settings. Good luck!


리뷰 58
akira1212
199
akira1212 2025.08.17 22:23 
 

I have purchased it. How do I claim my EA?

Yusuf Hamzah
871
Yusuf Hamzah 2024.02.18 15:44 
 

The indicator is MFI-complete and it allows user to perform back-testing and optimization. I have been reviewing it for nearly two weeks. It is feature-wise, provide value-for-money and I have nothing to regret purchasing it. Davit provides a good after-sales support and very generous in giving explanations. He is quick to response and adept to questions. As a caveat, past performance does not guarantee future performance. Although, I do believe the indicator is promising, I still strongly suggest user to do its own homework to fully utilize it (like any other indicators, it is just an indicator). Good luck.

rainwalker123
3424
rainwalker123 2023.08.22 13:18 
 

DEAR DAVID, you are the best and talented here in MQL5. Your indicator ist the only one, who provides reliable and profitable signals. You are real JEWEL for the trader community here. RIGHT ON, you are the best.

추천 제품
Auto Fibo Pro m
DMITRII GRIDASOV
"Auto FIBO Pro" Crypto_Forex 지표 - 거래에 유용한 보조 도구입니다! - 지표는 자동으로 Fibo 수준과 로컬 추세선(빨간색)을 계산하여 차트에 배치합니다. - Fibonacci 수준은 가격이 반전될 수 있는 주요 영역을 나타냅니다. - 가장 중요한 수준은 23.6%, 38.2%, 50%, 61.8%입니다. - 역전 스캘핑이나 존 그리드 거래에 사용할 수 있습니다. - Auto FIBO Pro 지표를 사용하여 현재 시스템을 개선할 수 있는 기회도 많습니다. - Info Spread Swap Display가 있습니다. 현재 Spread와 Swap이 부착된 외환 쌍을 표시합니다. - 디스플레이에는 계정 잔액, 자본 및 마진도 표시됩니다. - 차트의 어느 모서리에서나 Info Spread Swap Display를 찾을 수 있습니다. 0 - 왼쪽 상단 모서리, 1 - 오른쪽 상단, 2 - 왼쪽 하단, 3 - 오른쪽 하단. 여기를 클릭하여 고품질 트레이딩 로봇과
Alpha Trend sign has been a very popular trading tool in our company for a long time. It can verify our trading system and clearly indicate trading signals, and the signals will not drift. Main functions: Based on the market display of active areas, indicators can be used to intuitively determine whether the current market trend belongs to a trend market or a volatile market. And enter the market according to the indicator arrows, with green arrows indicating buy and red arrows indicating se
Owl smart levels
Sergey Ermolov
4.24 (37)
MT5 버전  |   FAQ Owl Smart Levels Indicator 는   Bill Williams 의 고급 프랙탈, 시장의 올바른 파동 구조를 구축하는 Valable ZigZag, 정확한 진입 수준을 표시하는 피보나치 수준과 같은 인기 있는 시장 분석 도구를 포함하는 하나의 지표 내에서 완전한 거래 시스템입니다. 시장과 이익을 취하는 장소로. 전략에 대한 자세한 설명 표시기 작업에 대한 지침 고문-거래 올빼미 도우미의 조수 개인 사용자 채팅 ->구입 후 나에게 쓰기,나는 개인 채팅에 당신을 추가하고 거기에 모든 보너스를 다운로드 할 수 있습니다 힘은 단순함에 있습니다! Owl Smart Levels   거래 시스템은 사용하기 매우 쉽기 때문에 전문가와 이제 막 시장을 연구하고 스스로 거래 전략을 선택하기 시작한 사람들 모두에게 적합합니다. 전략 및 지표에는 눈에 보이지 않는 비밀 공식 및 계산 방법이 없으며 모든 전략 지표는 공개되어 있습니다. Owl Smart Leve
Trend Ray
Andriy Sydoruk
The indicator shows the potential trend direction by cyclical-wave dependence. Thus, all the rays of the intersection will be optimal rays, in the direction of which the price is expected to move, taking into account the indicator period. Rays can be used as a direction for potential market movement. But we must not forget that the approach must be comprehensive, the indicator signals require additional information to enter the market.
Trend Scanner
Vladimir Kalendzhyan
4.33 (6)
By purchasing this indicator, you have the right to receive a free copy of one of   my other indicator's or advisor’s!  (All future updates are included. No limits) . To get it , please contact me by  mql5 message ! The Trend Scanner trend line indicator displays the trend direction and its changes. The indicator works on all currency pairs and  timeframes. The indicator simultaneously displays multiple readings on the price chart: the support and resistance lines of the currency pair, the exist
The indicator detects and displays 3 Drives harmonic pattern (see the screenshot). The pattern is plotted by the extreme values of the ZigZag indicator (included in the resources, no need to install). After detecting the pattern, the indicator notifies of that by a pop-up window, a mobile notification and an email. The indicator highlights the process of the pattern formation and not just the complete pattern. In the former case, it is displayed in the contour triangles. After the pattern is com
Rainbow Price Visualizer
Vincent Jose Proenca
Rainbow Price Visualizer v1.21 See where the market really breathes. Turns your MT4 chart into an ultra-precise heatmap that highlights price zones favored by big players. Why it matters 300 price levels at 0.2‑pip resolution — microscopic detail. 8 visual themes (Rainbow, Fire, Ocean…) for instant readibility. Smart opacity: low noise fades, real zones pop. Lightweight rendering with automatic cleanup. Fully customizable: saturation, opacity, resolution, history depth. Bands project into the f
FreqoMaster
Stanislav Korotky
The main idea of this indicator is rates analysis and prediction by Fourier transform. The indicator decomposes exchange rates into main harmonics and calculates their product in future. The indicator shows 2 price marks in history, depicting price range in the past, and 2 price marks in future with price movement forecast. Buy or sell decision and take profit size are displayed in a text label in the indicator window. The indicator uses another indicator as an engine for calculations - FreqoMet
Simple to read and powerful, no fancy lines and drawings to clutter your chart or distract you. The trend probability oscillator estimates how likely a trend will continue in a certain period. The cummulator period controls how many bars in the past to use and is a proxy for the timescale the trend probability should hold. The use of a Max Line improves this further by indicating when a trend is likely to reverse. In most cases a trend must lose momentum before reversing. Hence, a trend probabil
"Adjustable Fractals Pro"는 프랙탈 지표의 고급 버전으로, 매우 유용한 거래 도구입니다! - 알다시피 표준 프랙탈 mt4 지표에는 설정이 전혀 없습니다. 이는 거래자에게 매우 불편합니다. - Adjustable Fractals Pro는 이 문제를 해결했습니다. 필요한 모든 설정이 있습니다. - 지표의 조정 가능한 기간(권장 값 - 7 이상). - 가격의 고점/저점으로부터의 조정 가능한 거리. - 프랙탈 화살표의 조정 가능한 디자인. - Info Spread Swap Display가 있습니다. 현재 스프레드와 외환 페어의 스왑을 첨부된 위치에 표시합니다. - 디스플레이에는 계정 잔액, 자본 및 마진도 표시됩니다. - 차트의 어느 모서리에서나 Info Spread Swap Display를 찾을 수 있습니다. 0 - 왼쪽 상단 모서리, 1 - 오른쪽 상단, 2 - 왼쪽 하단, 3 - 오른쪽 하단. - 표시기에는 모바일 및 PC 알림 기능이 내장되어 있습니다. 여기를
Super Reversal Pattern
Parfait Mujinga Ndalika
Super Reversal Pattern Indicator Unlock the power of advanced pattern recognition with our Super Reversal Pattern Indicator. Designed for traders seeking precision and reliability, this indicator identifies one of the most effective reversal patterns in technical analysis, offering a significant edge in your trading strategy. Key Features: Non-Repainting Accuracy: Enjoy the confidence of non-repainting technology. Once a Super Reversal Pattern is detected, it remains static, providing consiste
Crypto_Forex 지표 "Morning Star pattern" for MT4. - 지표 "Morning Star pattern"은 가격 액션 거래에 매우 강력한 지표입니다. 다시 칠할 필요 없고 지연도 없습니다. - 지표는 차트에서 강세 Morning Star 패턴을 감지합니다. 차트에 파란색 화살표 신호가 있습니다(그림 참조). - PC, 모바일 및 이메일 알림이 있습니다. - 또한 형제인 약세 "Evening Star pattern" 지표도 사용할 수 있습니다(아래 링크를 따라가세요). - 지표 "Morning Star pattern"은 지지/저항 수준과 결합하기에 매우 좋습니다. 여기를 클릭하여 고품질 트레이딩 로봇과 지표를 확인하세요! 이것은 이 MQL5 웹사이트에서만 제공되는 오리지널 제품입니다.
MACD Divergence
Sergey Deev
2.5 (2)
The indicator detects divergence signals - the divergences between the price peaks and the MACD oscillator values. The signals are displayed as arrows in the additional window and are maintained by the messages in a pop-up window, e-mails and push-notifications. The conditions which formed the signal are displayed by lines on the chart and in the indicator window. Indicator Parameters MacdFast - fast MACD line period MacdSlow - slow MACD line period MacdSignal - MACD signal line period MacdPric
Line Magnit
Aleksey Trenin
The LineMagnit Indicator for MT4 is a highly precise tool that builds support and resistance levels which magnetically attract prices. This feature allows traders to easily determine the most probable entry and exit points in the market, as well as identify the market's directional forces, as levels are based on capital inflows into the instrument. Equipped with an intuitively understandable graphical interface, the LineMagnit Indicator enables users to quickly locate and analyze support and res
Fractal Zig Zag
Mikhail Nazarenko
A   professional version of the ZigZag indicator for visualizing the structure of price movements by fractals. Fractal ZigZag fixes the flaws of the standard version of the ZigZag indicator MT4. It uses Price action and a unique filtering algorithm to determine fractals. Suitable for all types of trading. Ideal for trading according to the WM pattern "Sniper" strategy !!! Features Marks the place of price reversal during the formation of a new fractal with specified parameters. Suitable for al
Crypto_Forex 지표 HTF Ichimoku for MT4. - Ichimoku 지표는 가장 강력한 트렌드 지표 중 하나입니다. HTF는 - Higher Time Frame을 의미합니다. - 이 지표는 트렌드 트레이더와 가격 액션 항목과의 조합에 탁월합니다. - HTF Ichimoku 지표를 사용하면 더 높은 타임프레임의 Ichimoku를 현재 차트에 첨부할 수 있습니다. - 상승 추세 - 파란색 선 위에 빨간색 선(두 선 모두 클라우드 위에 있음) / 하락 추세 - 파란색 선 아래에 빨간색 선(두 선 모두 클라우드 아래에 있음). - 가격이 Ichimoku 클라우드 상단 테두리를 돌파했을 때만 BUY 주문을 엽니다. - 가격이 Ichimoku 클라우드 하단 테두리를 돌파했을 때만 SELL 주문을 엽니다. - HTF Ichimoku 지표는 큰 트렌드를 포착할 수 있는 기회를 제공합니다. 여기를 클릭하여 고품질 트레이딩 로봇과 지표를 확인하세요! 이 MQL5 웹사이트에서만
FX Flow
Eva Stella Conti
FX Flow   indicator can be used as an anticipator of the next trend, preferably confirmed by Price Action or another oscillator (RSi, Stochastic ..). It takes the money flows of the major currencies USD EUR GBP AUD NZD CAD CHF JPY into account, and processes them. Excellent tool for indices, but also for correlations between currencies. Works on each timeframes.  Blue line: Bull market Yellow line: Bear market Note : if the indicator opens the window, but does not draw lines, load the historie
RSI Speed mp
DMITRII GRIDASOV
MT4용 Crypto_Forex 지표 "RSI SPEED" - 훌륭한 예측 도구, 재도색 불필요 - 이 지표는 물리학 방정식을 기반으로 계산됩니다. RSI SPEED는 RSI 자체의 1차 미분값입니다. - RSI SPEED는 주요 추세 방향으로 스캘핑 진입에 유용합니다. - HTF MA(그림 참조)와 같은 적절한 추세 지표와 함께 사용하세요. - RSI SPEED 지표는 RSI 자체의 방향이 얼마나 빨리 변하는지를 보여주며, 매우 민감합니다. - 모멘텀 거래 전략에는 RSI SPEED 지표 사용을 권장합니다. RSI SPEED 지표 값이 0보다 작으면 가격 모멘텀이 하락하고, 0보다 크면 가격 모멘텀이 상승합니다. - 모바일 및 PC 알림 기능이 내장되어 있습니다. 여기를 클릭하여 고품질 트레이딩 로봇과 지표를 확인하세요! 본 제품은 MQL5 웹사이트에서만 제공되는 정품입니다.
Laser Trend
Nicolas Zouein
The trend is your friend! This is what this indicator is all about. Follow this famous saying and be safe. Characteristics: Buy/Sell signals fixed on the close of a bar. Works on all symbols and all timeframes. Clear visual market trend laser line, Buy/Sell signal arrows, market strength meter, TP1 & TP2 boxes. Visual signals when to enter, when to exit the market. No repainting. Compatible with Flexible EA for trading automation. (Ask for a free set file optimized to perform 2010-2018) Parame
Mirror
Stanislav Korotky
This indicator predicts rate changes based on the chart display principle. It uses the idea that the price fluctuations consist of "action" and "reaction" phases, and the "reaction" is comparable and similar to the "action", so mirroring can be used to predict it. The indicator has three parameters: predict - the number of bars for prediction (24 by default); depth - the number of past bars that will be used as mirror points; for all depth mirroring points an MA is calculated and drawn on the ch
RenkoMaStoch
Sergey Deev
1 (1)
The indicator displays renko bars on a chart, uses them to plot the fast and slow moving average and Stochastic, as well as it provides buy/sell signals: a buy signal is generated when the fast moving is above the slow one, and the signal line of Stochastic crosses the lower level from bottom up; a sell signal is generated when the fast moving is below the slow one, and the signal line of Stochastic crosses the upper level from top to bottom; Renko is a non-trivial price display method. Instead
Your good friend
Sergei Semenov
Your Good Friends — this is not just an indicator, but your reliable trading assistant, designed for traders who value simplicity, clarity, and stability. It combines the best classic methods of technical analysis — support and resistance levels, reversal signals, visual cues — and presents them in the clearest, most user-friendly format possible. Suitable for both beginners and experienced traders — especially those who want to eliminate chaos, reduce stress, and trade based on clear signals.
ZhiBiCCI MT4
Qiuyang Zheng
[ZhiBiCCI] indicators are suitable for all cycle use, and are also suitable for all market varieties. [ZhiBiCCI] Green solid line is a reversal of bullish divergence. The green dotted line is a classic bullish divergence. [ZhiBiCCI] The solid line to the red is a reverse bearish divergence. The red dotted line is a classical bearish divergence. [ZhiBiCCI] can be set in the parameters (Alert, Send mail, Send notification), set to (true) to send instant signals to the alarm window, email, insta
Trend PA
Mikhail Nazarenko
5 (3)
The Trend PA indicator uses   Price Action   and its own filtering algorithm to determine the trend. This approach helps to accurately determine entry points and the current trend on any timeframe. The indicator uses its own algorithm for analyzing price changes and Price Action. Which gives you the advantage of recognizing, without delay, a new nascent trend with fewer false positives. Trend filtering conditions can be selected in the settings individually for your trading style. The indicator
Minotaur Waves Signal
Leandro Bernardez Camero
Minotaur Waves 는 잠재적인 전환점을 감지하고 가격 방향 전환을 높은 정확도로 확인하기 위해 설계된 고급 시장 분석 지표입니다. 이 시스템은 Minotaur Oscillator 의 강력함과 동적인 적응 밴드 구조를 결합하여 명확하고 신뢰할 수 있는 시각적 신호를 제공함으로써 신중한 진입 결정을 돕습니다. 모든 통화 쌍에서 사용 가능하며, 특히 EURUSD, GBPUSD, USDJPY 심볼에서 M1, M5, M15, M30 타임프레임에서 최적의 성능을 발휘합니다. 최신 소식과 가이드를 확인하세요: https://www.mql5.com/en/channels/forexnewadvisor 시스템 주요 구성 요소: 동적 밴드 시스템: 실시간 모멘텀 변화를 감지하고 주요 돌파 구간을 강조 표시 Minotaur Oscillator: 모멘텀 오실레이터로 히스토그램 형태의 극값을 표시하여 전환 구간을 확인 극값 검증: +33(상단) 또는 -33(하단)의 정확한 값으로 확인된 피크에서만
The indicator displays the data of the Stochastic oscillator from a higher timeframe on the chart. The main and signal lines are displayed in a separate window. The stepped response is not smoothed. The indicator is useful for practicing "manual" forex trading strategies, which use the data from several screens with different timeframes of a single symbol. The indicator uses the settings that are identical to the standard ones, and a drop-down list for selecting the timeframe. Indicator Paramet
Supply Demand WTC
Stefano Cocconi
Check My Product Contact me to discover all my services  Supply and demand zones are one of the most basic things a beginner forex trader learns. These zones are so important, price reacts off of them even after years since they first developed. And with the supply and demand zones indicator, a forex trader might not need to worry about drawing all these historical zones one after the other. The supply and demand zone indicator accurately draws the supply and demand zones of a currency pair o
The Th3Eng PipFinite indicator is based on a very excellent analysis of the right trend direction with perfect custom algorithms. It show the true direction and the best point to start trading. With StopLoss point and Three Take Profit points. Also it show the right pivot of the price and small points to order to replace the dynamic support and resistance channel, Which surrounds the price. And Finally it draws a very helpful Box on the left side on the chart includes (take profits and Stop loss
Trendiness Index
Libertas LLC
5 (3)
"The trend is your friend" is one of the best known sayings in investing, because capturing large trendy price movements can be extremely profitable. However, trading with the trend is often easier said than done, because many indicators are based on price reversals not trends. These aren't very effective at identifying trendy periods, or predicting whether trends will continue. We developed the Trendiness Index to help address this problem by indicating the strength and direction of price trend
이 제품의 구매자들이 또한 구매함
Gann Made Easy
Oleg Rodin
4.83 (152)
Gann Made Easy 는 mr.의 이론을 사용하여 최고의 거래 원칙을 기반으로 하는 전문적이고 사용하기 쉬운 Forex 거래 시스템입니다. W.D. 간. 이 표시기는 Stop Loss 및 Take Profit Levels를 포함하여 정확한 BUY 및 SELL 신호를 제공합니다. PUSH 알림을 사용하여 이동 중에도 거래할 수 있습니다. 거래 팁, 보너스, GANN MADE EA를 무료로 받으시려면 구매 후 저에게 연락주세요! 아마도 Gann 거래 방법에 대해 이미 여러 번 들었을 것입니다. 일반적으로 Gann의 이론은 초보자 거래자뿐만 아니라 이미 거래 경험이 있는 사람들에게도 매우 복잡한 것입니다. Gann의 거래 방식은 이론적으로 적용하기 쉽지 않기 때문입니다. 나는 그 지식을 연마하고 Forex 지표에 최고의 원칙을 적용하기 위해 몇 년을 보냈습니다. 표시기는 적용하기가 매우 쉽습니다. 차트에 첨부하고 간단한 거래 권장 사항을 따르기만 하면 됩니다. 지표는 지속적으로 시장
Smc Blast Signal
Mohit Dhariwal
5 (3)
NEW YEAR 2026 SALE OFFER PRICE AT JUST 99 DOLLARS FEW COPIES ONLY AT This price From 10th Jan -20th Jan MIDNIGHT Final offer GRAB YOUR COPY ON THIS New Year EVE Prices will be increased to 150 after the offer period ends Full Fledged EA and Alert plus for alerts will also be provided in this offer along with the purchase of Indicator. Limited copies only at this price and Ea too. Grab your copy soon Alert plus for indicator with set file is kept in comment section with the image  SMC Blast Signa
Scalper Inside PRO
Alexey Minkov
4.74 (69)
An exclusive indicator that utilizes an innovative algorithm to swiftly and accurately determine the market trend. The indicator automatically calculates opening, closing, and profit levels, providing detailed trading statistics. With these features, you can choose the most appropriate trading instrument for the current market conditions. Additionally, you can easily integrate your own arrow indicators into Scalper Inside Pro to quickly evaluate their statistics and profitability. Scalper Inside
M1 Sniper
Oleg Rodin
4.89 (18)
M1 SNIPER 는 사용하기 쉬운 거래 지표 시스템입니다. M1 시간대에 맞춰 설계된 화살표 지표입니다. 이 지표는 M1 시간대 스캘핑을 위한 단독 시스템으로 사용할 수 있으며, 기존 거래 시스템의 일부로도 사용할 수 있습니다. 이 거래 시스템은 M1 시간대 거래용으로 특별히 설계되었지만, 다른 시간대에도 사용할 수 있습니다. 원래는 XAUUSD와 BTCUSD 거래를 위해 이 방법을 설계했지만, 다른 시장 거래에도 유용하다는 것을 알게 되었습니다. 이 지표의 신호는 추세 방향과 반대로 거래될 수 있습니다. 저는 지표의 신호를 활용하여 양방향으로 거래할 수 있도록 돕는 특별한 거래 기법을 알려드립니다. 이 방법은 특별한 동적 지지선과 저항선 가격 영역을 활용하는 것을 기반으로 합니다. 구매하시면 M1 SNIPER 화살표 지표를 바로 다운로드하실 수 있습니다. 또한, 아래 스크린샷에 표시된 Apollo Dynamic SR 지표는 M1 SNIPER 도구를 사용하는 모든 사용자에게 무료로
현재 20% 할인 ! 초보자 또는 전문가 트레이더를 위한 최고의 솔루션! 이 대시보드 소프트웨어는 28개의 통화 쌍에서 작동합니다. 2가지 주요 지표(Advanced Currency Strength 28 및 Advanced Currency Impulse)를 기반으로 합니다. 전체 Forex 시장에 대한 훌륭한 개요를 제공합니다. 고급 통화 강도 값, 통화 이동 속도 및 모든(9) 시간대의 28 Forex 쌍에 대한 신호를 보여줍니다. 추세 및/또는 스캘핑 기회를 정확히 파악하기 위해 차트의 단일 지표를 사용하여 전체 시장을 볼 수 있을 때 거래가 어떻게 개선될지 상상해 보십시오! 잠재적인 거래를 식별하고 확인하면서 강력한 통화와 약한 통화를 더욱 쉽게 식별할 수 있도록 이 지표에 기능을 내장했습니다. 이 표시기는 통화의 강세 또는 약세가 증가 또는 감소하는지 여부와 모든 시간대에서 수행되는 방식을 그래픽으로 보여줍니다. 추가된 새로운 기능은 현재 시장 조건 변화에 적응하는
Gold Signal Pro
Mohamed Hassan
First 25 copies at $80, after that price becomes $149 (4 copies left) Gold Signal Pro is a powerful MT4 indicator designed to help traders spot strong price reactions in the market. It focuses on clear wick rejections , showing when price strongly rejects a level and often continues in the same direction. Gold Signal Pro is mainly built for scalping gold (XAUUSD) and works best on lower timeframes like M5 and M15 , where timing matters most. That said, it can also be used on any forex pair, a
GOLD Impulse with Alert
Bernhard Schweigert
4.64 (11)
이 지표는 Advanced Currency IMPULSE with ALERT  +   Currency Strength Exotics  의 2가지 제품의 슈퍼 조합입니다. 그것은 모든 시간 프레임에 대해 작동하며 8개의 주요 통화와 하나의 기호에 대한 강약의 충동을 그래픽으로 보여줍니다! 이 표시기는 금, 이국적인 쌍, 상품, 지수 또는 선물과 같은 기호에 대한 통화 강도 가속을 표시하는 데 특화되어 있습니다. 금, 은, 오일, DAX, US30, MXN, TRY, CNH 등의 진정한 통화 강도 가속(충동 또는 속도)을 표시하기 위해 9번째 줄에 모든 기호를 추가할 수 있습니다. 새로운 기본 알고리즘을 기반으로 구축되어 잠재적인 거래를 훨씬 더 쉽게 식별하고 확인할 수 있습니다. 이는 통화의 강세 또는 약세가 가속되는지 여부를 그래픽으로 표시하고 가속 속도를 측정하기 때문입니다. 자동차의 속도계처럼 생각하면 됩니다. 가속화할 때 Forex 시장에서 동일한 일이 분명히 더 빠르
Atomic Analyst
Issam Kassas
5 (3)
우선적으로 언급할 점은이 거래 지표가 다시 그리지 않고 지연되지 않으며 이를 통해 수동 및 로봇 거래 모두에 이상적이라는 점입니다. 사용자 매뉴얼: 설정, 입력 및 전략. Atomic Analyst는 가격의 강도와 모멘텀을 활용하여 시장에서 더 나은 이점을 찾는 PA Price Action Indicator입니다. 고급 필터를 장착하여 잡음과 거짓 신호를 제거하고 거래 잠재력을 높이는 데 도움이 됩니다. 복잡한 지표의 다중 레이어를 사용하여 Atomic Analyst는 차트를 스캔하고 복잡한 수학적 계산을 간단한 신호와 색상으로 변환하여 초보 트레이더가 이해하고 일관된 거래 결정을 내릴 수 있도록합니다. "Atomic Analyst"는 새로운 및 경험이 풍부한 트레이더를위한 종합적인 거래 솔루션입니다. 프리미엄 지표와 최고 수준의 기능을 하나의 거래 전략에 결합하여 모든 종류의 트레이더에 대한 다재다능한 선택지가되었습니다. 인트라데이 거래 및 스캘핑 전략 : 빠르고 정확한 일일
Trend indicator AI
Ramil Minniakhmetov
4.9 (77)
트렌드 인공 지능 지표는 실행 가능한 진입 점 및 반전 경고와 추세 식별을 결합하여 상인의 시장 분석을 향상시킬 훌륭한 도구입니다. 이 표시기는 사용자가 자신감과 정밀도로 외환 시장의 복잡성을 탐색 할 수 있도록 지원합니다 기본 신호 외에도 트렌드 인공 지능 지표는 풀백 또는 되돌림 중에 발생하는 2 차 진입 점을 식별하여 거래자가 기존 트렌드 내에서 가격 수정을 활용할 수 있도록합니다. 중요한 장점: ·작동 4 및 5 *명확한 구매 또는 판매 신호 *다시 칠하지 않습니다 *모든 자산에서 작동 나는 전보 사기에 개 또는 세트를 판매하지 않도록주의. 모든 설정은 블로그에 여기에 무료.  중요! 지침 및 보너스를 얻기 위해 구입 후 즉시 저에게 연락! 진짜 가동 감시는 뿐 아니라 나의 다른 제품 여기에서 찾아낼 수 있습니다: https://www.mql5.com/en/users/mechanic/seller&nbsp ; 설정 및 입력: 모든 자산에 대해 기본 설정을 권
Volatility Trend System - a trading system that gives signals for entries. The volatility system gives linear and point signals in the direction of the trend, as well as signals to exit it, without redrawing and delays. The trend indicator monitors the direction of the medium-term trend, shows the direction and its change. The signal indicator is based on changes in volatility and shows market entries. The indicator is equipped with several types of alerts. Can be applied to various trading ins
Dynamic Forex28 Navigator
Bernhard Schweigert
4.43 (7)
Dynamic Forex28 Navigator - 차세대 외환 거래 도구. 현재 49% 할인. Dynamic Forex28 Navigator는 오랫동안 인기 있는 지표의 진화형으로, 세 가지의 힘을 하나로 결합했습니다. 고급 통화 Strength28 지표(695개 리뷰) + 고급 통화 IMPULSE with ALERT(520개 리뷰) + CS28 콤보 신호(보너스). 지표에 대한 자세한 정보 https://www.mql5.com/en/blogs/post/758844 차세대 Strength 지표는 무엇을 제공합니까?  원래 지표에서 좋아했던 모든 것이 새로운 기능과 더 높은 정확도로 강화되었습니다. 주요 기능: 독점적인 통화 Strength 공식.  모든 시간대에 걸쳐 부드럽고 정확한 강도선. 추세와 정확한 진입을 식별하는 데 이상적입니다. 역동적인 시장 피보나치 수준(시장 피보나치).  이 지표에만 있는 고유한 기능. 가격 차트가 아닌 통화 강도에 피보나치가 적용됩니다.
Apollo SR Master
Oleg Rodin
5 (1)
Apollo SR Master는 지지/저항 구간에서의 거래를 더욱 쉽고 안정적으로 만들어 주는 특수 기능을 갖춘 지지/저항 지표입니다. 이 지표는 지역 가격의 고점과 저점을 감지하여 시간 지연 없이 실시간으로 지지/저항 구간을 계산합니다. 새롭게 형성된 저항 구간을 확인하기 위해 지표는 해당 저항 구간을 실제 매도 또는 매수 신호로 활용할 수 있음을 나타내는 특수 신호를 표시합니다. 이 경우, 저항 구간의 강도가 높아지고, 따라서 저항 구간에서의 성공적인 거래 가능성도 높아집니다. 이것이 바로 이 지표의 핵심 아이디어입니다. SR 존은 손절매와 이익실현을 더욱 쉽게 할 수 있도록 해줍니다. 신호 방향에 따라 SR 존 위 또는 아래 공간을 손절매로 활용할 수 있습니다. 또한, 반대쪽 SR 존은 잠재적 이익실현 영역으로 활용할 수 있습니다. 또한 Apollo SR Master 지표를 사용하는 모든 사용자에게 "Apollo Price Action System" 지표를 무료로 제공합니다.
Miraculous Indicator – Gann Square of Nine 기반 100% 비리페인트 Forex 및 바이너리 도구 이 영상은 Miraculous Indicator 를 소개합니다. 이 지표는 Forex 및 바이너리 옵션 트레이더를 위해 특별히 개발된 매우 정확하고 강력한 트레이딩 도구입니다. 이 지표가 독특한 이유는 전설적인 **Gann Square of Nine(Gann 9의 사각형)**과 **Gann's Law of Vibration(Gann 진동의 법칙)**에 기반을 두고 있기 때문입니다. 이는 현대 트레이딩에서 가장 정밀한 예측 도구 중 하나로 손꼽힙니다. Miraculous Indicator는 완전히 비리페인트(non-repaint) 됩니다. 즉, 캔들이 마감된 후에도 신호가 변경되거나 사라지지 않습니다. 보이는 것이 곧 결과입니다. 이는 트레이더가 자신감을 가지고 거래에 진입하고 청산할 수 있는 신뢰할 수 있고 일관된 기반을 제공합니다. 주요 특징: Gann
ZeusArrow Smart Liquidity Finder  Smart Liquidity Finder is Ai controlled indicator based on the Idea of Your SL is My Entry. It scan and draws the major Liquidity areas on chart partitioning them with Premium and Discount Zone and allows you find the best possible trading setups and help you decide the perfect entry price to avoid getting your Stop Loss hunted . Now no more confusion about when to enter and where to enter. Benefit from this one of it's kind trading tool powered by Ai an trade
Algo Pumping MT4
Ihor Otkydach
4.69 (16)
PUMPING STATION – 당신만을 위한 올인원(All-in-One) 전략 PUMPING STATION은 당신의 외환 거래를 더욱 흥미롭고 효과적으로 바꿔줄 혁신적인 인디케이터입니다. 단순한 보조 도구가 아니라, 강력한 알고리즘을 갖춘 완전한 거래 시스템으로서 보다 안정적인 트레이딩을 시작할 수 있도록 도와줍니다. 이 제품을 구매하시면 다음의 혜택을   무료로   받으실 수 있습니다: 전용 설정 파일: 자동 설정으로 최대의 퍼포먼스를 제공합니다. 단계별 동영상 가이드: PUMPING STATION 전략으로 거래하는 법을 배워보세요. Pumping Utility: PUMPING STATION과 함께 사용하도록 설계된 반자동 거래 봇으로, 거래를 더욱 쉽고 편리하게 만들어줍니다. ※ 구매 후 바로 저에게 메시지를 보내주세요. 추가 자료에 대한 접근 권한을 제공해드립니다. PUMPING STATION은 어떻게 작동하나요? 트렌드 컨트롤: 시장의 추세 방향을 즉시 파악합니다. 추세는
Matrix Arrow Indicator MT4
Juvenille Emperor Limited
5 (3)
매트릭스 화살표 표시기 MT4 는 외환, 상품, 암호 화폐, 지수, 주식과 같은 모든 기호/도구에 사용할 수 있는 100% 다시 칠하지 않는 다중 기간 표시기를 따르는 고유한 10 in 1 추세입니다.  Matrix Arrow Indicator MT4 는 다음과 같은 최대 10개의 표준 지표에서 정보와 데이터를 수집하여 초기 단계에서 현재 추세를 결정합니다. 평균 방향 이동 지수(ADX) 상품 채널 지수(CCI) 클래식 하이켄 아시 캔들 이동 평균 이동 평균 수렴 발산(MACD) 상대 활력 지수(RVI) 상대 강도 지수(RSI) 포물선 SAR 스토캐스틱 오실레이터 윌리엄스의 백분율 범위 모든 지표가 유효한 매수 또는 매도 신호를 제공하면 강력한 상승/하락 추세를 나타내는 다음 캔들/막대가 시작될 때 해당 화살표가 차트에 인쇄됩니다. 사용자는 사용할 표시기를 선택하고 각 표시기의 매개변수를 개별적으로 조정할 수 있습니다. 매트릭스 화살표 표시기 MT4는 선택한 표시기에서만 정보를 수
Trend Lines PRO
Roman Podpora
5 (1)
트렌드 라인즈 프로       이 지표는 시장이 실제로 어떤 방향으로 전환되는지 파악하는 데 도움이 됩니다. 실제 추세 반전 지점과 주요 시장 참여자들이 다시 진입하는 지점을 보여줍니다. 보시다시피       BOS 라인       복잡한 설정이나 불필요한 노이즈 없이 더 높은 시간대의 추세 변화와 주요 레벨을 확인할 수 있습니다. 신호는 차트에 다시 그려지지 않고 캔들이 마감된 후에도 계속 표시됩니다. 지표가 보여주는 내용: 실제 변화       추세(BOS 라인) 한 번 신호가 나타나면 그 신호는 계속 유효합니다! 이는 신호를 발생시킨 후 변경될 수 있는 리페인팅 방식의 지표와 중요한 차이점입니다. 리페인팅 방식의 지표는 잠재적으로 자금 손실로 이어질 수 있습니다. 이제 더욱 높은 확률과 정확도로 시장에 진입할 수 있습니다. 또한 화살표가 나타난 후 목표가(익절)에 도달하거나 반전 신호가 나타날 때까지 캔들스틱 색상이 계속 바뀌는 기능도 있습니다. 반복 항목          
이 지표를 구매하면 제 프로페셔널 트레이드 매니저를 무료로 드립니다. 우선 이 거래 시스템이 리페인팅, 리드로잉 및 레이그 인디케이터가 아니라는 점을 강조하는 것이 중요합니다. 이는 수동 및 로봇 거래 모두에 이상적인 것으로 만듭니다. 온라인 강좌, 설명서 및 프리셋 다운로드. "스마트 트렌드 트레이딩 시스템 MT5"은 새로운 및 경험이 풍부한 트레이더를 위해 맞춤형으로 제작된 종합적인 거래 솔루션입니다. 10개 이상의 프리미엄 인디케이터를 결합하고 7개 이상의 견고한 거래 전략을 특징으로 하여 다양한 시장 조건에 대한 다목적 선택이 가능합니다. 트렌드 추종 전략: 효과적인 트렌드 추이를 타기 위한 정확한 진입 및 손절 관리를 제공합니다. 반전 전략: 잠재적인 트렌드 반전을 식별하여 트레이더가 범위 시장을 활용할 수 있게 합니다. 스캘핑 전략: 빠르고 정확한 데이 트레이딩 및 단기 거래를 위해 설계되었습니다. 안정성: 모든 인디케이터가 리페인팅, 리드로잉 및 레이그가 아니므로 신뢰
FX Power MT4 NG
Daniel Stein
4.95 (20)
FX Power: 통화 강세 분석으로 더 스마트한 거래 결정을 개요 FX Power 는 어떤 시장 상황에서도 주요 통화와 금의 실제 강세를 이해하기 위한 필수 도구입니다. 강한 통화를 매수하고 약한 통화를 매도함으로써 FX Power 는 거래 결정을 단순화하고 높은 확률의 기회를 발견합니다. 트렌드를 따르거나 극단적인 델타 값을 사용해 반전을 예측하고자 한다면, 이 도구는 귀하의 거래 스타일에 완벽히 적응합니다. 단순히 거래하지 말고, FX Power 로 더 스마트하게 거래하세요. 1. FX Power가 거래자에게 매우 유용한 이유 통화와 금의 실시간 강세 분석 • FX Power 는 주요 통화와 금의 상대적 강세를 계산하고 표시하여 시장 역학에 대한 명확한 통찰력을 제공합니다. • 어떤 자산이 앞서고 있고 어떤 자산이 뒤처지는지 모니터링하여 보다 현명한 거래 결정을 내릴 수 있습니다. 포괄적인 멀티 타임프레임 뷰 • 단기, 중기 및 장기 타임프레임에서 통화와 금의 강세를
PZ Day Trading
PZ TRADING SLU
3.67 (3)
Effortless trading: non-repainting indicator for accurate price reversals This indicator detects price reversals in a zig-zag fashion, using only price action analysis and a donchian channel. It has been specifically designed for short-term trading, without repainting or backpainting at all. It is a fantastic tool for shrewd traders aiming to increase the timing of their operations. [ Installation Guide | Update Guide | Troubleshooting | FAQ | All Products ] Amazingly easy to trade It provides
Advanced Accumulated Currency Volume
Bernhard Schweigert
4.54 (48)
현재 20% 할인! 초보자 또는 전문가 상인을위한 최상의 솔루션! 이 지표는 새로운 공식과 함께 여러 독점적 인 기능을 통합했기 때문에 저렴한 거래 도구입니다. 고급 누적 통화 볼륨 표시기는 메인 28 외환 쌍에 특화되어 있으며 모든 시간 프레임에서 작동합니다. 단일 차트에서 AUD, CAD, CHF, EUR, GBP, JPY, NZD 및 USD의 모든 통화 볼륨 (C-Volume)을 추출하는 새로운 공식입니다. 이것은 거래에서 큰 이점입니다. 볼륨 트레이더는 사용 방법을 알게 될 것입니다. 당신이 새로운 경우, 극단적 인 값을 읽고 거래 무기고에 추가하는 방법을 배우십시오. C- 볼륨을 총이 아니라 방패로 생각하십시오. 기본 차트에 경고 표시가 표시됩니다. 이것은 일반적으로 사용되는 단순한 쌍의 부피가 아닙니다. 외환 시장은 스캔되며 각 통화에 대한 볼륨은 추출되어 C- 볼륨으로 축적됩니다. 이제 어떤 통화가 가장 높거나 가장 낮은 볼륨을 확인할 수 있습니다. 우리는
M1 Arrow
Oleg Rodin
5 (20)
시장의 두 가지 기본 원칙에 기반한 일중 전략. 알고리즘은 추가 필터를 사용하여 거래량 및 가격 파동 분석을 기반으로 합니다. 지표의 지능형 알고리즘은 두 가지 시장 요인이 하나로 결합될 때만 신호를 제공합니다. 지표는 더 높은 시간 프레임의 데이터를 사용하여 M1 차트에서 특정 범위의 파도를 계산합니다. 그리고 파동을 확인하기 위해 지표는 볼륨 분석을 사용합니다. 이 표시기는 준비된 거래 시스템입니다. 트레이더가 필요로 하는 모든 것은 신호를 따르는 것입니다. 또한 지표는 자신의 거래 시스템의 기초가 될 수 있습니다. 거래는 분 차트에서만 수행됩니다. 지표가 MTF 원리를 사용한다는 사실에도 불구하고 지표 알고리즘은 가능한 한 안정적입니다. 구매 후 반드시 저에게 편지를 보내주세요! 내 거래 설정 및 권장 사항을 공유하겠습니다!
F-16 비행기 지표를 소개합니다. 이것은 귀하의 거래 경험을 혁신하도록 설계된 최첨단 MT4 도구입니다. F-16 전투기의 비할 데 없는 속도와 정밀성에 영감을 받아이 지표는 고급 알고리즘과 최첨단 기술을 결합하여 금융 시장에서 압도적인 성능을 제공합니다. F-16 비행기 지표를 사용하면 실시간 분석을 제공하고 매우 정확한 거래 신호를 생성하여 경쟁을 앞서갈 수 있습니다. 다양한 자산 클래스에서 수익 기회를 식별하는 데 필요한 동적 기능을 갖추고 있어 확신을 가지고 정보에 근거한 결정을 내릴 수 있습니다. 사용자 친화적인 인터페이스로 구성된 F-16 비행기 지표는 인기있는 MetaTrader 4 플랫폼과 완벽하게 통합되어 원활하고 효율적인 거래 과정을 보장합니다. 초보자 트레이더든 경험 많은 전문가든 이 지표를 쉽게 사용자 정의하여 고유한 거래 스타일과 선호도에 맞출 수 있습니다. F-16 비행기 지표의 강력함을 경험해 보세요. 이 지표는 시장 트렌드를 정확하고 민첩하게 탐색하며
FX Volume
Daniel Stein
4.63 (38)
FX Volume: 브로커 시각에서 바라보는 진짜 시장 심리 간단 요약 트레이딩 접근 방식을 한층 더 향상시키고 싶으신가요? FX Volume 는 소매 트레이더와 브로커의 포지션을 실시간으로 파악할 수 있게 해 줍니다. 이는 COT 같은 지연된 보고서보다 훨씬 빠릅니다. 꾸준한 수익을 추구하는 분이든, 시장에서 더 깊은 우위를 원하시는 분이든, FX Volume 을 통해 대규모 불균형을 찾아내고, 돌파 여부를 확인하며 리스크 관리를 정교화할 수 있습니다. 지금 시작해 보세요! 실제 거래량 데이터가 의사결정을 어떻게 혁신할 수 있는지 직접 경험해 보시기 바랍니다. 1. 트레이더에게 FX Volume이 매우 유익한 이유 탁월한 정확도를 지닌 조기 경보 신호 • 다른 사람들보다 훨씬 앞서, 각 통화쌍을 매수·매도하는 트레이더 수를 거의 실시간으로 파악할 수 있습니다. • FX Volume 은 여러 리테일 브로커에서 추출한 실제 거래량 데이터를 종합해 명확하고 편리한 형태로 제공하는
SMC Easy Signal
Mohamed Hassan
4.73 (15)
SMC Easy Signal was built to remove the confusion around the smart money concept by turning structural shifts like BOS (Break of Structure) and CHoCH (Change of Character) into simple buy and sell trading signals. It simplifies market structure trading by automatically identifying breakouts and reversals as they happen, allowing traders to focus on execution rather than analysis. Whether the market is continuing its trend or preparing to reverse, the indicator translates complex price action in
PRO Renko System
Oleg Rodin
5 (30)
PRO Renko System 은 RENKO 차트 거래를 위해 특별히 고안된 매우 정확한 거래 시스템입니다. 이것은 다양한 거래 상품에 적용될 수있는 보편적 인 시스템입니다. 체계는 효과적으로 당신에게 정확한 반전 신호에 접근을 주는 소위 시장 소음을 중화합니다. 이 표시기는 사용하기가 매우 쉽고 신호 생성을 담당하는 매개 변수가 하나만 있습니다. 당신은 쉽게 당신의 선택의 어떤 무역 계기에 공구를 적응시킬 수 있고 renko 막대기의 크기. 나는 항상 당신이 내 소프트웨어로 수익성있게 거래 할 수 있도록 추가 지원을 제공 할 준비가되어 있습니다! 나는 당신에게 행복하고 수익성있는 거래를 기원합니다! 구매 후 저에게 연락하십시오! 내 렌코 차트 생성기를 보내드립니다. 또한 내 개인 권장 사항 및 시스템의 다른 모듈을 무료로 공유 할 것입니다!
System Trend Pro
Aleksandr Makarov
5 (2)
System Trend Pro - This is the best trend trading indicator!!! The indicator no repaint!!!  The indicator has   MTF   mode, which adds confidence to trading on the trend (   no repaint   ). How to trade? Everything is very simple, we wait for the first signal (big arrow), then wait for the second signal (small arrow) and enter the market in the direction of the arrow. (See screens 1 and 2.) Exit on the opposite signal or take 20-30 pips, close half of it, and keep the rest until the opposite
Trend Arrow Super
Aleksandr Makarov
5 (2)
Trend Arrow Super The indicator not repaint or change its data. A professional, yet very easy to use Forex system. The indicator gives accurate BUY\SELL signals. Trend Arrow Super is very easy to use, you just need to attach it to the chart and follow simple trading recommendations. Buy signal: Arrow + Histogram in green color, enter immediately on the market to buy. Sell signal: Arrow + Histogram of red color, enter immediately on the market to sell.
Advanced Currency Strength28 Indicator
Bernhard Schweigert
4.91 (657)
현재 26% 할인 초보자 또는 전문가 트레이더를 위한 최고의 솔루션! 이 지표는 우리가 독점 기능과 새로운 공식을 통합했기 때문에 독특하고 고품질이며 저렴한 거래 도구입니다. 단 하나의 차트로 28 Forex 쌍의 통화 강도를 읽을 수 있습니다! 새로운 추세 또는 스캘핑 기회의 정확한 트리거 포인트를 정확히 찾아낼 수 있기 때문에 거래가 어떻게 개선될지 상상해 보십시오. 사용 설명서: 여기를 클릭  https://www.mql5.com/en/blogs/post/697384 그것이 첫 번째, 원본입니다! 쓸모없는 지망생 클론을 사지 마십시오. 더 스페셜  강력한 통화 모멘텀을 보여주는 하위 창의 화살표 GAP가 거래를 안내합니다! 기본 또는 호가 통화가 과매도/과매도 영역(외부 시장 피보나치 수준)에 있을 때 개별 차트의 기본 창에 경고 표시가 나타납니다. 통화 강도가 외부 범위에서 떨어질 때 풀백/반전 경고. 교차 패턴의 특별 경고 추세를 빠르게 볼 수 있는 다중 시간
Gold Scalper Super
Aleksandr Makarov
5 (1)
Gold Scalper Super is an easy-to-use trading system. The indicator can be used as a standalone scalping system on the M1 time frame, as well as part of your existing trading system. Bonus: when purchasing an indicator, Trend Arrow Super is provided free of charge, write to us after purchase. The indicator 100% does not repaint!!! If a signal appears, it does not disappear! Unlike indicators with redrawing, which lead to the loss of a deposit, because they can show a signal and then remove it.
제작자의 제품 더 보기
Bazooka EA
Davit Beridze
Bazooka EA – MT4용 트렌드 및 모멘텀 기반 전문가 자문 기본 설정은 2024년 초부터 현재까지 GOLD M5 (Open Prices 방식)에서 EA를 백테스트하도록 구성되어 있습니다. 다른 타임프레임에 대한 최적의 설정은 댓글란을 참고해 주십시오. Bazooka EA 는 MetaTrader 4 용 완전 자동 매매 전문가 자문(Expert Advisor)으로, **추세 확인(Trend Confirmation)**과 **모멘텀 필터링(Momentum Filtering)**을 결합하여 방향성 있는 시장 움직임을 거래하도록 설계되었습니다. 이 EA는 통제된 진입과 규칙적인 청산에 중점을 두며, 과도한 매매나 고위험 포지션 관리 기법을 사용하지 않습니다. Bazooka EA는 명확한 규칙 기반 전략과 조정 가능한 리스크 관리를 선호하는 트레이더에게 적합합니다. 전략 설명 Bazooka EA는 다음과 같은 기술적 요소의 조합을 통해 시장을 분석합니다. 이동평균선(Moving Ave
2024년 이후 골드 (Gold M15) 테스트의 기본 설정 Kaufman Smart Regime EA: 적응형 시장 인텔리전스 ️ 특별 출시 기념 제안: Smart Regime EA의 강력한 기능이 실제 가치보다 훨씬 낮은 가격에 출시됩니다. 최종 가격인 $500 을 향한 단계적 인상이 시작되기 전에 지금 바로 $50 에 라이선스를 확보하십시오. 이는 타의 추종을 불허하는 시장 논리에 대한 투자입니다. 적응형 알고리즘 트레이딩의 힘을 잠금 해제하십시오. Kaufman Smart Regime EA는 단순한 전략을 넘어, 노이즈와 진정한 모멘텀을 구별하도록 설계된 시장 감지 엔진 입니다. 핵심 철학: "스마트 레짐(Smart Regime)" 감지 대부분의 알고리즘은 동적인 시장에 정적인 논리를 적용하기 때문에 실패합니다. Kaufman Smart Regime EA 는 Perry Kaufman의 전설적인 효율성 비율 논리를 독자적으로 적용하여 시장의 "레짐(Regime)"을 결정합니다
RSI Entry Points MT5
Davit Beridze
5 (1)
RSI Entry Points is the upgrade of the standard RSI indicator to avoid lagging. Indicator draws the clouds and the arrows to have clear picture where price is and what to wait for. Why standard RSI is lagging? because mostly we do not use it correctly and it is with very weak visual flexibility, less informativity. With my current upgrade I tried to Fix both problems same time and I got much better results and more exact entries than standard RSI has. To make yourself sure check out the screens
Speed Trend Matrix Ultimate (버전 5.10) Speed Trend Matrix (STM) 는 단일 지표 안에 통합된 포괄적인 트레이딩 시스템입니다. 단순히 과매수 또는 과매도 상태를 보여주는 표준 오실레이터와 달리, STM은 시장 변동성(ATR) 대비 가격 움직임의 **"속도"**를 분석합니다. 이는 추세 방향뿐만 아니라 움직임의 강도를 식별하며, 트레이더들이 휩소(whipsaw)에 걸리기 쉬운 낮은 모멘텀의 "횡보(Flat)" 기간을 필터링합니다. 이 도구는 모든 거래에 대한 완전한 로드맵이 필요한 트레이더를 위해 설계되었습니다. 단순한 진입 신호뿐만 아니라, 선택한 트레이딩 스타일에 따라 권장되는 손절매(Stop Loss) 및 이익 실현(Take Profit) 수준을 차트 위에 자동으로 계산하여 투영합니다. 핵심 철학 이 지표는 가격 속도를 기반으로 시장 행동을 세 가지 구별되는 영역으로 나눕니다. UpZone (녹색): 강한 상승 모멘텀이 존재하는 상태.
Auto Optimized RSI   is a smart and easy-to-use arrow indicator designed for precision trading. It automatically finds the most effective RSI Buy and Sell levels for your selected symbol and timeframe using real historical data simulations. The indicator can be used as a standalone system or as part of your existing trading strategy. It is especially useful for intraday trading. Unlike traditional RSI indicators that rely on fixed 70/30 levels,   Auto Optimized RSI   dynamically adjusts its lev
Auto Optimized RSI
Davit Beridze
5 (2)
Auto Optimized RSI: 전문가용 시장 적응형 시스템 대부분의 트레이더가 실패하는 이유는 역동적인 시장에서 고정된 도구를 사용하기 때문입니다. 모든 차트에서 70/30과 같은 고정된 RSI 레벨을 사용하는 것은 수학적 오류입니다. 논리적 근거가 없는 단순한 "마법 화살표"를 찾고 계신다면, 이 지표는 적합하지 않습니다. 본 도구는 '최적화만이 트레이딩 생존의 유일한 열쇠'임을 이해하는 전문가들을 위해 설계되었습니다. 일반적인 지표들은 당신이 거래하는 종목이나 타임프레임을 고려하지 않습니다. Auto Optimized RSI 는 다릅니다. 과거 데이터를 기반으로 내부 시뮬레이션을 수행하여, 최근 시장에서 가격이 실제로 반전되었던 정확한 레벨을 찾아냅니다. 이것은 추측이 아니라 계산입니다. 기술적 우위: 자가 적응형 로직: 현재 시장 변동성에 따라 매수/매도 구역을 자동으로 재계산합니다. 수학적 검증: 승률(Win Rate), 드로다운(Drawdown), 평균 손익 등의 퍼포
Auto Optimized MFI
Davit Beridze
5 (1)
Auto Optimized MFI 는 자동으로 조정되는 인디케이터로, 과거 데이터를 기반으로 실제 거래 시뮬레이션을 수행하여 시장과 시간 프레임에 가장 적합한 MFI 매수/매도 레벨을 찾아냅니다. 고정된 80/20 기준을 사용하는 기존 MFI와 달리, 실제 가격과 거래량의 움직임에 따라 유연하게 반응합니다. 작동 방식 사용자가 설정한 범위 내의 과거 캔들을 분석하고, MFI 신호를 기반으로 진입 및 청산 시뮬레이션을 실행합니다. 승률, 최대 낙폭(Drawdown), 손절/이익실현 결과 등을 기록하여, 그 데이터를 바탕으로 최적의 MFI 레벨을 일간, 주간 또는 월간 단위로 자동 업데이트합니다. 주요 기능 설정 가능한 MFI 기간 (기본값: 14) 최적화 범위(캔들 수) 조절 가능 매수/매도 레벨 범위 사용자 정의 가능 세밀한 조정을 위한 스텝 크기 설정 최소 수익 목표 설정으로 비효율 전략 필터링 MFI 선 및 신호 화살표의 스타일 사용자 지정 가능 고정된 규칙에 의존하지 않고, 시
자동 최적화 볼린저 밴드 – 실제 시장 움직임에 기반한 적응형 변동성 도구 자동 최적화 볼린저 밴드는 과거 거래 시뮬레이션을 통해 최적의 기간과 표준 편차 값을 자동으로 찾아내는 MT4용 고급 지표입니다. 고정 설정에 의존하지 않고 시장 변화와 가격 구조에 동적으로 적응하여 실시간으로 변동성을 보다 정확하게 반영하는 밴드를 생성합니다. 수동 조정이 필요 없습니다. 주요 기능: 과거 데이터 기반 볼린저 밴드 매개변수 자동 최적화 중요한 전환점에 매수 및 매도 신호 화살표 표시 사운드, 팝업, 푸시 알림 내장 최적화 깊이, 표시 및 신호 설정 조절 가능 외환, 금, 지수, 암호화폐 등 다양한 자산에 적합 데이 트레이딩과 스윙 트레이딩에 이상적이며, 기존의 고정형 지표보다 더 스마트한 변동성 분석을 제공합니다. ...
PRO Trend Divergence
Davit Beridze
5 (2)
이 지표는 테스트용이 아닌 실시간 차트용입니다. PRO Trend Divergence 지표는 추세 지속 다이버전스 를 감지하는 고급 기술 분석 도구입니다. 이는 현재 추세가 계속될 가능성이 높다는 신호를 제공합니다. 일반적인 지표가 추세 반전에 중점을 두는 반면, 이 도구는 일시적인 조정이나 되돌림이 발생하더라도 추세가 여전히 강한 상황을 파악하는 데 도움을 줍니다. 추세 지속 다이버전스 는 가격이 추세에 따라 움직일 때(상승 추세에서는 더 높은 저점, 하락 추세에서는 더 낮은 고점) 발생하지만 선택된 지표는 반대 방향을 가리킵니다. 이는 추세가 계속될 가능성이 높음을 확인해줍니다. PRO Trend Divergence 지표는 트레이더가 자신 있게 추세를 따라가고, 조기 청산 위험을 줄이는 데 유용합니다. 주요 기능 및 장점 다중 지표 지원 MACD, RSI, Stochastic, CCI, Momentum, OBV, VW-MACD, CMF, MFI와 함께 작동합니다. 차트에 시각적
MA Speedometer
Davit Beridze
4.6 (10)
Dashboard for Ma Speedometer:  https://www.mql5.com/en/market/product/116784 Non standard attitude to the standard moving average indicator. The essence of the indicator is to determine the strength and speed of the price direction by determining the tilt angle of the moving average. A point is taken on the fifteenth MA candle and a point on the last closed MA candle, a straight line is drawn between them, it is movable and on a hemisphere shows an angle of inclination from 90 degrees to -90. a
MTF Chart PRO
Davit Beridze
MTF 차트 프로: 패턴, 지지/저항선 및 알림 기능을 갖춘 다중 시간대 분석 도구 개요 MTF 차트 프로는 고급 MetaTrader 4 지표로, 여러 시간대의 맞춤형 캔들을 현재 차트에 직접 겹쳐서 표시하여 창을 전환할 필요 없이 끊김 없는 다중 시간대(MTF) 분석을 가능하게 합니다. 외환, 주식 및 암호화폐 트레이더에게 이상적인 이 도구는 시각적인 캔들 표시와 내장된 지지/저항(S/R)선, 자동 SL/TP(손절매/이익실현) 레벨, 캔들 패턴 감지, 그리고 설정 가능한 알림 기능을 결합합니다. 이를 통해 한눈에 추세, 돌파, 그리고 반전을 파악하여 의사결정 능력을 향상시켜 줍니다. 주요 기능 다중 시간대 캔들: 최대 3가지 시간대(예: M15, H4, D1)를 표시하며, 명확한 레이어링을 위해 불투명도가 자동으로 혼합(100%, 50%, 20%)됩니다. 차트의 버튼을 통해 각각을 전환할 수 있습니다. M1부터 MN까지 21개 시간대를 지원하며, 색상, 너비, 채워진 몸통, 그리
MA Speedometer MT5
Davit Beridze
5 (3)
Non standard attitude to the standard moving average indicator. The essence of the indicator is to determine the strength and speed of the price direction by determining the tilt angle of the moving average. A point is taken on the fifteenth MA candle and a point on the last closed MA candle, a straight line is drawn between them, it is movable and on a hemisphere shows an angle of inclination from 90 degrees to -90. above 30 degrees is the buying area, below -30 degrees is the selling area. abo
Period Cross RSI
Davit Beridze
5 (6)
Check my p a id tools they   work  perfect! "Period Cross RSI" Is a New indicator idea that shows crosses of two RSI lines with different periods which creates ascending and descending zones for confirmation of long and short trading. This indicator is brend new and will be upgraded further, for now I recommend to use it as a confirmation, filter indicator for determination of long/short trading zones, not as a signaler indicator for now. Further upgrades can make it as a signaler indicator as w
FREE
Adjustable Pin Bar
Davit Beridze
4.67 (3)
Check my p a id tools they   work  perfect please r ate Adjustable PIN BAR indicator is usefull tool alowing to search for pin bars you wish to find on the price chart, it has 2 parameters to filter out what type of pin bars you wish to search for: 1) MinTailProc 75% (default) which means to show pin bars that has minimum size of the Nose (Tail) as 75% of full candle size. If Upper Nose (Tail) size of the candle is minimum 75% of the candle size fully than candle is painted in RED. If Lower Nose
FREE
Filtered TMA Arrows
Davit Beridze
3.8 (5)
Check my p a id tools they   work  perfect please r ate Here is an Upgraded version with Bonus Ea in case of purchase it costs 30$ only and you get Ea as Bonus:  https://www.mql5.com/en/market/product/96835 This indicator is experimetal, it shows TMA channel arrows with Volatility filter built in to avoid lagging. Try to experiment with it, search for better conditions of use. It is possible to adjust different timeframes for TMA and for Volatility filter Same time on the current chart, so it ma
FREE
Check my paid tools they work great and I share Ea's based on them for free please r ate The Dual Timeframe RSI (Relative Strength Index) indicator is a novel trading tool that allows traders to monitor RSI readings from two different timeframes on a single chart. This dual perspective enables traders to identify potential trend confirmations and divergences more effectively. For instance, a trader might use a 1-hour RSI alongside a daily RSI to ensure that short-term trades align with the broa
FREE
Indicator shows buy/sell arrows depending on volatility factor. Indicator does not repaint! It works on any pair and any timeframe. It is well tested through strategy builders and shows quite interesting results as a good filter indicator and as independent signaler as well (check the screenshots). It is possible to search for a lot of interesting parameters for profitable trading, some of which are shown on the screenshots. There are next inputs in indicator settings: N-volatility period; Level
Steady Ranger EA
Davit Beridze
3 (2)
Steady Ranger EA – 스마트하고 안전한 채널 트레이딩 백테스트: 제공된 set 파일(댓글 섹션)을 사용하여 "시가만" 모드에서 테스트하세요. 영상: 자막이 포함된 영상을 시청하여 EA의 작동 방식을 이해하세요. 왜 Steady Ranger EA인가? 단기적인 과도한 이익이 아닌 장기적인 안정성과 철저한 리스크 관리 에 중점을 둔 트레이딩 시스템입니다. 다중 스톱 보호: 개별 거래별 스톱로스와 "손실 합계 제한"을 함께 사용하여 손실을 관리. 채널 기반 거래 전략: 가격 채널의 극단적인 수준에서 거래하고 유효한 신호에서 종료. 적응형 로트 크기 조정: 과도한 리스크를 방지하기 위해 동적으로 로트 크기를 조절. 멀티 타임프레임 필터: 강한 단방향 시장 움직임 중 거래를 방지. 검증된 전략: 포워드 테스트를 통과한 장기적 안정성을 위한 설계. 작동 방식 EA는 가격 채널을 따라 움직이며, 주요 레벨에서 포지션을 개설하고, 신호, 스톱로스, 또는 리스크 관리 조건에 따라 종료합
RSI Entry Points
Davit Beridze
5 (5)
RSI Entry Points is the upgrade of the standard RSI indicator to avoid lagging. Indicator draws the clouds and the arrows to have clear picture where price is and what to wait for. Why standard RSI is lagging? because mostly we do not use it correctly and it is with very weak visual flexibility, less informative. With my current upgrade I tried to Fix both problems same time and I got much better results and more exact entries than standard RSI has. I Made RSI line Dynamic, it gets more flexible
This EA is Created just for RSI Entry points Indicator ( https://www.mql5.com/en/market/product/67581 Test, to show indicators profitable parameters and to give potential buyers possibility to backtest indicator Entries. EA opens Buy orders on Buy Arrows and Sell orders on Sell Arrows of the indicator, orders are closed on opposite signals. EA is not created for Live automated trading, thats not the goal to sell EA, but any ways if you like it and need it, you can rent. Default settings are fo
Re ad First Before Testing. This Ea goes as a Bonus to  MFI Modern PRO indicator users only. Set files generated  after upgrade you can check in comments section. This Expert advisor is based on MFI Modern PRO indicator   https://www.mql5.com/en/market/product/80765 just to  give possibility to indicator users for fastly test the indicator Before buying. In comments section recommended set files are uploaded by which you can prove yourself that backtest data from indicator overview are real. Thi
MA Revolution
Davit Beridze
5 (1)
MA Revolution is upgraded version of standard Moving   A verage. With the current upgrade moving average line got more sensitive with different market conditions. It gets more flexible by decreasing default period step by step while market is sharp and incrasing period back to default period step by step while market is normal again. testing of the ide a shows th at this upgr aded version gives much more acur acy for detecting m arket direction, ch anges in direction are shown much e arly th an
Laguerre Scrat
Davit Beridze
5 (1)
In case you get Laguerre S crat indicator, you will get Laguerre Scrat Ea as a Gift. To get Ea  and det a iled m anu al PDF contact me PM. Default settings are for usd/cad H4 For St able Long term Profits Laguerre Scrat is a trading system based on 4 indicator combinations in the shape of one indicator. Laguerre indicator (upgraded), CCI, Bollinger bands and market volatility factor. It generates arrows in the indicator window and nuts on the price chart, doubling arrows for a better view where
Fiter
Davit Beridze
5 (2)
인디케이터 구매자는 Fiter 인디케이터를 기반으로 한 EA를 보너스로 무료로 받을 수 있습니다. (EA가 작동하는 모습을 보려면 비디오를 시청하세요.) EA를 받으려면 댓글을 남겨주세요. Fiter 는 ATR로 조정된 RSI 라인(노란색)을 포함하는 지수 이동 평균(EMA)과 전통적인 이동 평균(빨간색)을 결합한 하이브리드 인디케이터입니다. 이 두 라인의 교차는 두 개의 단순 이동 평균을 사용하는 고전적인 접근 방식보다 훨씬 부드럽고 신뢰할 수 있는 거래 신호를 생성합니다. 백테스트는 이 방법의 효과를 입증했으며, 단순 이동 평균 교차와 비교하여 우수한 성능을 보여줍니다. 과거 데이터를 보면 Fiter는 다양한 시장 상황에 잘 적응하며, 실제 수동 거래에서 주요 트렌드를 식별하는 데 유용한 도구임을 알 수 있습니다. 차이를 경험하려면 스크린샷을 확인하거나 전략 테스터에서 인디케이터를 실행해보세요. 거래 신호에 대한 알림 기능도 포함되어 있습니다.
after getting indic ator cont act me for Bonus E a. Non Repaint TMA channel with special conditioned arrows on price cross of channel lines plus market Volatility factor, which makes product much more accurate than any usual tma channel indicators.  It is proven to be profitable with Ea built based on it which you will get as a BONUS in case of indicator purchase. Good luck.
MRA Index
Davit Beridze
5 (5)
MRA Index 지표 개요 보너스 혜택: 지표를 구매하면 "MRA Index EA"를 무료로 받을 수 있습니다. 최적화 전략: 스캘핑을 위해 지난 12개월 동안의 데이터를 기반으로 설정을 최적화하고 다음 1개월 동안 사용합니다. 이 방법은 매우 효과적인 것으로 입증되었습니다. 중요한 참고사항: 기본 설정은 시각화용일 뿐이며 수익성을 위해 최적화되지 않았습니다. 올바른 최적화 지침은 구매자에게만 제공됩니다. "MRA Index" 지표 소개: "MRA Index"는 트레이더가 잠재적인 시장 트렌드와 진입점을 식별하는 데 도움을 주는 다기능 외환 지표입니다. 이 지표는 특수 채널과 해당 채널 내에서 이동하는 동적 하이브리드 라인을 특징으로 하며, 이를 통해 매수 및 매도 신호를 생성합니다. 주요 특징: 동적 하이브리드 라인: 채널 내에서 이동하며 거래 신호 생성을 위한 기반이 됩니다. 매수 및 매도 화살표: 하이브리드 라인과 채널 간 특정 상호작용을 기반으로 생성되며, 잠재적인 시장 반
Ma Speedometer Dashboard
Davit Beridze
3.5 (2)
데모 버전은 사용할 필요가 없습니다. 깜빡이는 숫자를 보아도 아무것도 이해할 수 없습니다. 이것은 대시보드입니다. 개념을 이해하려고 노력하면 나머지는 제가 도와드리겠습니다. 심볼은 쉼표(,)로 구분하고 브로커가 표시하는 형식과 정확히 일치하게 입력해야 대시보드에서 인식됩니다. 이 심볼들은 인디케이터 분석에 사용됩니다. 한 번의 클릭으로 대시보드에서 바로 모든 통화쌍과 시간 프레임을 열 수 있습니다. MA Speedometer Dashboard 는 MetaTrader 4 (MT4)를 위한 매우 기능적인 인디케이터로, 동적 시장 분석을 통해 거래 전략을 강화하도록 설계되었습니다. 이 대시보드는 이동 평균선의 각도를 기반으로 시장 트렌드를 식별하고, 횡보 시장에서 거래하며, 횡보하는 시장 조건에서 빠져나가는 데 강력한 기능을 제공합니다. 특별 보너스로, 고객들은 MA Speedometer 대시보드의 기반이 되는 MA Speedometer 인디케이터의 특별 버전을 받을 수 있습니다.
MetaTrader 4 (MT4)용 캔들스틱 패턴 지표 이 맞춤형 지표는 주요 상승 및 하락 캔들스틱 패턴을 식별하여 트레이더가 기술 분석과 의사 결정을 내릴 수 있도록 돕습니다. 주요 기능: 패턴 감지 : 상승 : 망치형, 상승 장악형, 샛별형, 세 개의 흰 병사, 상승 하라미, 역망치형. 하락 : 유성형, 하락 장악형, 석별형, 세 개의 검은 까마귀, 하락 하라미, 교수형. 맞춤 설정 : 전략에 따라 특정 패턴을 활성화 또는 비활성화할 수 있습니다. 화살표로 패턴을 표시하며(상승은 파란색, 하락은 빨간색), 크기와 간격을 조정할 수 있습니다. 이동 평균선(MA) 통합 : 선택적으로 이동 평균선을 차트에 표시할 수 있으며, 기간, 방법, 시간 프레임을 맞춤 설정할 수 있습니다. 알림 시스템 : 감지된 패턴에 대해 화면 메시지, 소리, 푸시 알림, 이메일 알림을 제공합니다. 다중 패턴 감지: 수렴 : 하나의 캔들에 여러 패턴을 표시하여 더 강한 신호를 제공합니다. 상승 수렴 : 여러
Chart Patterns All in One
Davit Beridze
4.47 (19)
"Chart Patterns All in One"을 데모 모드에서 사용해보고 보너스를 받아보세요. 데모 모드에서 사용해본 후 메시지를 보내주시면 보너스를 드립니다. 구매 후 댓글을 남기시면 고품질의 인디케이터 8개를 보너스로 받으실 수 있습니다. Chart Patterns All-in-One 지표는 트레이더가 기술 분석에서 흔히 사용되는 다양한 차트 패턴을 시각화하는 데 도움을 줍니다. 이 지표는 잠재적인 시장 움직임을 식별하는 데 도움이 되지만, 수익성을 보장하지는 않습니다. 구매 전에 데모 모드에서 지표를 테스트하는 것이 좋습니다. 현재 할인 : "Chart Patterns All in One" 지표 50% 할인 중. 포함된 패턴 : 1-2-3 패턴 : 세 가지 주요 지점(고점 또는 저점)을 사용하여 시장 반전을 감지합니다. 매수 : 연속된 두 저점 이후, 이전 고점보다 낮은 고점이 발생할 때. 매도 : 연속된 두 고점 이후, 이전 저점보다 높은 저점이 발생할 때. 시각화 :
"Candle Info" 지표는 MetaTrader 4 (MT4)에서 트레이더가 중요한 캔들 패턴을 직접 차트에 분석하고 시각화할 수 있도록 도와줍니다. 높은 고점(HH), 낮은 저점(LL), 높은 저점(HL), 낮은 고점(LH)과 같은 패턴을 감지하여 시장 동향과 잠재적 가격 움직임에 대한 통찰을 제공합니다.     주요 기능: - 캔들 패턴: HH, LL, HL, LH를 감지하고 표시하며, HH & HL (상승 추세) 및 LL & LH (하락 추세)와 같은 조합도 식별합니다. - 세션 필터: 주요 거래 세션(도쿄, 런던, 뉴욕, 시드니)에 따라 패턴을 필터링하여 중요한 시장 시간을 집중적으로 분석할 수 있습니다. - 알림: 새로운 패턴이 발생하면 화면 알림, 푸시 알림, 이메일 알림, 소리 알림을 설정할 수 있습니다. - 맞춤 설정: 텍스트 색상과 크기를 조정하고, 표시할 세션이나 패턴을 선택할 수 있습니다. "Candle Info" 지표는 추세 트레이더와 세션 기반 전략
필터:
akira1212
199
akira1212 2025.08.17 22:23 
 

I have purchased it. How do I claim my EA?

Davit Beridze
11223
개발자의 답변 Davit Beridze 2025.08.18 08:51
hello will send you mail. thanks
Yusuf Hamzah
871
Yusuf Hamzah 2024.02.18 15:44 
 

The indicator is MFI-complete and it allows user to perform back-testing and optimization. I have been reviewing it for nearly two weeks. It is feature-wise, provide value-for-money and I have nothing to regret purchasing it. Davit provides a good after-sales support and very generous in giving explanations. He is quick to response and adept to questions. As a caveat, past performance does not guarantee future performance. Although, I do believe the indicator is promising, I still strongly suggest user to do its own homework to fully utilize it (like any other indicators, it is just an indicator). Good luck.

Davit Beridze
11223
개발자의 답변 Davit Beridze 2024.02.18 15:48
thanks for review
rainwalker123
3424
rainwalker123 2023.08.22 13:18 
 

DEAR DAVID, you are the best and talented here in MQL5. Your indicator ist the only one, who provides reliable and profitable signals. You are real JEWEL for the trader community here. RIGHT ON, you are the best.

Davit Beridze
11223
개발자의 답변 Davit Beridze 2023.08.23 09:54
thanks for such words. :)
X_RaXaR
379
X_RaXaR 2023.07.19 22:01 
 

This indicator really gives very accurate signals. The author almost instantly replies to messages and gives detailed explanations. In general, both the product and technical support are excellent. Well, the bonuses are so generous that you will be pleasantly surprised.

Davit Beridze
11223
개발자의 답변 Davit Beridze 2023.08.23 09:54
thanks. good luck
VALERІI SKVORTSOV
165
VALERІI SKVORTSOV 2023.06.07 20:45 
 

Знайшов те, що шукав. Приємно здивував бонус у вигляді додаткових індикаторів та робот на цьому ж індикаторі, це суттєво полегшує процес створення стратегії та саму торгівлю. Продавець завжди на зв'язку та охоче відповідає на всі запитання. Д Я К У Ю !

Davit Beridze
11223
개발자의 답변 Davit Beridze 2023.07.12 17:28
you are welcome
Epsilon Hogas
1732
Epsilon Hogas 2023.04.08 05:47 
 

Interesting information shown, thank you

Davit Beridze
11223
개발자의 답변 Davit Beridze 2023.07.12 17:28
thanks
adonis4ex
6350
adonis4ex 2023.02.21 11:38 
 

great indicator, always knew the mfi was the goat. may i get ea please

Davit Beridze
11223
개발자의 답변 Davit Beridze 2023.03.03 08:45
Hi check PM
jimdog
820
jimdog 2023.02.19 11:13 
 

Thanks, looks good

Davit Beridze
11223
개발자의 답변 Davit Beridze 2023.07.12 17:28
thanks
Yoon Jinho
381
Yoon Jinho 2022.12.31 11:12 
 

Great indicator and perfect support

Davit Beridze
11223
개발자의 답변 Davit Beridze 2023.07.12 17:29
thank you
Bernardo Carvalho
693
Bernardo Carvalho 2022.12.29 11:02 
 

Good

Davit Beridze
11223
개발자의 답변 Davit Beridze 2023.07.12 17:29
thanks
Richard S.
334
Richard S. 2022.12.14 21:22 
 

Great Indicator, Thank you Davit

Davit Beridze
11223
개발자의 답변 Davit Beridze 2023.07.12 17:30
you are welcome
tsany
515
tsany 2022.12.14 17:08 
 

Thank you, Davit for this very useful trading tool!

HKjobs Mt4
164
HKjobs Mt4 2022.12.10 18:17 
 

사용자가 평가에 대한 코멘트를 남기지 않았습니다

Lasse Michael Holm
1604
Lasse Michael Holm 2022.11.08 23:52 
 

사용자가 평가에 대한 코멘트를 남기지 않았습니다

Davit Beridze
11223
개발자의 답변 Davit Beridze 2023.07.12 17:30
thanks
Ck.
1046
Ck. 2022.11.07 13:20 
 

Great indicator. EA works as intended and allows hands off trading. Great support as well.

Erwinlyj
71
Erwinlyj 2022.11.06 11:19 
 

사용자가 평가에 대한 코멘트를 남기지 않았습니다

Dam Van Long
698
Dam Van Long 2022.11.05 05:51 
 

Super good indicator and EA. I use it for my $20k account.

Dariusz Dabrowski
188
Dariusz Dabrowski 2022.11.03 17:29 
 

사용자가 평가에 대한 코멘트를 남기지 않았습니다

Prianka Bayu Putra
663
Prianka Bayu Putra 2022.11.03 15:52 
 

I tested this indicator multiple times now and decided to buy it, great tools ! Looking forward to work with it

d1n3kk
66
d1n3kk 2022.10.30 22:45 
 

After ~1 month I can confirm, that indicator (as well as gift EA) works as it should and there are no repaints or any other scams. Performance is good, risk/reward ratio also. Currently I'm ~5% on plus (0.01 lot on 2000$ account). It covers with backtest effects.

123
리뷰 답변