MTF Moving Averages
- 지표
-
Guillermo Pineda
 저는 MQL4 및 MQL5 개발자로서, 강력하고 맞춤형 트레이딩 전문가 자문(EA), 지표 및 스크립트 개발에 중점을 두고 있습니다.
저는 금융 전략 최적화를 위해 양적 트레이딩 및 머신러닝 애플리케이션 분야로 적극적으로 사업을 확장하고 있습니다.
기획 중인 프로젝트나 논의할 아이디어가 있으시면 언제든지 연락 주세요! - 버전: 1.1
- 활성화: 10
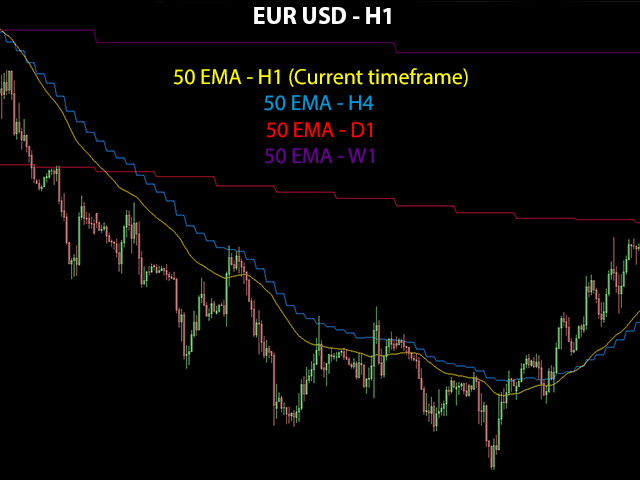
MTF Moving Averages is an useful indicator that brings you data from fully customizable higher timeframe Moving Averages on your charts, you can add multiple Moving Averages to use even more data of current market conditions.
Check the indicator in action [Images below]
What MTF Moving Averages does apart from showing higher timeframe MA's?
- Time saver, having all your higher timeframe MA's in just one chart, time is key, avoid switching between timeframes.
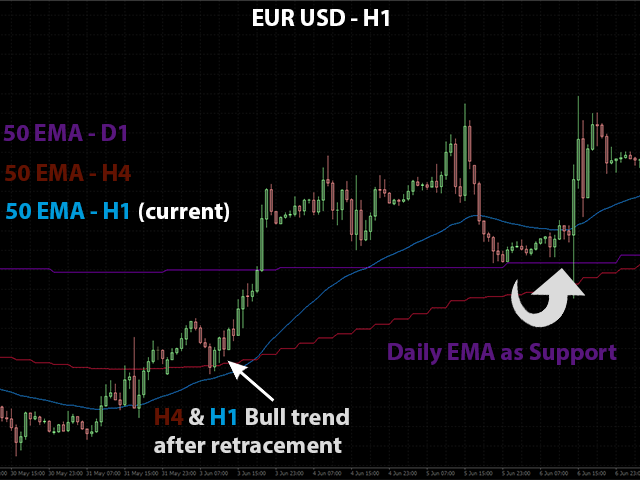
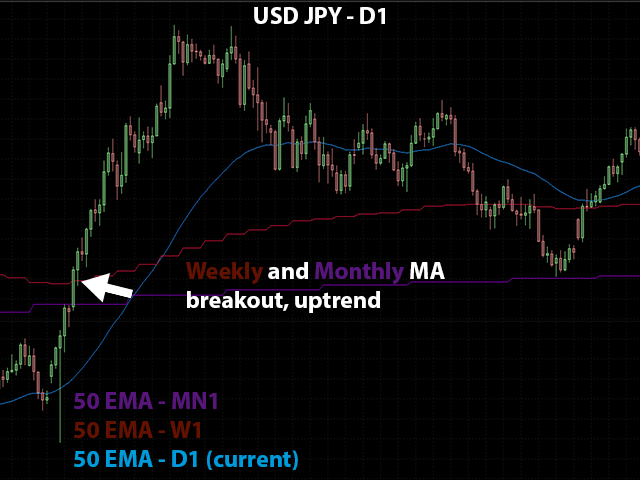
- Enter Trends precisely, easy to follow up, and exiting them.
- Excecute with presicion breakouts, retracements, and consolidation.
- Confirm Supports and Resistances.
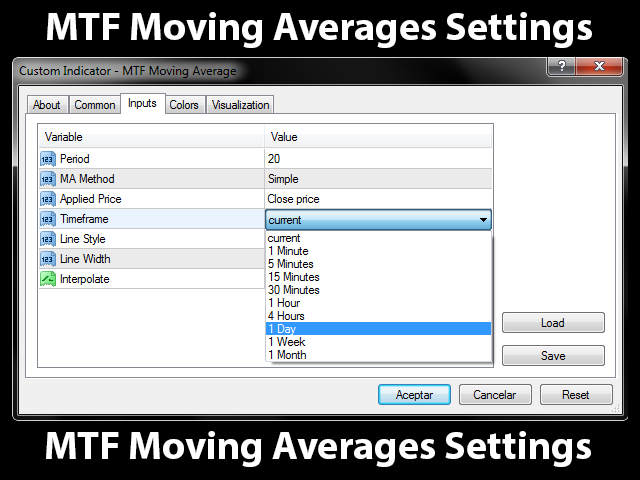
Easy to customize your MTF Moving Averages!
- Period - Moving Average value.
- MA Method - Type of Moving Average.
- Applied Price - Price the Moving Average will calculate.
- Timeframe - Timeframe of the Moving Average.
- Line Style - Type of line to display.
- Line Width - Width of line to display.
- Interpolate - Transform and smooths accumulated history data of higher timeframe MA's, making it less ''choppy''.
NOTES:
- Setting a Moving Average to a lower timeframe won't show unless you are in the same or lower timeframe.
- Interpolation funtion will change past values, also known as repaint.
- All screenshots are examples of the indicators, you are free to copy it or modify it to any way that suites you better.

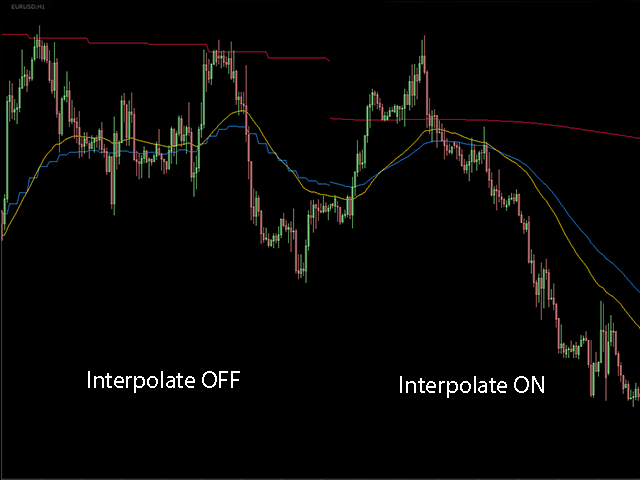


To be fair the interpolate option isn't really accurate, it's just a moving average with periods converted to what it must be from current, for example if you want a H4 timeframe 14-period simple moving average interpolate on M15 chart, it's actually just a 244 period M15. But without interpolate it's perfect, exactly what I was looking for, thanks!