당사 팬 페이지에 가입하십시오
- 조회수:
- 32584
- 평가:
- 게시됨:
- 업데이트됨:
-
이 코드를 기반으로 한 로봇이나 지표가 필요하신가요? 프리랜스로 주문하세요 프리랜스로 이동
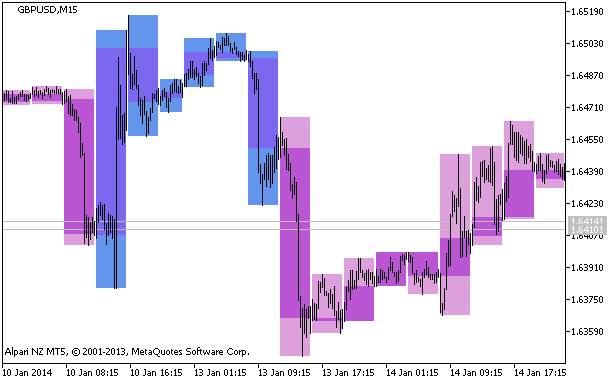
The indicator draws candlesticks of a larger timeframe as color filled rectangles using DRAW_FILLING buffers. Rectangles are color filled in accordance with the values of the VolatilityPivot indicator.
Depending on trend direction the candlestick body is painted in violet-blue or violet-lilac, shadows are painted in light blue or plum color.
The indicator requires the compiled indicator file VolatilityPivot.mq5 for operation. Place it to terminal_data_folder\MQL5\Indicators\.

Figure 1. The BackgroundCandle_VolatilityPivot_HTF indicator
MetaQuotes Ltd에서 러시아어로 번역함.
원본 코드: https://www.mql5.com/ru/code/2280
 WeightedWCCI
The indicator draws the slow and fast ССI and colors bars for determining patterns and trends.
 VolatilityPivot_HTF
The VolatilityPivot indicator with the timeframe selection option available in input parameters.
 VolatilityPivot_Signal
The VolatilityPivot_Signal indicator shows information on the current trend using the values of the VolatilityPivot indicator with a fixed timeframe.
 X4Period_MFI_Arrows
Four semaphore signal indicators based on MFI oscillators with different periods on one price chart.