당사 팬 페이지에 가입하십시오
- 조회수:
- 6235
- 평가:
- 게시됨:
- 업데이트됨:
-
이 코드를 기반으로 한 로봇이나 지표가 필요하신가요? 프리랜스로 주문하세요 프리랜스로 이동
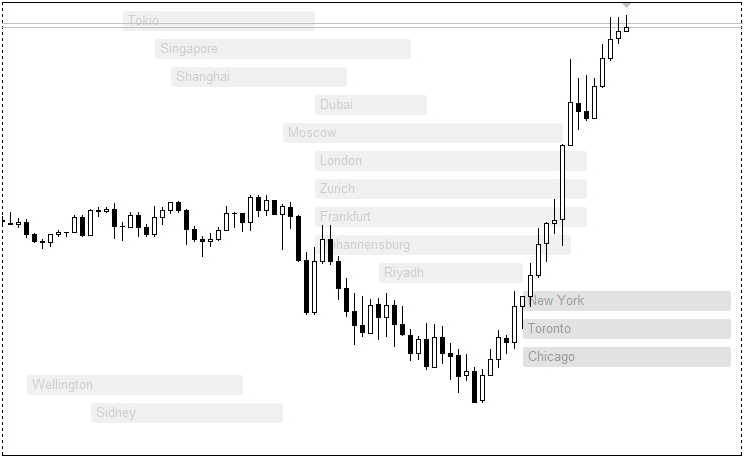
StocksBG indicator displays the activity of major stock exchanges on a chart with M15 or less timeframe.
OBJ_LABEL graphical object is used for labels, and OBJ_EDIT is used for rectangles.
OBJ_EDIT object is used to make the indicator visible in Strategy Tester. The main terminal window height should be no less than 300.
The indicator is implemented using classes. Every class is stored in a separate file with the same name. You need to place all files in one folder.
Short description of classes:
- CGraphBase — class for creating and setting properties of graphical objects.
- CGLabel — class for working with OBJ_LABEL objects.
- CGCanvas — class for working with OBJ_EDIT objects (creating the rectangle canvas).
- CStockStyles — class for setting object sizes and color schemes.
- CGStocksAsBG — class for creating objects determining stock exchanges.
- CGOStocksBG — class for creating objects for 15 major stock exchanges.
- CGOStocksContainer — container class for CGOStocksBG.
- StocksBG — the indicator itself (you need to compile this file).
Input parameters:
input int ipt_top=0;                                                       // Top indent
input int ipt_down=20;                                                     // Bottom indent
input int ipt_scheme=0;                                                    // Color scheme
input int ipt_total=4;                                                     // Number of days to show

MetaQuotes Ltd에서 러시아어로 번역함.
원본 코드: https://www.mql5.com/ru/code/12905
 Currency Correlation II
The indicator shows correlation between currencies.
 Statistical Functions
Set of statistical functions which allows you to calculate some values describing timeseries.
 MultiCandleTrend_x10
The MultiCandleTrend_x10 indicator displays information on current trends using candlestick direction from ten different timeframes.
 MFITrend_x10
The MFITrend_x10 indicator shows the MFI oscillator position from ten different timeframes.