당사 팬 페이지에 가입하십시오
- 조회수:
- 4014
- 평가:
- 게시됨:
- 업데이트됨:
-
이 코드를 기반으로 한 로봇이나 지표가 필요하신가요? 프리랜스로 주문하세요 프리랜스로 이동
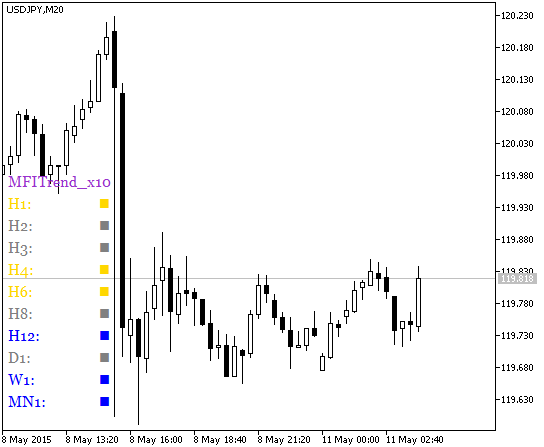
The MFITrend_x10 indicator shows the MFI oscillator position from ten different timeframes.
If the oscillator is positioned lower than the oversold level, the color squares are painted in gold, if it's higher than the overbought level, the color squares are painted in blue. Otherwise, the squares are gray. The indicator uses the values of the last closed bars.

Fig.1. The MFITrend_x10 indicator
MetaQuotes Ltd에서 러시아어로 번역함.
원본 코드: https://www.mql5.com/ru/code/12992
 MultiCandleTrend_x10
The MultiCandleTrend_x10 indicator displays information on current trends using candlestick direction from ten different timeframes.
 StocksBG
StocksBG indicator displays the activity of major stock exchanges on a chart with M15 or less timeframe.
 MultiMFITrend_x10
The MultiMFITrend_x10 indicator shows information on current trends using the MFI oscillator position from ten different timeframes.
 MultiStochasticTrend_x10
The MultiStochasticTrend_x10 indicator shows information on current trends using the Stochastic oscillator position from ten different timeframes.