USD Surfer MT5
- インディケータ
-
Kazuya Yamaoka
 FXトレーダー&FXライバー💹具体的な手順まで全てを配信📹ドル円中心🇺🇸🇯🇵定石に基づく9つのMetaTraderオリジナルインジケーターで収益化📈日々の収支も公開📊
 - バージョン: 1.1
- アップデート済み: 25 6月 2023
- アクティベーション: 5
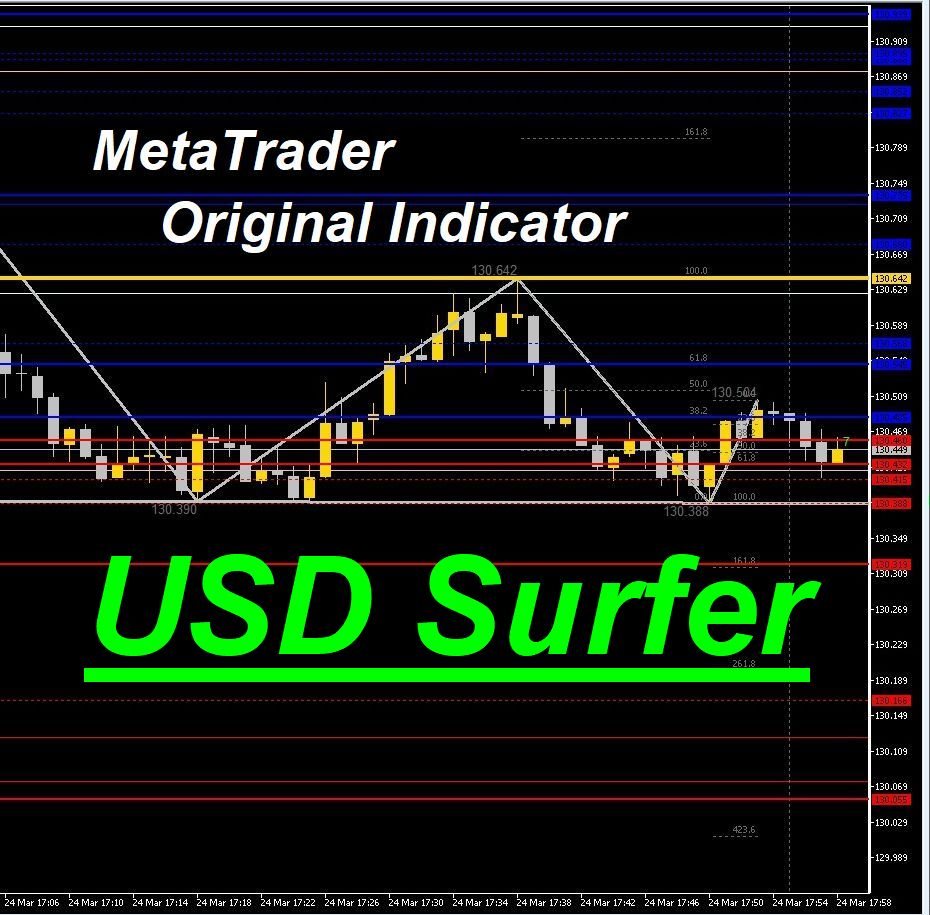
Based on data from the Bank for International Settlements, 78.8% of the world's major 8 currency pairs can be checked instantly.
It tells you whether the U.S. dollar is being bought or sold in a matter of seconds.
So, even in the fast-moving phase after the release of economic indicators, you can see the flow and pushes of the U.S. dollar,
We are live-streaming the actual operation of the system.
Please check for yourself if it is usable.
Please check it out for yourself.
https://www.youtube.com/@ganesha_forex
We do not guarantee your investment results. Investments should be made at your own risk.
We sharll not be liable for any disadvantage or damage caused by the use of the information provided.