AutoScroll MT5
- インディケータ
-
Kazuya Yamaoka
 FXトレーダー&FXライバー💹具体的な手順まで全てを配信📹ドル円中心🇺🇸🇯🇵定石に基づく9つのMetaTraderオリジナルインジケーターで収益化📈日々の収支も公開📊
 - バージョン: 1.0
- アクティベーション: 5
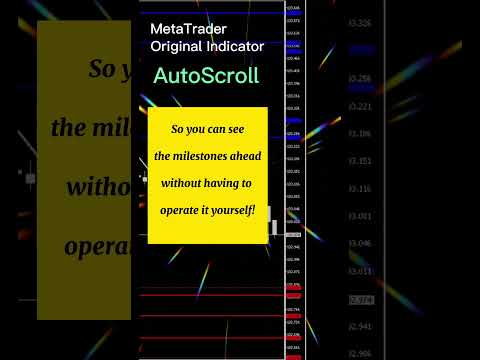
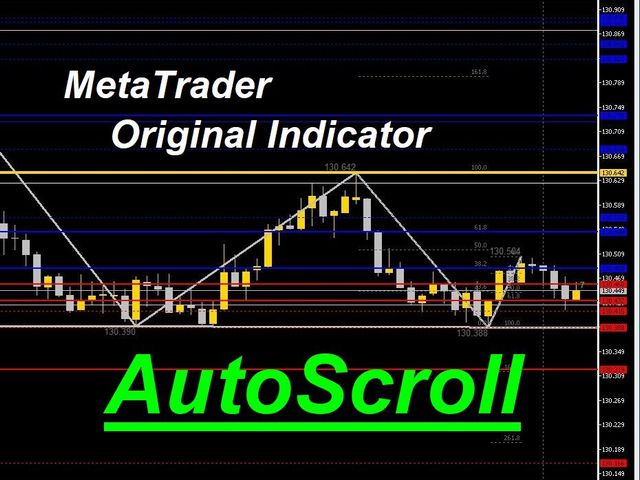
AutoScroll automatically scrolls the chart by the set width (pips).
You can see the next milestone without having to operate the chart yourself.
You can concentrate on trading.
We are live-streaming the actual operation of the system.
Please check for yourself if it is usable.
Please check it out for yourself.
https://www.youtube.com/@ganesha_forex
We do not guarantee your investment results. Investments should be made at your own risk.
We sharll not be liable for any disadvantage or damage caused by the use of the information provided.