Support and Resistance Detect Signal Elite
- インディケータ
- バージョン: 1.0
- アクティベーション: 5
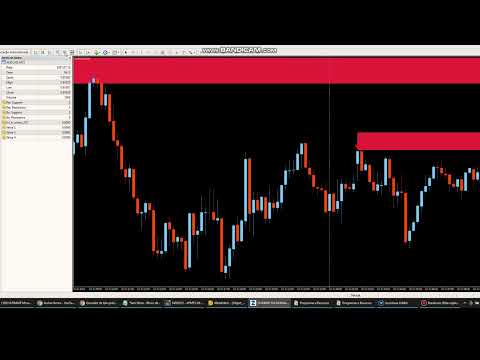
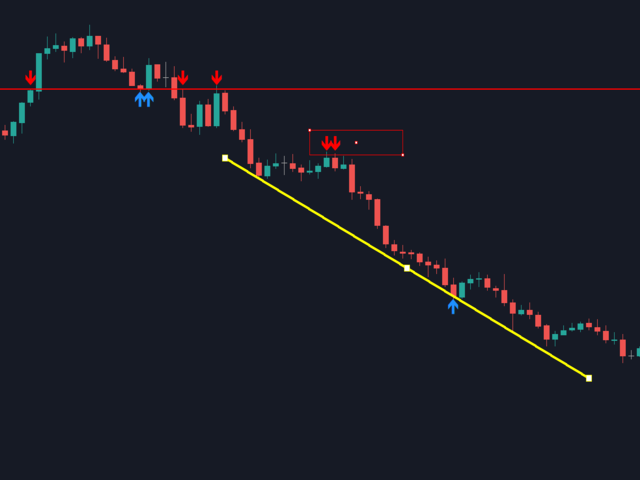
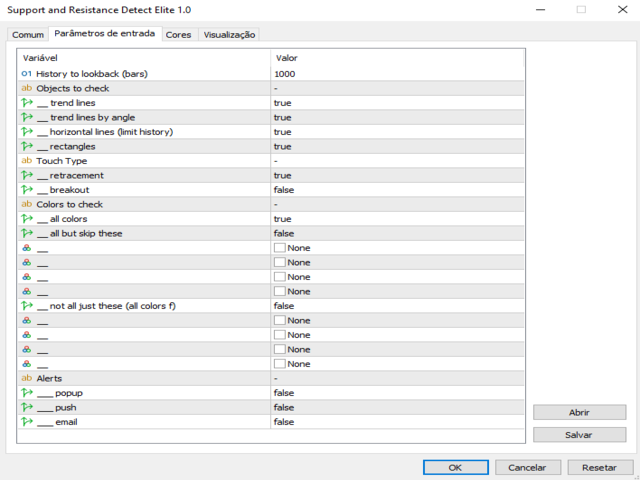
The indicator, Support and Resistance Detect Signal automatically detects support and resistance levels and trend lines, emitting a signal whenever the condition is met, as configured.
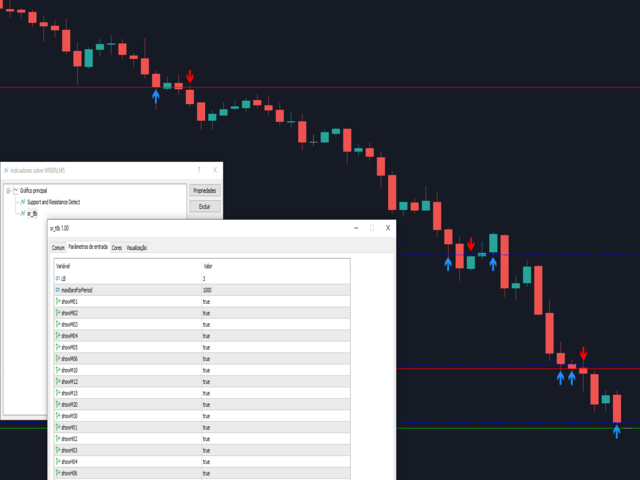
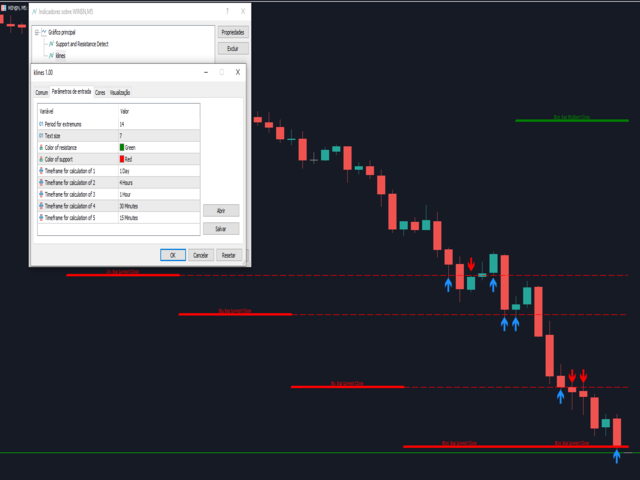
It reads support and resistance drawn manually or automatically built into the chart by other external indicators.
Note: Support and Resistance Detect Signal is compatible with almost all external indicators that draw on the chart, support and resistance levels, in addition to trend lines.
Discover our Elite version, which allows you to choose the colors of the objects you want to detect.
Great for automating your setup with the EA.