Channel Scanner

5

** All Symbols x All Timeframes scan just by pressing scanner button **

*** Contact me to send you instruction and add you in "Channel Scanner group" for sharing or seeing experiences with other users.

Introduction:

The Channel pattern is described as the area located between two trend lines. This area is used for a measure of a trading range. In this case, the upper trend line connects price highs while the lower trend line connects price lows. Also when it comes to breakout points, it helps to indicate bullish or bearish signals.

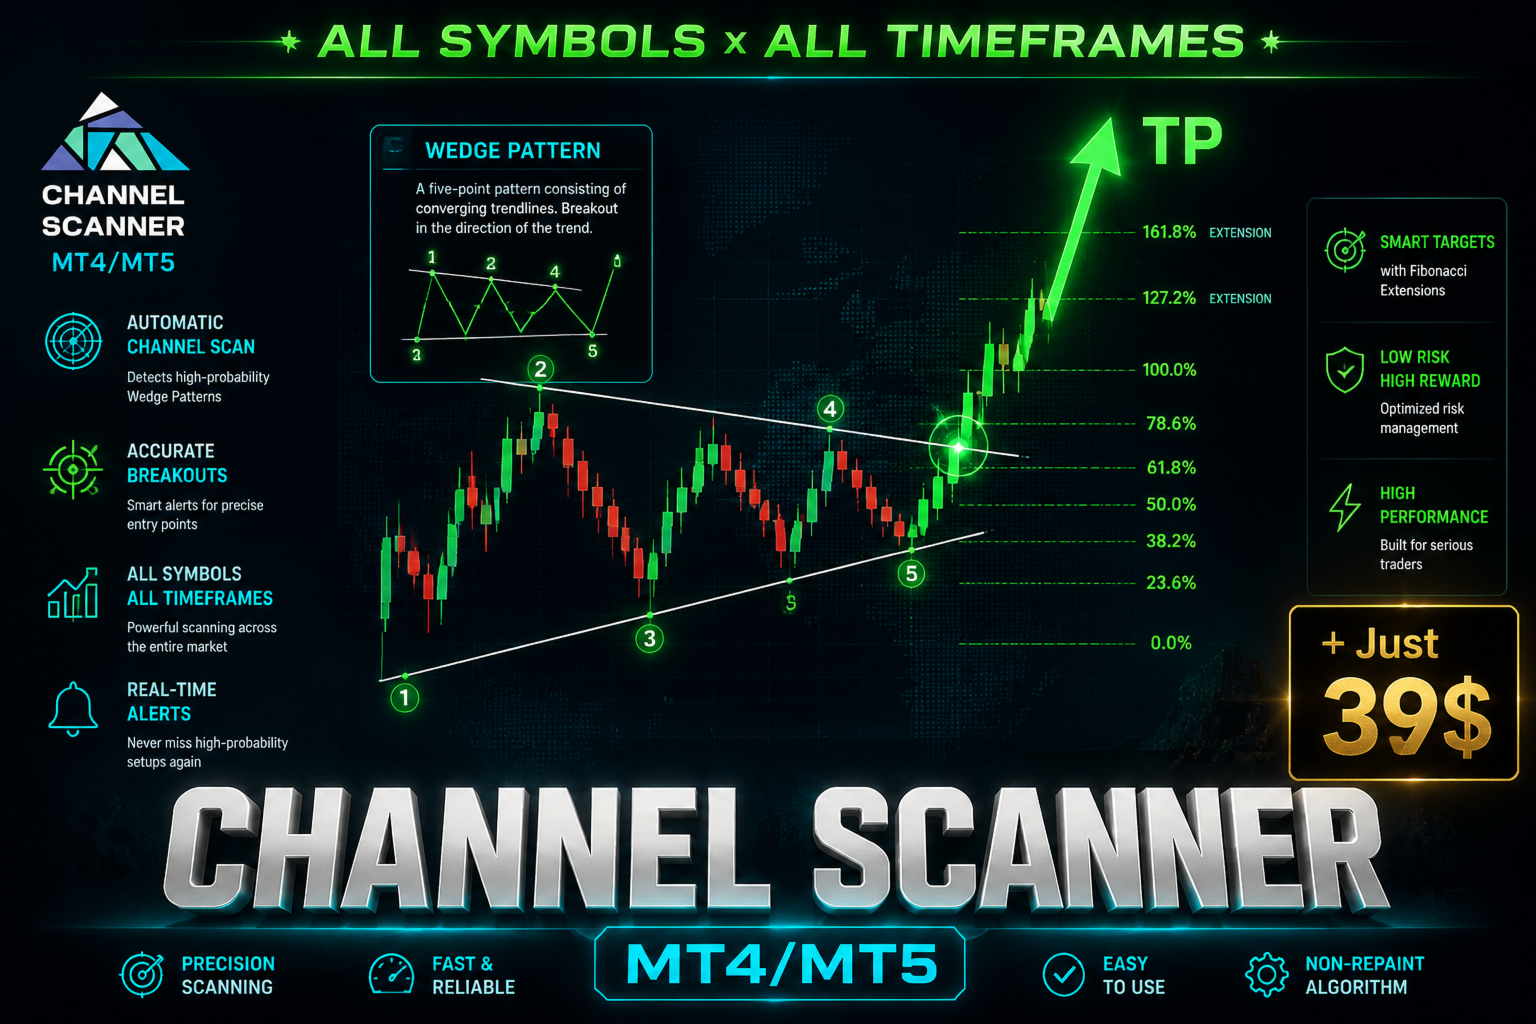
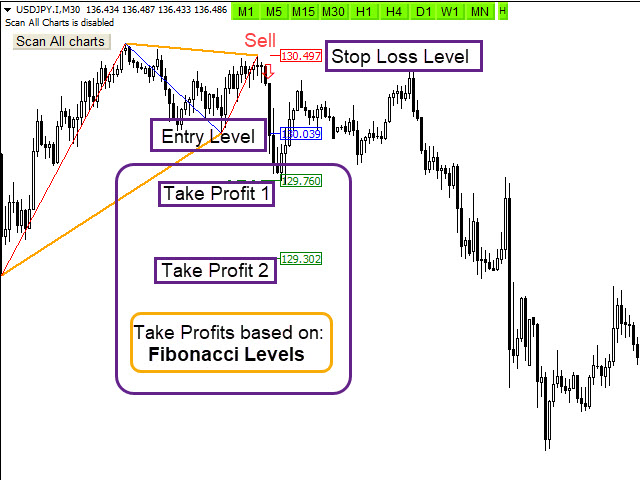
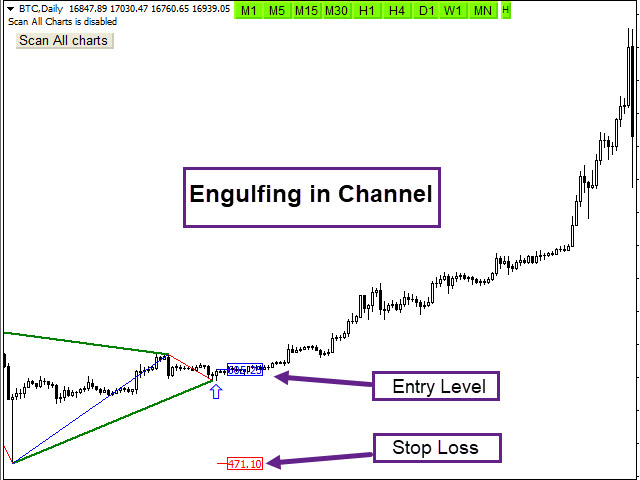
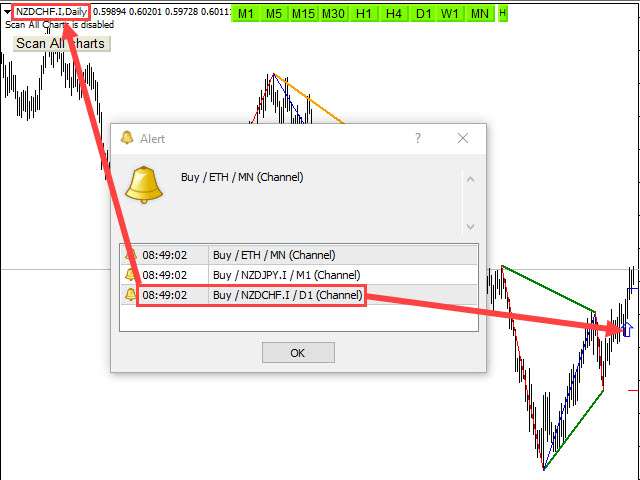
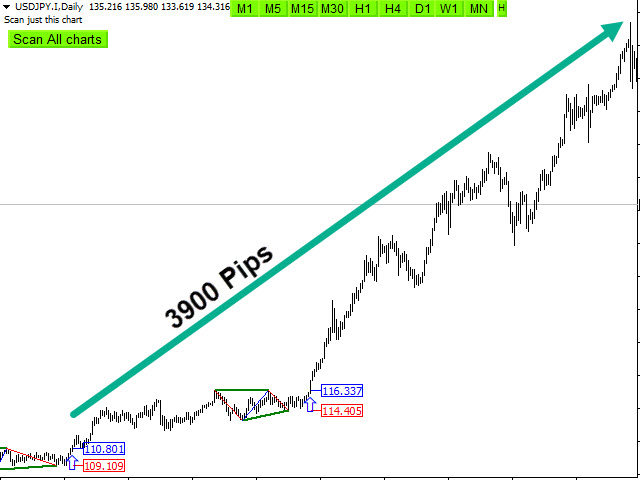
The Channel Scanner indicator Scans All charts just by pressing one click. It has stop loss, Take profits and entry point levels with using Fibonacci levels and candlestick checking to find the best entry point and exit of trading. It finds signals immediately with alarm and notification for easy trading.

Also the Channel Scanner indicator scans a wedge pattern that it can signal bullish or bearish price reversals.

Main Features:

  • Detect the best and  most successful point of trend or reversal trend : Rectangle Channel, Triangle Pattern
  • Easy-to-use and user-friendly indicator
  • NO repaint
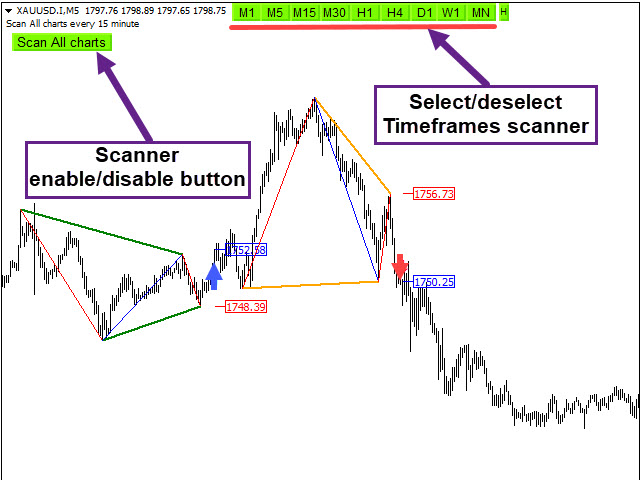
  • Scan All charts button ( Forex, Crypto, Indices and commodities )
  • Select and deselect time frames button for scan (M1,M5,M15,M30,H1,H4,D1,W1,MN)
  • It displays and pushes notification stop-loss, take profits and entry-point levels
  • Candlestick check for the best entry point
  • Use Fibonacci levels
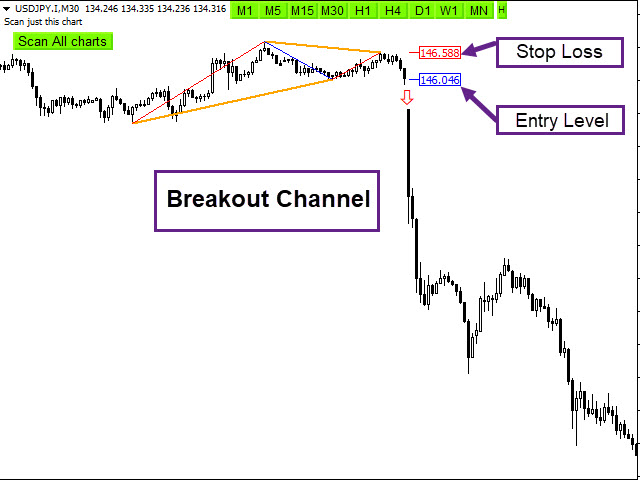
  • Method Engulfing/breakout -  Engulfing on the edge of channel / Breakout of channel
  • Sending the alert and push notification
  • Alert enable/disable base on your setting time
  • Adjust the pattern setting

Input Parameters :

=========Scanner============

  • Scan All Charts – Enable
  • Scan the number of candles – Amount of history bars to evaluate
  • Re-scan Timer – Re-scan all charts in all time frames after passing time
  • Mode = Engulfing/breakout -  Engulfing on the edge of channel / Breakout of channel

=======Display/style Options============

  • Display Options – Display or do not  SL & TP & Entry levels
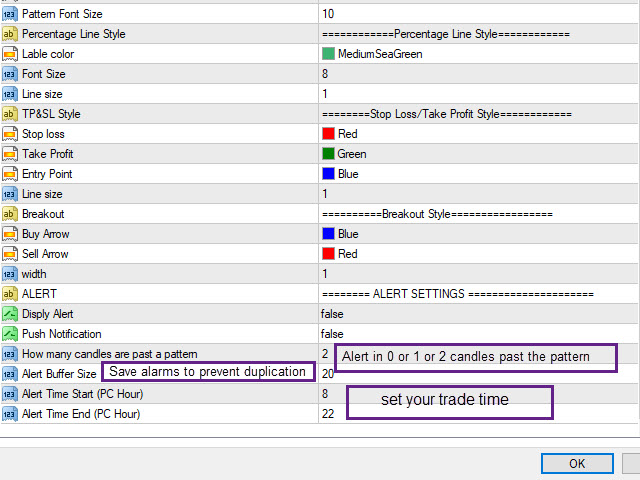
  • Stop Loss levels and Breakout Style - Set the Fonts and colors of patterns

    ========ALERT SETTINGS ==========

    • Display Alert or Push Notification – Enable or disable Alert or Push Notification
    • How many candles are past a pattern – Maximum Number of candles Passed from a pattern to allow alert
    • Alert Buffer Size – Maximum save alert to prevent duplicate alerts
    • Alert start/end time  – Determine trading hours based on the computer clock to activate and deactivate the alarm


    レビュー 9
    ivaylo slavkov
    177
    ivaylo slavkov 2025.03.18 15:40 
     

    Great indicator, Highly recommend

    Lieven Luc O Vandecasteele
    350
    Lieven Luc O Vandecasteele 2025.02.25 09:59 
     

    Excellent indicator to setup my trading plan. Recommend!

    iamhzn
    145
    iamhzn 2023.04.02 22:53 
     

    非常棒的指标!感谢制作者

    おすすめのプロダクト
    Just Currency Strength is a simple, and easy to use as a market analysis tool. It could helps trader to understand the broder view of the market and forcasting the movemt of each currency symbol and trend direction of each specific currency pair. Parameters Timeframe (Move Timeframe box to move the pannel) Currency (Must NOT be less than 5 currencies) Refreshtime in second Colors Strong//Weak//Neutrial Alerts setting Alert On/Off Push notification On/Off Happy Trading...
    FREE
    The indicator shows the real waves, based on alternating upper and lower extremums of the price chart, thus displaying the wave structure of the market. When using this indicator, there is no need to manually apply the wave markup for the current timeframe. Relevance of the extremums is determined in the process of their calculation, invalid extremums are not taken into account. Upper extremums are calculated by the bars highs, while lower ones are calculated by the bars lows. Only one bar is co
    The SPV Corr indicator displays the average percentage correlation between the bar's body and its shadows. A very effective system for building various filters and market entry confirmations. It fixes cyclicality and can be used in trading in different ways. You can see the ups and downs of the indicator alternate and have such a relationship with the market, which can be used to draw conclusions to predict price behavior. Also, indicators can be combined with each other. The value of the indica
    TeconLab Indicator User Guide Overview The TeconLab Indicator is a tool for MetaTrader 4 (MT4) users, fine-tuned to gather price information, including Date, Time, Open, High, Low, Close, and Volume, and update this data in real-time. Uniquely, this indicator autonomously refreshes the CSV file every minute or less, meaning there's no need for manual restarts—just activate it once, and it will continuously collect data as long as MT4 is running. It maintains the latest data according to the size
    The Ultimate Dashboard New Year Sale - save $20 (normal price $79) Indicators are useful for traders, but when you put them into a dashboard that can scan 28 symbols at once they become even better, and when you can also combine different indicators and timeframes to give you synchronized alerts, then they become awesome. This easy to use dashboard provides you with 23 leading indicators, use them individually or together, to create powerful combination alerts. So when you want to know that RS
    Quantum Swing 1. What is Quantum Swing The indicator calculates and displays future price levels based on quantum mathematics with high accuracy of probability and direction. Levels are displayed in the form of zones for making trading decisions; they clearly define a narrow price range for placing orders with a minimum stop-loss and maximum take-profit. The indicator displays future trading zones on different timeframes H1, H4, D, W. Quantum oscillations are also displayed without reference to
    FREE
    The indicator will provide a breakout line or price stop guide, we recommend M5 or H1 timeframes. Trade signal: Buy Signal:  if the closed price (according to the timeframe) breaks the blue line and is already   above it or if the lowest price stops above the red line. Sell Signal : if the closing price (according to  the timeframe) breaks the red line and is already below it or if the highest price stops below the blue line. Feature: You will get time (hours) and price values ​​for the lines
    !! FLASH SALE !!   Over 80% off !!     For ONE week only. Now only $47 - normally $297! >>>      Ends on 30 June 2023 - Don't miss it! Buy And Sell Signal Arrows On The Chart When The Price Is About To Reverse. Also Sends Alerts – On MT4 To Your Phone To Your Email. Does not repaint. Works on any pair, any timeframe.   (Just ajust the settings for your pair and timeframe.) 10 Activations allowed so you are free from limitations MT5 version here .   Spreads from 0.1pip RAW/ECN Accounts,  
    About Holy Trend was developed to identify trend and strength. VIDEO (information and tips) [HERE] Features Identifies trend Identifies strength of trend Identifies lines of support and resistance Easy to analyze Fast signals All timeframes Not repaint (when candle close) No settings required Can be used in Renko charts Can be used with indicator Holy Renko PRO Alerts, email and push notifications Advantages Sensitive identifier of trend able to identify the long, short movements and correc
    This indicator shows the high volume zone. From the last minutes that you set yourself, the image of the volume zone is generated on an ongoing basis. The indicator also shows the V-Poc, Average Volumen and V-WAP lines. if you are using high intervals you must enter a large number of minutes. the zone builds itself up as the chart moves. if you want to build a zone from:  last day - 1440 minutes,    last week - 10080 minutes, ... etc. If you need an indicator that shows the constant volume zone
    XABCD (Harmonic Pattern) Ratio Labeler – Simple, Visual Pattern Validation Tool This tool was designed for traders who work with harmonic or XABCD patterns and want a fast, flexible way to manually validate them on their chart. How It Works: Click a button to place 5 editable labels (X, A, B, C, D) directly on your chart. Drag them to your desired swing points. The tool automatically draws the connecting legs (XA, AB, BC, CD, etc.) and calculates key Fibonacci ratios: AB / XA BC / AB AD / XA
    FOREX FLIP ALERT   - Show where the price will reverse with more than 95% probability. This information will help every trader to effectively open trades. The indicator on the chart draws arrows in which place and in which direction the price will reverse. The indicator   does not redraw  its arrows and shows price reversals for medium and long distances. This means that after the arrow appears, the price will go in the indicated direction for many points. Benefits of the indicator: Gives sign
    Horizontal volume bars, Cluster analysis, Volume profile Volume in Range gets information about the accumulated volume in a specified vertical range and period in bars. The received data is then plotted on the chart as rectangular boxes with the volume quantity inside. Usage:- The tool acts as a support resistance levels but most importantly it should be used to check in which direction the price breaks out of the significant levels formed by this indicator and then actions to be taken on correc
    みなさん、こんにちは。 私は 10 年以上取引しており、私の意見では市場プロファイルは頭痛のない長期取引を成功させる方法です。これは、大規模な金融機関が長期的に取引する方法によりよく似たシステムです。私は S & P 、 NASDAQ 、 DAX などのインデックスの累積ポジションを構築するために幅広く使用しています。しかし、 FOREX メジャーやコモディティにも非常に適しています。 マーケットプロファイルは、シカゴのピーターシュタイドルマイヤーによって最初に提示されました。彼はボリュームがガウス曲線を形成する特定の価格レベルの周りに分布していることに気づきました。ガウス曲線は、数学者ガウスによって誤差の分布を研究するために導入されたものであり、今日では、天気予報などの多くの現実の現象を予測するために最も広く使用されている確率モデルです。このトピックについてさらに詳しく知りたい場合は、「 Mind Over the Market 」という本の PDF と、市場のプロファイルについて詳しく説明した他の本をお送りします。インディケータを購入した場合、マーケットプロファイルのみの非常に優れ
    Description of work The MA7 Galega indicator is based on the standard Moving Average indicator. Shows a puncture of the moving average. Detailed information about the MA7 Galega indicator. Indicator settings General settings: Period ; Method ; Apply to ; Consider the direction of the candle . Message settings: Send message to the terminal (Alert) – permission to send messages to the terminal using the Alert function; Send message to the mobile terminal (Push) – permission to send messages to t
    Overview Comprehensive technical analysis indicator combining 20+ essential trading tools in a single chart display. Moving Averages EMA (Exponential Moving Average): 9, 21, 50, 200 periods SMA (Simple Moving Average): configurable period Customizable colors and line widths Price position indicators (above/below) Oscillators & Momentum RSI (Relative Strength Index): adjustable overbought/oversold levels MACD (Moving Average Convergence Divergence): customizable fast/slow/signal periods Stochasti
    This is a standard moving average indicator. I have added a quick control panel in the bottom left corner for it. When multiple different parameters of this indicator are simultaneously enabled, the control panel can quickly switch between different parameters of the indicator, making it easier to observe multiple indicators simultaneously Parameter description: Indicator ID: The unique ID of the indicator. When starting multiple instances, this ID must be unique and cannot be duplicated. Contro
    FREE
    Candle close countdown indicator. Almost all indicators work by ticks and therefore stop counting when the price stops in moments of little volatility. This indicator does not stop and remains synchronized with the broker's clock. It also has other functions that can help the trader. All features are configurable and you can choose if you want to use it or not: - Volume control:                         the counter changes color when the current candle has a higher volume of contracts than the pr
    This indicator draws lines at the open, close, high and low price of the last chart candle from the set timeframe. In addition, a label shows whether it was an up or down candle. The standard settings follow the original idea of ​​getting the price data from the daily timeframe for day trading/scalping, but since this indicator is fully customizable, you can also set a different timeframe. Based on the drawn price lines, you can then also display Fibonacci levels. This function can also be
    Klinger Volume Oscillator  Short Description A volume-based flow analysis tool designed to visualize buying and selling pressure through a dual-colored histogram. Detailed Description The Klinger Volume Oscillator Histo is a technical analysis indicator that explores the relationship between price movement and transactional volume. By converting the traditional Klinger Oscillator into a dynamic histogram, this tool allows traders to observe the internal strength of market movements. The indicato
    With the help of the Fine Market Forex indicator algorithm, you can quickly understand what kind of trend is currently developing in the market. Fine Market is a combined indicator based on several instruments. Fine Market is based on classic basic technical indicators - MA, RSI, MACD, Bollinger Bands, Stochastic. A trader does not need to impose several lines on Forex charts and set up each indicator separately. Fine Market is already successfully combined and has simplified settings, convenie
    Description of work The MA7 Aster indicator is based on the standard Moving Average indicator. Shows the price deviation from the moving average. Detailed information about the MA7 Aster indicator. Indicator settings General settings: Period ; Method ; Apply to ; Minimum distance – minimum distance from the moving average to the closing price of the candle. Message settings: Send message to the terminal (Alert) – permission to send messages to the terminal using the Alert function; Send messag
    売買通知を提供するように設計された強力なテクニカル指標である エントリーポイント の紹介です。このインジケーターは、3 つの異なる時間枠にわたる 5 つの移動平均、CCI、RSI、ストキャスティクス、ビル ウィリアムズ、および出来高インジケーターを分析して、正確なシグナルを生成します。プロのトレーダーに無制限のカスタマイズオプションを提供し、経験と戦略に基づいてインジケーターを調整できます。エントリー ポイントは、モバイル デバイス、電子メール、音声付きポップアップ アラートを介してユーザーに信号を送信します。 インジケーターのメインシグナルは、異なるタイムフレームからのシグナルの組み合わせに基づいて決定されます。たとえば、M1、M5、および M15 がすべて売りシグナルを示している場合、メインシグナルは売りまたは強い売りとして分類されます。 幅広い機能を備えたエントリー ポイントは、トレーダーにとって包括的なツールです。 6 つの人気のあるインジケーターが含まれており、3 つの時間枠にわたる分析が可能です。このインジケーターのパラメーターはユーザーフレンドリーで完全にカスタマイズ可能
    This is a complex indicator for developing custom trading strategies. It can also sort out already existing strategies. The initial objective of the indicator was to combine a couple of indicators. After combining 12 indicators, I realized I need to implement the ability to separate them as well as arrange the signals from the built-in indicators and systems. The indicator provides signals as buffer arrows: 0 - buy, 1 - sell. The contents of the complex indicator: Indicators Let me know if you
    Dynamic ATR Bands & Signals - Volatility-Based Trading System Dynamic ATR Bands & Signals combines the power of adaptive volatility bands with precision stochastic signals to help you identify high-probability trading opportunities across all markets and timeframes. Key Features Adaptive Volatility Bands - Three levels of ATR-based bands automatically adjust to market conditions Precision Entry Signals - Clear buy/sell arrows based on stochastic momentum Fully Customizable - Adjust ever
    Introducing Trend Zones: Your Ultimate Tool for Precise Market Entry and Exit Points. Trend Zones is a revolutionary MetaTrader 4 indicator designed to provide traders with clear buy and sell zones based on trend reversals and price action. Built upon advanced algorithms and non-repainting technology, this indicator offers unparalleled accuracy in identifying optimal entry and exit points in the forex market. Key Features: 1. Non-Repainting Signals: Trend Zones delivers non-repainting signals,
    Overview The Williams VIX Fix Indicator is a MetaTrader 4 tool designed to help traders identify potential market tops and bottoms. By analyzing price extremes relative to recent highs and lows, it highlights overbought and oversold conditions using two histograms displayed in a separate window. The indicator combines the Williams VIX Fix calculation with Bollinger Bands and percentile-based thresholds to provide clear signals for potential reversals.  Key Features Market Tops and Bottoms Market
    ブログ: https://www.mql5.com/en/blogs/post/761835 MT4バージョン: https://www.mql5.com/en/market/product/122732 MT5バージョン: https://www.mql5.com/en/market/product/122733 CORRELATION MASTER:ペアを2倍にしてリスクを半分に 負の相関と自動ヘッジのためのスマートEA Correlation Masterは、通貨ペア間の負の相関戦略を活用する自動EAです。このEAは、反対のペア(例:EURUSDの買いとUSDCHFの売り)で反対のポジションを開くことで、リスクを最小限に抑えながら利益を最大化することを目指します。 柔軟なリスク管理と複数通貨ペアの設定を備えたこのEAは、スマートな自動ヘッジ戦略を求めるトレーダーに最適です。 主な機能 自動負相関戦略 反対方向に動く通貨ペアで買いと売りのポジションをオープンします。 例:EURUSD(買い)↔ USDCHF(売り) 複数通貨ペアのサポート 最大13通貨ペア(E
    The Chart Navigator is a powerful and user-friendly indicator designed to enhance your chart navigation experience in the MetaTrader platform. With its advanced features and intuitive interface, it enables traders to effortlessly explore multiple timeframes, switch between symbols, and efficiently analyze price movements. Key Features: Timeframe Navigation: Seamlessly switch between different timeframes with just a single click. The Chart Navigator provides a graphical object that allows you to
    FREE
    VWAP Indicator MT4
    Kyra Nickaline Watson-gordon
    5 (1)
    Description : VWAP (Volume-Weighted Average Price) is the ratio of the value traded to total volume traded over a particular time horizon. It is a measure of the average price at which pair is traded over the trading horizon. Read More. All Symbols and All Timeframes are supported. Indicator Inputs :     VWAP Mode : Mode of VWAP Calculation. Options can be selected : Single,Session,Daily,Weekly,Monthly     Volumes : Real Volumes,Tick Volumes     Price Type : Used price for calculating.
    このプロダクトを購入した人は以下も購入しています
    Gann Made Easy は、ミスター・ギャンの理論を使用した取引の最良の原則に基づいた、プロフェッショナルで使いやすい外国為替取引システムです。 W・D・ガン。このインジケーターは、ストップロスとテイクプロフィットレベルを含む正確な買いと売りのシグナルを提供します。 PUSH通知を利用して外出先でも取引可能です。 ご購入後、取引方法の説明と優れた追加インジケーターを無料で入手するには、私にご連絡ください! おそらく、ギャンの取引手法についてはすでに何度も聞いたことがあるでしょう。通常、ギャンの理論は初心者のトレーダーだけでなく、すでにある程度の取引経験がある人にとっても非常に複雑なものです。なぜなら、ギャンの取引手法は理論的にはそれほど簡単に適用できるものではないからです。私はその知識を磨き、最良の原則を私の外国為替インジケーターに組み込むために数年を費やしました。 このインジケーターは非常に簡単に適用できます。必要なのは、それをチャートに添付し、簡単な取引推奨事項に従うだけです。このインジケーターは常に市場分析の仕事を行い、取引の機会を探します。適切なエントリーポイントを検出す
    An exclusive indicator that utilizes an innovative algorithm to swiftly and accurately determine the market trend. The indicator automatically calculates opening, closing, and profit levels, providing detailed trading statistics. With these features, you can choose the most appropriate trading instrument for the current market conditions. Additionally, you can easily integrate your own arrow indicators into Scalper Inside Pro to quickly evaluate their statistics and profitability. Scalper Inside
    M1 SNIPER は使いやすいトレーディングインジケーターシステムです。M1時間足向けに設計された矢印インジケーターです。M1時間足でのスキャルピングのためのスタンドアロンシステムとして、また既存のトレーディングシステムの一部としても使用できます。このトレーディングシステムはM1時間足での取引に特化して設計されていますが、他の時間足でも使用できます。元々、この手法はXAUUSDとBTCUSDの取引用に設計しましたが、他の市場においても役立つと考えています。 インジケーターのシグナルは、トレンドの方向と逆方向に取引できます。インジケーターのシグナルを利用して両方向に取引するのに役立つ特別な取引テクニックをご紹介します。この手法は、特別な動的なサポートとレジスタンスの価格帯を利用することに基づいています。 ご購入後、M1 SNIPER矢印インジケーターをすぐにダウンロードできます。さらに、M1 SNIPERツールのすべてのユーザーに、以下のスクリーンショットに表示されているApollo Dynamic SRインジケーターを無料で提供しています。この2つのインジケーターを組み合わせることで
    まず第一に、この取引インジケーターは再描画されず、再描画されず、遅延しないことを強調する価値があります。これにより、手動取引とロボット取引の両方に理想的なものになります。 ユーザーマニュアル:設定、入力、戦略。 アトミックアナリストは、価格の強さとモメンタムを利用して市場でより良いエッジを見つけるためのPA価格アクションインジケーターです。ノイズや誤ったシグナルを除去し、取引ポテンシャルを高めるための高度なフィルターを備えています。複雑なインジケーターの複数のレイヤーを使用して、アトミックアナリストはチャートをスキャンし、複雑な数学的計算をシンプルなシグナルと色に変換します。これにより、どのような初心者トレーダーでも理解して使用し、一貫した取引の決定を行うことができます。 「アトミックアナリスト」は、新規および経験豊富なトレーダー向けにカスタマイズされた包括的な取引ソリューションです。プレミアムインジケーターとトップノッチの機能を1つの取引戦略に組み合わせ、すべてのタイプのトレーダーにとって汎用性のある選択肢にします。 デイリートレーディングとスキャルピング戦略:高速で正確な
    Trend Screener
    STE S.S.COMPANY
    4.79 (95)
    トレンドインジケーター、1つのツールに組み込まれたすべての重要なトレンド機能を備えたトレンドトレーディングとフィルタリングのための画期的なユニークなソリューション! これは、すべてのシンボル/商品(外国為替、商品、暗号通貨、インデックス、株式)で使用できる100%再描画されていないマルチタイムフレームおよびマルチ通貨インジケーターです。 期間限定オファー: サポートおよびレジスタンス スクリーナー インジケーターは、たった 50 ドルで永久的にご利用いただけます。(元の価格 250 ドル) (オファー延長) トレンドスクリーナーは、チャート内のドットで矢印トレンドシグナルを提供するインジケーターに続く効率的なインジケーターです。 トレンド分析インジケーターで使用できる機能: 1.トレンドスキャナー。 2.最大利益分析を備えたトレンドライン。 3.トレンド通貨強度メーター。 4.アラート付きのトレンド反転ドット。 5.アラート付きの強いトレンドドット。 6.トレンド矢印 毎日の分析例、毎日のシグナルパフォーマンス...など、トレンドスクリーナーインジケーターを使用して、ここで見つけること
    Linear Trend Predictor ー - エントリ ポイントと方向サポート ラインを組み合わせたトレンド インジケーター。高値/安値チャネルを突破するという原理に基づいて機能します。 インジケーターのアルゴリズムは市場のノイズをフィルタリングし、ボラティリティと市場の動向を考慮します。 インジケーターの機能  平滑化手法を使用して、市場のトレンドと、買い注文または売り注文を開くためのエントリー ポイントを表示します。  任意の時間枠のチャートを分析して、短期および長期の市場の動きを判断するのに適しています。  あらゆる市場や時間枠に適応可能な入力パラメータにより、トレーダーはインジケーターを独自にカスタマイズできます。  設定されたインジケーター信号は消えず、再描画もされません。ローソク足の終値で決定されます。  いくつかの種類の通知が矢印と組み合わされています。  このインジケーターは、独立した取引システムとして使用することも、他の取引システムへの追加として使用することもできます。  あらゆるレベルの経験を持つトレーダーが使用できます。 主なパラメータ Vol
    After purchase, contact me privately to receive 7 days of free testing with EA Forex Proton. This advanced MT4 trading robot automatically executes signals from any MT4 indicator, including Market Makers. The latest version also includes AI integration, allowing each trade signal to be analyzed using Artificial Intelligence. Market Makers is a powerful price action trading system designed to identify high-probability Buy and Sell opportunities based on market momentum, volatility, and price po
    トレンドラインプロ   市場の真の方向転換点を理解するのに役立ちます。この指標は、真のトレンド反転と主要プレーヤーが再び参入するポイントを示します。 分かりますか     BOSライン   複雑な設定や不要なノイズなしに、より長い時間足でのトレンドの変化と重要なレベルを把握できます。シグナルは再描画されず、バーが閉じた後もチャート上に残ります。 VERSION MT 5     -     RFI LEVELS PRO インジケーター と組み合わせることで、その潜在能力を最大限に発揮します。 インジケーターが示す内容: 本当の変化   トレンド(BOSライン) 一度シグナルが現れたら、それは有効です!これは、リペイント機能を持つインジケーターとの重要な違いです。リペイント機能を持つインジケーターは、シグナルを発した後、それを変更し、資金の損失につながる可能性があります。これにより、より高い確率と精度で市場に参入できます。また、矢印が現れた後、目標値(利益確定)に達するか、反転シグナルが現れるまで、ローソク足の色を変更する機能もあります。 繰り返しエントリ       主要プレーヤーの
    GOLD Impulse with Alert
    Bernhard Schweigert
    4.67 (12)
    このインディケータは、当社の2つの製品 Advanced Currency IMPULSE with ALERT  +   Currency Strength Exotics . のスーパーコンビネーションです。 このインジケーターは全ての時間枠で作動し、8つの主要通貨と1つのシンボルの強弱のインパルスをグラフで表示します。 このインジケータは、金、エキゾチックペア、商品、インデックス、先物など、あらゆるシンボルの通貨強度の加速度を表示することに特化されています。金、銀、原油、DAX、US30、MXN、TRY、CNHなどの通貨強度の加速度(インパルスまたは速度)を表示するために、任意のシンボルを9行目に追加できる、この種の最初のものです。 新しいアルゴリズムに基づいて構築され、潜在的な取引の特定と確認がさらに容易になりました。これは、通貨の強さや弱さが加速しているかどうかをグラフィカルに表示し、その加速の速度を測定するためです。加速すると物事は明らかに速く進みますが、これはFX市場でも同じです。つまり、反対方向に加速している通貨をペアリングすれば、潜在的に利益を生む取引を特定
    「 Dynamic Scalper System 」インジケーターは、トレンド波の中でスキャルピング取引を行う手法のために設計されています。 主要通貨ペアと金でテスト済みで、他の取引商品との互換性があります。 トレンドに沿った短期的なポジションオープンのシグナルを提供し、追加の価格変動サポートも提供します。 インジケーターの原理 大きな矢印はトレンドの方向を決定します。 トレンド波の中では、小さな矢印の形でスキャルピングシグナルを生成するアルゴリズムが機能します。 赤い矢印は強気方向、青い矢印は弱気方向です。 トレンドの方向には敏感な価格変動ラインが描かれ、小さな矢印のシグナルと連動します。 シグナルは次のように機能します。適切なタイミングでラインが現れるとエントリーシグナルが形成され、ラインが開いている間はポジションが保持され、完了すると取引が終了します。 推奨される動作時間枠はM1~H4です。 矢印は現在のローソク足に形成され、次のローソク足が開いている場合は、前のローソク足の矢印は再描画されません。 入力パラメータ Trend Wave Period - トレンド方向
    ご紹介     Quantum Breakout PRO は 、ブレイクアウト ゾーンの取引方法を変革する画期的な MQL5 インジケーターです。 13年以上の取引経験を持つ経験豊富なトレーダーのチームによって開発された Quantum Breakout PROは 、革新的でダイナミックなブレイクアウトゾーン戦略により、あなたの取引の旅を新たな高みに押し上げるように設計されています。 クォンタム ブレイクアウト インジケーターは、5 つの利益ターゲット ゾーンを備えたブレイクアウト ゾーン上のシグナル矢印と、ブレイクアウト ボックスに基づいたストップロスの提案を提供します。 初心者トレーダーにもプロのトレーダーにも適しています。 量子EAチャネル:       ここをクリック MT5バージョン:   ここをクリック 重要!購入後、インストールマニュアルを受け取るためにプライベートメッセージを送ってください。 推奨事項: 時間枠: M15 通貨ペア: GBPJPY、EURJPY、USDJPY、NZDUSD、XAUUSD アカウントの種類: ECN、Raw、またはスプレッドが非
    MetaForecast M4
    Vahidreza Heidar Gholami
    5 (2)
    MetaForecastは、価格データのハーモニクスに基づいて、どんな市場の未来を予測し視覚化します。市場が常に予測可能ではありませんが、価格にパターンがある場合、MetaForecastは可能な限り正確な未来を予測できます。他の類似製品と比較して、MetaForecastは市場のトレンドを分析することでより正確な結果を生成することができます。 入力パラメータ Past size (過去のサイズ) MetaForecastが将来の予測を生成するために使用するバーの数を指定します。モデルは選択したバー上に描かれた黄色の線で表されます。 Future size (将来のサイズ) 予測すべき将来のバーの数を指定します。予測された将来は、ピンクの線で表示され、その上に青い回帰線が描かれます。 Degree (程度) この入力は、MetaForecastが市場で行う分析のレベルを決定します。 Degree 説明  0 Degree 0の場合、価格の全てのピークや谷、そして詳細をカバーするために、「Past size」の入力に大きな値を使用することが推奨されています。  1 (推奨) Degre
    現在20%OFF! 初心者やエキスパートトレーダーに最適なソリューションです。 このインディケータは、エキゾチックペア・コモディティ・インデックス・先物など、あらゆるシンボルの通貨の強さを表示することに特化したインディケータです。金、銀、原油、DAX、US30、MXN、TRY、CNHなどの通貨の強さを表示するために、9行目にどのシンボルでも追加することができます。独自の機能を多数搭載し、新しい計算式を採用したため、ユニークで高品質、かつ手頃な価格のトレーディングツールとなっています。新しいトレンドやスキャルピングチャンスのトリガーポイントを正確に把握することができるため、あなたのトレードがどのように改善されるか想像してみてください。 ユーザーマニュアル:ここをクリック   https://www.mql5.com/en/blogs/post/708876 すべての時間枠に対応します。あなたはすぐにトレンドを見ることができるようになります! 新しいアルゴリズムに基づいて設計されているため、潜在的な取引の特定と確認がより簡単になります。これは、8つの主要通貨と1つのシンボルの強弱
    The Reversal Master is an indicator for determining the current direction of price movement and reversal points. The indicator will be useful for those who want to see the current market situation better. The indicator can be used as an add-on for ready-made trading systems, or as an independent tool, or to develop your own trading systems. The Reversal Master indicator, to determine the reversal points,  analyzes a lot of conditions since the combined analysis gives a more accurate picture of t
    Scalper Vault は、スキャルピングを成功させるために必要なすべてを提供するプロフェッショナルなスキャルピング システムです。このインジケーターは、外国為替およびバイナリー オプションのトレーダーが使用できる完全な取引システムです。推奨される時間枠は M5 です。 システムは、トレンドの方向に正確な矢印シグナルを提供します。また、トップとボトムのシグナルとギャン マーケット レベルも提供します。 インジケーターは、プッシュ通知を含むすべてのタイプのアラートを提供します。 インジケータの購入後にご連絡ください。私の個人的な取引の推奨事項と素晴らしいボーナス指標を無料で共有します! 幸せで有益な取引をお祈りします!
    Route Lines Prices -は、価格の方向性を予測するために設計されたインジケーターです。シンプルなインターフェースには、価格変動と将来の方向性を計算するための複数のアルゴリズムが搭載されています。これらのアルゴリズムには、使用する時間枠に基づいたボラティリティ計算と価格平滑化が含まれています。 このインジケーターには、「 Calculating price values 」値を変更するためのパラメーターが1つだけあります。デフォルト値の1は、バランスの取れた自動計算を提供し、インジケーターを手動で設定することなく使用できます。 値を2から500まで手動で変更することで、インジケーターを独自のトレーディングシステムに合わせてカスタマイズできます。 このインジケーターは、M1からH4の時間枠での使用を推奨します。あらゆる取引銘柄で使用できます。 シグナル矢印はローソク足の終値で生成され、過去の履歴には再描画されません。 メインチャートには、重複した矢印が表示されます。 複数のアラートタイプが利用可能です。内蔵のライン軌跡カウンターは、終値に基づいて動作します。これ
    CRT Multi-Timeframe Market Structure & Liquidity Sweep Indicator Non-Repainting | Multi-Asset | MT5 Version Available MT5 Version:   https://www.mql5.com/en/market/product/162075 Full User Guide — explains what each feature does and why:   https://www.mql5.com/en/blogs/post/767525 Quick Start User Guide  — explains how to configure and in what order:  https://www.mql5.com/en/blogs/post/767540 Indicator Overview CRT Ghost Candle HTF Fractal is a complete institutional-grade market structure too
    通貨強さウィザードは、取引を成功させるためのオールインワン ソリューションを提供する非常に強力な指標です。このインジケーターは、複数の時間枠のすべての通貨のデータを使用して、このまたはその外国為替ペアのパワーを計算します。このデータは、使いやすい通貨インデックスと通貨パワーラインの形式で表され、特定の通貨のパワーを確認するために使用できます。 必要なのは、取引したいチャートにインジケーターを接続することだけです。インジケーターは、取引する通貨の実際の強さを示します。このインジケーターは、トレンドに合わせて取引するときに有利に利用できる売買高の圧力の極値も示します。このインジケーターには、フィボナッチに基づく可能なターゲットも表示されます。 このインジケーターは、PUSH 通知を含むあらゆるタイプのアラートを提供します。 購入後ご連絡下さい。私の取引のヒントをあなたと共有し、素晴らしいボーナスインジケーターを無料で提供します! 幸せで有益な取引をお祈りします。
    MT5バージョンはこちらからご利用いただけます: https://www.mql5.com/en/market/product/50048 Telegramチャンネル&グループ: https://t.me/bluedigitsfx V.I.Pグループアクセス: 有料商品の購入証明を当方の受信箱へ送信してください 推奨ブローカー: https://bit.ly/BlueDigitsFxStarTrader BlueDigitsFx Easy 123 System — MT4用の強力な反転およびブレイクアウト検出システム 初心者から上級者まで使いやすい、マーケット構造の変化、ブレイクアウト、トレンド反転を視覚的に捉えるオールインワンのノンリペイントインジケーターです。 本インジケーターは「123」パターンに従って動作します: ステップ1: 新しい高値または安値をビッグアローで表示し、エキゾーストポイント(勢いの弱まり)を示します ステップ2: 構造のブレイクを知らせ、トレンド反転の可能性を示唆します ステップ3: リトルアローとサポート/レジスタンスドットでエントリーを確定します
    Auto Optimized Parabolic RSI: 高度な3Dモメンタムエンジン ほとんどのリテール向けインジケーターは、市場のボラティリティが変化した瞬間に破綻する静的な入力値に依存しているため、失敗に終わります。Auto Optimized Parabolic RSIは、自らの数学的優位性を継続的に再計算することで「インジケーターの陳腐化」問題を解決し、機関投資家レベルの定量的適応力をMT5ターミナルに直接もたらします。 最大の強み: カスタムインメモリ3D最適化   標準的な自動最適化ツールは、インジケーターの呼び出しで端末に過負荷をかけるため、頻繁にMT5プラットフォームをフリーズさせます。本ツールは、このボトルネックを完全に回避しています。RAMベースのカスタムネイティブ計算機を内蔵した内部エンジンは、チャートを読み込んだりタイムフレームを変更したりするたびに、超高速の3Dグリッド探索を実行します。RSI期間(頻度)、SARステップ(加速度)、SAR最大値(制限速度)を同時にスイープし、プラットフォームを遅延させることなく、数万通りものパラメーターの組み合わせを絶対的
    Advanced Supply Demand
    Bernhard Schweigert
    4.91 (299)
    現在40%オフ 初心者にもエキスパートトレーダーにも最適なソリューション このインジケーターは独自の機能と新しい公式を多数内蔵しており、ユニークで高品質かつ手頃な取引ツールです。このアップデートでは、2つの時間枠ゾーンを表示できるようになります。より長いTFだけでなく、チャートTFとより長いTF(ネストゾーンを表示)の両方を表示できます。すべてのSupply Demandトレーダーの皆さんのお気に召すはずです。:) 重要情報の公開 Advanced Supply Demandの可能性を最大化するには、 https://www.mql5.com/ja/blogs/post/720245 にアクセスしてください。   エントリーまたはターゲットの正確なトリガーポイントを正確に特定できれば取引がどのように改善されるか想像してみてください。新しい基盤となるアルゴリズムに基づいて構築されているため、買い手と売り手の間の潜在的な不均衡をさらに簡単に特定できます。これは、最も強い需要と供給のゾーンと、過去のパフォーマンス(古いゾーンを表示)がグラフィカルに表現されるためです。これらの機能は、最適な
    Super Signal Market Slayer 非リペイント|高精度|マルチマーケット対応インテリジェントトレンド指標 トレードにおいて本当に難しいのは、 注文することではなく、相場のノイズの中で「トレンドが始まった瞬間」を見極めることです。 Market Slayer はそのために開発されました。 本インジケーターは、日中取引向けに設計された非リペイント型のインテリジェント指標です。 多層確認とトレンドフィルターにより、重要な局面でのみ明確かつ信頼性の高い Buy / Sell シグナルを表示します。 主な特長 非リペイントシグナル 一度表示されたシグナルは固定され、消えたり移動したりしません。 高精度なトレンド判定 複数銘柄で検証され、特にゴールド M5 / M15 で安定した結果を示します。 マルチマーケット対応 ゴールド、FX、指数、主要暗号資産に対応。 日中取引向け最適化 M5・M15 に特化し、ノイズを抑え実行性を向上。 直感的で分かりやすい 初心者でも理解しやすく、すぐに使用可能。 技術ロジック概要 Market Slayer は単一条件の矢印ではありません。 以
    Super Reversal Indicator with Alert 概要 Super Reversal Indicator with Alert は、マルチタイムフレーム分析を用いて高確率の相場反転ポイントを特定するためのトレーディングツールです。ストキャスティクスのモメンタム、需給ゾーン、そして価格のリジェクションシグナルを組み合わせて分析を行います。 本インジケーターは、明確な視覚シグナルとリアルタイムアラートにより、トレーダーが市場の転換点を見極めるのをサポートします。 主な機能 マルチタイムフレーム ストキャスティクス分析 上位時間足のストキャスティクスを使用(ユーザー設定可能) モメンタムの変化やクロスシグナルを検出 エントリー精度を高めるための買われ過ぎ・売られ過ぎレベルを表示 反転リジェクションシグナル 重要な価格帯での強いリジェクションローソク足を検出 以下のポイントでの反転を識別 日足高値での売り反転 日足安値での買い反転 視認性を高めるため、チャート上に矢印を表示 需給ゾーン(Supply and Demand) H4およびD1の上位時間足から重要なゾーンを自動
    Stratos Pali
    Michela Russo
    4.43 (7)
    Stratos Pali Indicator   is a revolutionary tool designed to enhance your trading strategy by accurately identifying market trends. This sophisticated indicator uses a unique algorithm to generate a complete histogram, which records when the trend is Long or Short. When a trend reversal occurs, an arrow appears, indicating the new direction of the trend. Important Information Revealed Leave a review and contact me via mql5 message to receive My Top 5 set files for Stratos Pali at no cost! Dow
    Dynamic Forex28 Navigator - 次世代の Forex 取引ツール。 現在 49% オフ。 Dynamic Forex28 Navigator は、長年人気のインジケーターを進化させたもので、3 つの機能を 1 つにまとめています。 Advanced Currency Strength28 インジケーター (レビュー 695 件)  + Advanced Currency IMPULSE with ALERT (レビュー 520 件) + CS28 コンボ シグナル (ボーナス)。 インジケーターの詳細 https://www.mql5.com/en/blogs/post/758844 次世代の Strength インジケーターが提供するもの  オリジナルで気に入っていたすべての機能が、新機能と精度の向上によって強化されました。 主な機能: 独自の通貨強度計算式。 すべての時間枠でスムーズかつ正確な強度ライン。 トレンドの特定と正確なエントリーに最適です。 ダイナミックマーケットフィボナッチレベル (マーケットフィボナッチ)。 このインジケーターに固有
    現在40%OFF! 初心者やエキスパートトレーダーのためのベストソリューション! このダッシュボードソフトウェアは、28の通貨ペアで動作しています。それは私達の主要な指標(高度な通貨の強さ28と高度な通貨インパルス)の2に基づいています。それは全体の外国為替市場の大きい概観を与えます。それは、すべての(9)時間枠で28の外国為替ペアのための高度な通貨の強さの値、通貨の動きの速度と信号を示しています。チャート上で1つのインディケータを使用して市場全体を観察し、トレンドやスキャルピングの機会をピンポイントで見つけることができたら、あなたのトレードがどのように改善されるか想像してみてください。 このインディケータには、強い通貨と弱い通貨の識別、潜在的な取引の識別と確認がより簡単になるような機能が搭載されています。このインディケータは、通貨の強さや弱さが増加しているか減少しているか、また、すべての時間枠でどのように機能しているかをグラフィカルに表示します。 新機能として、現在の市場環境の変化に適応するダイナミックなマーケットフィボナッチレベルが追加され、すでに当社のAdvanced
    - Real price is 80$ - 40% Discount (It is 49$ now) Contact me for instruction, add group and any questions! - Non-repaint - I just sell my products in Elif Kaya profile, any other websites are stolen old versions, So no any new updates or support. - Lifetime update free Related product:   Bitcoin Expert Introduction The breakout and retest strategy is traded support and resistance levels. it involves price breaking through a previous level.  The break and retest strategy is designed to help tr
    Order Block Hunter
    Noha Mohamed Fathy Younes Badr
    5 (10)
    Order block hunter indicator is the best indicator for  hunt the order blocks that area where there has been a large concentration of limit orders waiting to be executed Order blocks are identified on a chart by observing previous price action and looking for areas where the price experienced significant movement or sudden changes in direction .This indicator does that for you by using very complicated codes and helps you to take the best areas To buy and sell because it make marks at the best a
    FX Power: 通貨の強弱を分析して、より賢い取引を実現 概要 FX Power は主要通貨と金の実際の強弱をあらゆる市場状況で理解するための必須ツールです。強い通貨を買い、弱い通貨を売ることで、 FX Power は取引の意思決定を簡素化し、高い確率の取引機会を見出します。トレンドを追従する場合でも、極端なデルタ値を使用して反転を予測する場合でも、このツールはあなたの取引スタイルに完全に適応します。ただ取引するだけではなく、 FX Power で賢く取引をしましょう。 1. なぜ FX Power がトレーダーにとって非常に有益なのか 通貨と金のリアルタイム強弱分析 • FX Power は主要通貨と金の相対的な強弱を計算し、マーケットダイナミクスに関する明確な洞察を提供します。 • どの資産がリードしているか、または後れを取っているかを監視して、取引するペアを賢く選びましょう。 マルチタイムフレームの包括的なビュー • 短期、中期、長期のタイムフレームで通貨と金の強弱を追跡し、マーケットトレンドに基づいて取引戦略を調整できます。 • スキャルピングからスイングトレード
    Apollo Secret Trend は、任意のペアと時間枠でトレンドを見つけるために使用できるプロのトレンド インジケーターです。インジケーターは、取引するペアや時間枠に関係なく、市場のトレンドを検出するために使用できる主要な取引インジケーターになることができます。インジケーターで特別なパラメーターを使用することにより、シグナルを個人の取引スタイルに適応させることができます。 このインジケーターは、PUSH 通知を含むすべてのタイプのアラートを提供します。インジケータの信号は再描画しないでください!提供されたスクリーンショットでは、アポロ シークレット トレンド インジケーターと買われ過ぎ/売られ過ぎのオシレーター インジケーターを組み合わせて見ることができます。これは完全に無料で提供されます。 購入後、2 番目の買われすぎおよび売られすぎのオシレーター インジケーターを無料で入手するために私に連絡してください!また、システムの使用方法についても説明します。お得な特典もご用意しております!
    作者のその他のプロダクト
    ** All Symbols x All Timeframes scan just by pressing scanner button ** After 18 years of experience in the markets and programming, Winner indicator is ready. I would like to share with you! *** Contact me  to send you instruction and add you in "123 scanner group" for sharing or seeing experiences with other users. Introduction The 123 Pattern Scanner indicator with a special enhanced algorithm is a very repetitive common pattern finder with a high success rate . Interestingly, this Winner in
    **   All Symbols   x   All Time frames   scan just by pressing scanner button ** After 18 years of experience in the markets and programming, Winner indicator is ready. I would like to share with you! ***  Contact me to send you " Trend Finder indicator " free, instruction and add you in "M1 Signal Scanner group" for sharing or seeing experiences with other users. Introduction: M1 Signal Scanner   is the indicator designed scalping M1 time frame to detect Small trend switching in the direction
    Market Structure
    Reza Aghajanpour
    4.86 (29)
    ** All Symbols x All Timeframes scan just by pressing scanner button ** *** Contact me  to send you instruction and add you in "Market Structure group" for sharing or seeing experiences with other users. Introduction: Market structure is important for both new and professional traders since it can influence the liquidity and price action of a market (Breakout and Retest). It’s also one of the most commonly used techniques to understand trends, identify potential reversal points, and get a feel f
    **   All Symbols   x   All Timeframes   scan just by pressing scanner button ** *** Contact me  to send you instruction and add you in "M W Scanner group" for sharing or seeing experiences with other users. Introduction: Double Top(M) and Double Bottom(W) is a very repetitive common type of price reversal patterns. Double Top resembles M pattern and indicates bearish reversal whereas Double Bottom resembles W pattern and indicates a bullish reversal that they have  high win  rate. The M W Scanne
    Discount: It will be $39 for a week or for 2 purchases!  Contact me  to send you instruction and add you in group. QM (Quasimodo) Pattern is based on Read The Market(RTM) concepts. The purpose of this model is to face the big players of the market (financial institutions and banks), As you know in financial markets, big traders try to fool small traders, but RTM prevent traders from getting trapped. This style is formed in terms of price candles and presented according to market supply and dem
    **   All Symbols   x   All Timeframes   scan just by pressing scanner button ** Discount: The price is $50$, But now it is just $39, Limited time offer is active. *** Contact me  to send you instruction and add you in "Trend Reversal group" for sharing or seeing experiences with other users. Introduction: Trendlines are the most famous technical analysis in trading . Trendlines continually form on the charts of markets across all the different timeframes providing huge opportunities for traders
    **   All Symbols   x   All Timeframes   scan just by pressing scanner button ** *** Contact me  to send you instruction and add you in "Channel Scanner group" for sharing or seeing experiences with other users. Introduction: The Channel pattern is described as the area located between two trend lines. This area is used for a measure of a trading range. In this case, the upper trend line connects price highs while the lower trend line connects price lows. Also when it comes to breakout points, it
    M W Scanner
    Reza Aghajanpour
    5 (11)
    **   All Symbols   x   All Timeframes   scan just by pressing scanner button ** *** Contact me  to send you instruction and add you in "M W Scanner group" for sharing or seeing experiences with other users. Introduction: Double Top(M) and Double Bottom(W) is a very repetitive common type of price reversal patterns. Double Top resembles M pattern and indicates bearish reversal whereas Double Bottom resembles W pattern and indicates a bullish reversal that they have  high win  rate. The M W Scanne
    ** All Symbols x All Timeframes scan just by pressing scanner button ** After 18 years of experience in the markets and programming, Winner indicator is ready. I would like to share with you! *** Contact me  to send you instruction  and add you in "123 scanner group" for sharing or seeing experiences with other users. Introduction The 123 Pattern Scanner indicator with a special enhanced algorithm is a very repetitive common pattern finder with a high success rate . Interestingly, this Winner in
    ** All Symbols x All Timeframes scan just by pressing scanner button ** *** Contact me  to send you instruction and add you in "RSI scanner group" for sharing or seeing experiences with other users. Introduction RSI divergence is a main technique used to determine trend reversing when it’s time to sell or buy because prices are likely to drop or pick in the charts. The RSI Divergence indicator can help you locate the top and bottom of the market. This indicator finds Regular divergence for pul
    **   All Symbols   x   All Time frames   scan just by pressing scanner button ** Discount: The price is $50$, But now it is just $35, Limited time offer is active. *** Contact me  to send you instruction and add you in "Swing scanner group" for sharing or seeing experiences with other users. Swing EA:  https://www.mql5.com/en/market/product/124747 Introduction: Swing Scanner   is the indicator designed to detect swings in the direction of the trend and possible reversal swings. The indicator st
    ** All Symbols x All Timeframes scan just by pressing scanner button ** *** Contact me  to send you instruction and add you in "All Divergences scanner group" for sharing or seeing experiences with other users. Introduction Divergence is a main technique used to determine trend reversing when it’s time to sell or buy because prices are likely to drop or pick in the charts. All Divergence indicator can help you locate the top and bottom of the market. This indicator finds Regular divergences for
    ** All Symbols x All Time frames scan just by pressing scanner button ** *** Contact me  to send you instruction and add you in "Harmonic Scanner group" for sharing or seeing experiences with other users. Introduction Harmonic Patterns are best used to predict turning point. Harmonic Patterns give you high win rate and high opportunities for trade in during one day. This indicator detects the best and successful patterns base on Harmonic Trading books . The Harmonic Patterns Scanner Scans All ch
    **   All Symbols   x   All Timeframes   scan just by pressing scanner button ** - Discount : it is not 50$, it is just 39$. *** Contact me  to send you instruction and add you in "Head & Shoulders Scanner group" for sharing or seeing experiences with other users. Introduction: Head and Shoulders   Pattern  is a very repetitive common type of price reversal patterns. The pattern appears on all time frames and can be used by all types of traders and investors.   The  Head and Shoulders  Scanner in
    **   All Symbols   x   All Timeframes   scan just by pressing scanner button ** *** Contact me  to send you instruction and add you in "Market Structure group" for sharing or seeing experiences with other users. Introduction: Market structure is important for both new and professional traders since it can influence the liquidity and price action of a market. It’s also one of the most commonly used techniques to understand trends, identify potential reversal points, and get a feel for current mar
    Swing Scanner
    Reza Aghajanpour
    4.65 (23)
    ** All Symbols x All Time frames scan just by pressing scanner button ** Discount: The price is $50$, But now it is just $35, Limited time offer is active. *** Contact me  to send you instruction and add you in "Swing scanner group" for sharing or seeing experiences with other users. Swing EA:  https://www.mql5.com/en/market/product/124747 Introduction: Swing Scanner is the indicator designed to detect swings in the direction of the trend and possible reversal swings. The indicator studies sev
    Contact me  to send you instruction and add you in group. QM (Quasimodo) Pattern is based on Read The Market(RTM) concepts. The purpose of this model is to face the big players of the market (financial institutions and banks), As you know in financial markets, big traders try to fool small traders, but RTM prevent traders from getting trapped. This style is formed in terms of price candles and presented according to market supply and demand areas and no price oscillator is used in it. RTM conc
    **   All Symbols   x   All Timeframes   scan just by pressing scanner button ** Discount: The price is $50$, But now it is just $39, Limited time offer is active. *** Contact me  to send you instruction and add you in "Trend Reversal group" for sharing or seeing experiences with other users. Introduction: Trendlines are the most famous technical analysis in trading . Trend lines continually form on the charts of markets across all the different timeframes providing huge opportunities for trader
    ** All Symbols x All Timeframes scan just by pressing scanner button ** ***Contact me to send you instruction and add you in "RSI scanner group" for sharing or seeing experiences with other users. Introduction RSI divergence is a main technique used to determine trend reversing when it’s time to sell or buy because prices are likely to drop or pick in the charts. The RSI Divergence indicator can help you locate the top and bottom of the market. This indicator finds Regular divergence for pullba
    ** All Symbols x All Time frames scan just by pressing scanner button ** *** Contact me  to send you instruction and add you in "Divergence group" for sharing or seeing experiences with other users. Introduction MACD divergence is a main technique used to determine trend reversing when it’s time to sell or buy because prices are likely to drop or pick in the charts. The MACD Divergence indicator can help you locate the top and bottom of the market. This indicator finds Regular divergence for pul
    Introduction : AI Swing EA is a fully automated trader with Fixed SL and high win rate. It will be 200$, it is now just 49$. No Martingale, No Grid Contact me  to send you instruction and add you in group. The next generation OpenAI model quickly gained significant attention with its broad range of capabilities and versatility, We used its expertise in assisting prediction prices in formulating and applying improved trading strategies. Our AI core is capable of extracting data insights from
    **  All Symbols  x  All Timeframes  scan just by pressing scanner button ** *** Contact me  to send you instruction and add you in "Wolfe Wave Scanner group" for sharing or seeing experiences with other users. Introduction: A Wolfe Wave is created with five-wave patterns in price. It shows supply and demand and a fight towards a balance price. T hese waves of price actions can help traders identify the boundaries of   the trend . Also  It helps forecast how the price will move in the near futur
    After 18 years of experience in the markets and programming, Winner indicator is ready. I would like to share with you! ***  Contact me to send you instruction and add you in group for sharing or seeing experiences with other users. Largest Market Cap belongs to Gold, Bitcoin and US30, So they have many traders and great for use in scalping. Gold and Bitcoin Assistant will earn profit on M5 time frames in Gold, Bitcoin and US30. Easy strategy comes from long years experiences, It is a piece of c
    **   All Symbols   x   All Timeframes   scan just by pressing scanner button ** ***  Contact me to send you instruction and add you in "Head & Shoulders Scanner group" for sharing or seeing experiences with other users. Introduction: Head and Shoulders   Pattern  is a very repetitive common type of price reversal patterns.   The pattern appears on all time frames and can be used by all types of traders and investors.   The  Head and Shoulders  Scanner indicator  Scans All charts just by pressing
    AI Next Level
    Reza Aghajanpour
    5 (3)
    BUY 1 EA, Get 1 EA FREE ( Gold Avatar EA is your gift)  The next generation G P T AI model quickly gained significant attention with its broad range of capabilities and versatility, We used its expertise in assisting prediction prices in formulating and applying improved trading strategies. Our AI core is capable of extracting data insights from financial news, Sentiment Analysis , specific formula, Oscillators and indicators status and other unstructured data sources. This informati
    AI Swing MT4
    Reza Aghajanpour
    5 (1)
    Introduction : AI Swing EA is a fully automated trader with Fixed SL and high win rate. It will be 200$, it is now just 49$. No Martingale, No Grid Contact me  to send you instruction and add you in group. The next generation OpenAI model quickly gained significant attention with its broad range of capabilities and versatility, We used its expertise in assisting prediction prices in formulating and applying improved trading strategies. Our AI core is capable of extracting data insights from
    **   All Symbols   x   All Time frames   scan just by pressing scanner button ** After 18 years of experience in the markets and programming, Winner indicator is ready. I would like to share with you! ***  Contact me to send you " Trend Finder indicator " free, instruction and add you in "M1 Signal Scanner group" for sharing or seeing experiences with other users. Introduction: M1 Signal Scanner   is the indicator designed scalping M1 time frame to detect Small trend switching in the direction
    * All Symbols x All Timeframes scan just by pressing scanner button ** *** Contact me to send you instructions and add you in "Candle Scanner group" for sharing or seeing experiences with other users. Introduction: Candles tell their story. When looking at a candle, it’s best viewed as a contest between buyers and sellers. Candlestick patterns are used to predict the future direction of price movement. Candlesticks are an easy way to understand the price action. You can use candlesticks to decid
    FREE
    ** All Symbols x All Time frames scan just by pressing scanner button ** *** Contact me  to send you instruction and add you in "Order Block group" for sharing or seeing experiences with other users. Introduction: The central banks and financial institutions mainly drive the market, Order block is considered a market behavior that indicates accumulation of orders from banks and institutions, then the market tends to make a sharp move(Imbalance) on either side once the order block is completed. O
    Market Heartbeat is in your hand! ***  Contact me to send you " Trend Finder indicator " free and add you in "Market Heartbeats group" for sharing or seeing experiences with other users. Introduction The Market Heartbeat indicator with a   special enhanced algorithm   (volume, money flow, cycle of market and a secret value) is a very repetitive trend finder with a high success rate .   Interestingly, this   Winner indicator   indicates that the trend has changed its direction or the end of a tre
    フィルタ:
    ivaylo slavkov
    177
    ivaylo slavkov 2025.03.18 15:40 
     

    Great indicator, Highly recommend

    Lieven Luc O Vandecasteele
    350
    Lieven Luc O Vandecasteele 2025.02.25 09:59 
     

    Excellent indicator to setup my trading plan. Recommend!

    peppe12345
    191
    peppe12345 2023.05.15 09:54 
     

    ユーザーは評価に対して何もコメントを残しませんでした

    iamhzn
    145
    iamhzn 2023.04.02 22:53 
     

    非常棒的指标!感谢制作者

    Chiedozie
    140
    Chiedozie 2023.03.25 14:52 
     

    Great software I highly recommend

    machasky
    189
    machasky 2023.03.02 21:21 
     

    Excellent tool merci

    vincenzo1964
    1150
    vincenzo1964 2022.12.22 18:05 
     

    ユーザーは評価に対して何もコメントを残しませんでした

    Ngo Hai Hoang
    126
    Ngo Hai Hoang 2022.12.21 07:08 
     

    The product is good, thanks to the author for giving me a great profit.

    Poh Leng Lim
    2129
    Poh Leng Lim 2022.12.11 12:09 
     

    ユーザーは評価に対して何もコメントを残しませんでした

    レビューに返信