Calc Revers

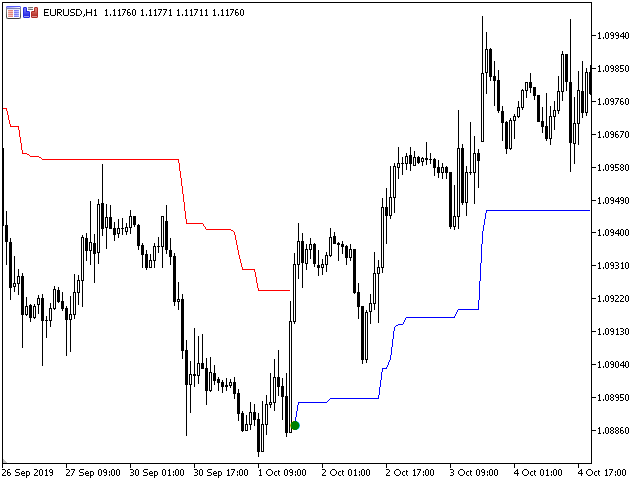
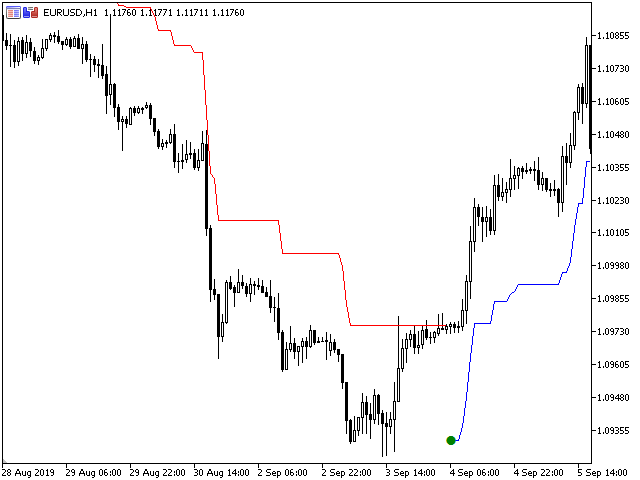
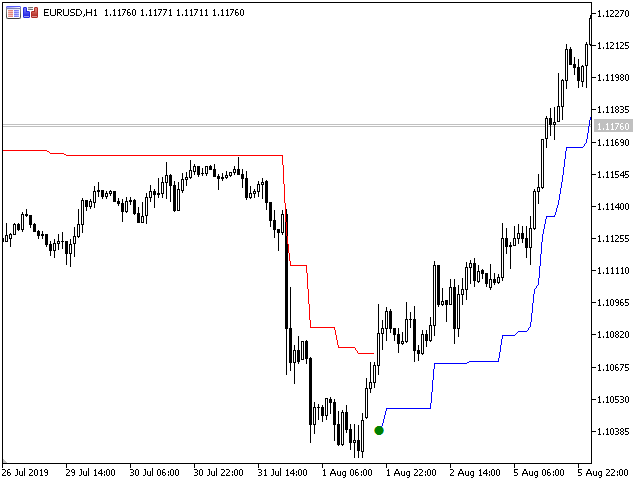
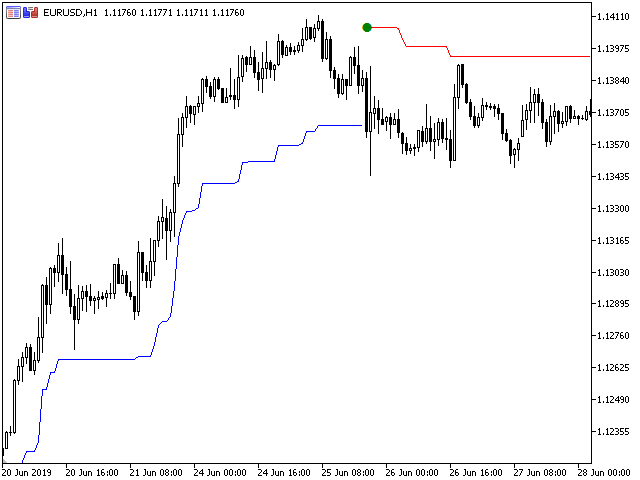
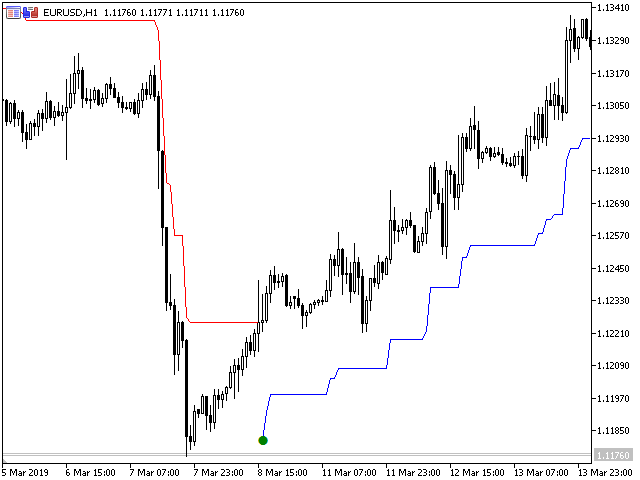
The main purpose of this indicator is to determine the moments of entry and exit from transactions, therefore, the Calc Revers indicator will display only the trend line and entry points, that is, displays the places to enter the market.

Despite the apparent simplicity of the indicator, inside it has complex analytical algorithms with which the system determines the moments of inputs. The indicator gives accurate and timely signals to enter and exit the transaction that appear on the current candle.

Using the indicator is very simple. When a dot and a blue line appear, open a buy deal. When a dot and a red line appear, open a sell deal.


おすすめのプロダクト
RBreaker Gold Indicatorsは、金先物の短期日内取引戦略であり、トレンドフォローと日内反転の2つの取引手法を組み合わせたものです。トレンド相場での利益を捉えるだけでなく、相場が反転した際には迅速に利確し、その流れに沿ってポジションを反転させることができます。 この戦略は、アメリカの雑誌『Futures Truth』において、15年連続で最も収益性の高い取引戦略トップ10に選ばれた実績を持ち、非常に長いライフサイクルを誇り、現在も国内外で広く使用・研究されています。 本インディケーターは、2026年の金先物の値動きに対応し、14日間のATR指標に基づいて、ブレイクアウト係数A、観察係数B、リバーサル係数Rをより合理的な値で定義しています。非常に優れたインディケーターであり、安定的な年間収益を実現しています。ぜひおすすめします〜
MercariaPattern1-2-3 відстежує рух ціни, знаходить трьоххвильові структури 1-2-3 та підсвічує момент, коли сценарій підтверджується пробоєм ключового рівня. MercariaPattern1-2-3 tracks price movement, detects three-leg 1-2-3 structures and highlights the moment when the scenario is confirmed by a key level breakout. Індикатор збирає локальні свінги в компактну фігуру 0–1–2–3 , чекає підтвердженого пробою та будує стрілку входу з готовими рівнями SL/TP. The indicator combines local swings into a
ATrend
Zaha Feiz
4.83 (18)
ATrend: その仕組みと使い方 仕組み MT5プラットフォーム向けの「ATREND」インジケーターは、テクニカル分析手法の組み合わせを利用して、トレーダーに堅牢な買いと売りのシグナルを提供するように設計されています。このインジケーターは主に、ボラティリティ測定のために平均真の範囲(ATR)を活用し、潜在的な市場動向を特定するためのトレンド検出アルゴリズムを併用しています。 購入後にメッセージを残すと、特別なボーナスギフトが贈呈されます。 主な特徴: - ダイナミックなトレンド検出: インジケーターは市場トレンドを評価し、シグナルを適宜調整することで、トレーダーが優位な市場環境に合わせて戦略を立てるのを支援します。     - ボラティリティ測定: ATRを使用することで、インジケーターは最適なストップロス(SL)とテイクプロフィット(TP)レベルを決定するために不可欠な市場ボラティリティを測定します。 - シグナルの視覚化: インジケーターは、チャート上に買いと売りのシグナルを視覚的に表示することで、トレーダーの意思決定を強化します。 操作手順 入力とセッティング - TimeF
A scalping indicator based on mathematical patterns, which on average gives signals with relatively small SL, and also occasionally helps to catch big moves in the markets (more information in the video) This indicator has three main types of notifications: The first type warns of a possible/upcoming signal on the next bar The second type indicates the presence of a ready signal to enter the market/open a position The third type is for SL and TP levels - you will be notified every time price re
STRICTLY FOR BOOM INDEX ONLY!!!!! Here I bring the Maximum Trend Arrows OT1.0 MT5 indicator. This indicator is made up of a combination of different trend indicators for entries and exits, for entries an orange arrow will paint on the chart below the current market and a red flag for closing of trades and it produces buy arrows only. When the orange arrow appears, it will appear along with it's sound to notify you. The 1H timeframe is recommended, don't use it anywhere else than on the 1H timefr
このインジケーターは、H.M.Gartley (「株式市場の利益」、1935 年) の開発に従って調和パターン (XABCD) を識別します。 D 点を透視投影の点として投影します (設定で ProjectionD_Mode = true を指定します)。 再描画はしません。 作業時間枠のバーが閉じるとき、特定されたパターン ポイントが Patterns_Fractal_Bars バーの間に移動していない場合、チャート上に (予想される価格変動の方向に) 矢印が表示されます。 この瞬間から、矢印はチャート上に永久に残ります。 連続した 2 ~ 3 つ以上の矢印 - これは市場状況の変化であり、再描画/再描画ではありません (時間枠を前後に切り替えてはなりません)。 注: 2 ~ 3 つ以上の矢印が連続している場合 - これは市況の変化であり、再描画ではありません。 パターンの総数は 85 です (Gartley-222 と Gartley-222WS を含む。完全なリストはコメント セクションにあります)。 識別されたすべてのパターンのうち、最後に識別されたパターンのみがベ
MetaBands M5
Vahidreza Heidar Gholami
4.5 (2)
MetaBandsは、強力でユニークなアルゴリズムを使用してチャンネルを描画し、トレンドを検出して、トレーダーに取引の入出ポイントを提供することができます。チャンネル指標に加えて、強力なトレンド指標でもあります。入力パラメータを使用して新しいチャンネルを作成するために、異なるタイプのチャンネルを統合することができます。MetaBandsは、市場のイベントについてユーザーに通知するために、すべてのタイプのアラートを使用します。 特徴 ほとんどのチャンネルアルゴリズムをサポート 強力なトレンド検出アルゴリズム 異なるタイプのチャンネルを統合する能力 マルチタイムフレームおよびマルチカレンシー(シグナルマトリックス) すべてのタイプのアラート機能(サウンド、画面フラッシャー、プッシュ通知、メール、ポップアップ、矢印) 再描画しない トレンド検出 MetaBandsは、チャネル内を振動する青いラインを使用してトレンドを検出します。ラインがチャネルの上部バンドに達すると、下降トレンドの開始を示し、下部バンドに達すると上昇トレンドの開始を示します。青いラインが中心ラインに近づくと、市場はコンソリ
Clear Signal AI — No‑Repaint Trend Confirmation + Trend Dashboard Clear Signal AI is a trend confirmation indicator built for fast, confident decisions. It combines confirmed on‑chart signals (designed to avoid repainting behaviour), SAR trend structure, multi‑timeframe alignment (M15/H1/H4) and a live confidence score — with a clean dashboard and optional alerts. Product overview Clear Signal AI is designed for traders who want clarity, structure and consistency. It provides: Confirmed trend ar
FREE
Trendline Targets Dashboard MT5 Trendline Targets Dashboard MT5 は、MetaTrader 5 用のインジケーターで、完全なビジュアル・トレードプランを表示します。 シグナル 、 エントリー価格(Entry) 、 ストップロス(Stop Loss) 、および 利確目標(Take Profits) を、リスク比率 R に基づいて自動的に計算します。 このツールは注文を出すものではありません。トレードの分析と視覚的管理を目的としたツールであり、自動売買ロボット(EA)ではありません。 リリース記念特典: 購入者全員に、私の MQL5 プロフィールにあるお好きな インジケーターを1つ無料でプレゼント します。 ※ 注意: Market Structure Order Block Dashboard MT5 は特典対象外です。 特典を受け取るには、購入後に MQL5 メッセージ機能でご希望の製品名をお送りください。 主な機能 ネオンエフェクト付きトレンドライン(強気/弱気) ローソク足確定時のトレンド反転による BUY/SELL
Enigmera MT5
Ivan Stefanov
3.67 (3)
ENIGMERA:市場の核心 (これは手動インジケーターであり、MetaTrader の現在のテスト環境では一部の機能がサポートされない場合があります) イントロダクション このインジケーターおよびトレーディングシステムは、金融市場に対する独自のアプローチを提供します。ENIGMERA はフラクタルサイクルを利用して、サポートおよびレジスタンスレベルを正確に算出します。実際の蓄積フェーズを示し、方向性と目標を明確にします。トレンド相場でも調整局面でも機能するシステムです。 仕組み インジケーターのほとんどの機能は、チャート左側のボタンを通じて操作され、市場の変化に素早く対応できます。 ボタン ON/OFF – インジケーター全体の表示/非表示を切り替えます。 Support – トレンドのメインサポートライン。 Ch – サポートチャネルを有効にし、許容される乖離範囲を示します。 Dev1(第1偏差)– サポート範囲内の価格変動を示し、市場の停滞またはエネルギー蓄積を示唆します。 Dev2(第2偏差)– 偏差間の価格変動を示し、トレンド形成と方向性を示します。 Dev3(第3偏差)–
DYJスーパートレンド波は高度に正確なピークと谷取引システムである。 この指標は市場に進出する時にろうそくの糸の最高点と最低点を探す。 シグナルの通知タイプがdyj supertrendに追加されました。 多空間信号が発生すると、 Alert mailSend、MobilePushという種類の通知信号を使用できます。 Input InpSignalPeriod = 10 BarDistance = 24 InpIsAlert = true ===================== DYJ SuperTrendWave is a highly accurate trading system. This indicator looks for the highest and lowest points of candles as entering and leaving the market. The notification type of signal has been added to the dyj supertrend. When a multi-space signa
トレンドトレーディング は、タイミングのプルバックとブレイクアウトにより、市場で起こっているトレンドから可能な限り利益を得るように設計された指標です。確立されたトレンドの中で価格が何をしているかを分析することにより、取引の機会を見つけます。 [ インストールガイド | 更新ガイド | トラブルシューティング | よくある質問 | すべての製品 ] 自信を持って効率的に金融市場を取引する むち打ちにならずに確立されたトレンドから利益を得る 収益性の高いプルバック、ブレイクアウト、早期の逆転を認識する この指標は、独自の品質とパフォーマンスを分析します 複数時間枠のダッシュボードを実装します インジケーターは再描画されていません 電子メール/音声/視覚アラートを実装します 確立されたトレンドは多くの取引機会を提供しますが、ほとんどのトレンド指標はそれらを完全に無視しています。インジケーターの解釈はかなり簡単です: (1) トレンドの変化 (2) トレンドの方向への後退 (3) トレンドの方向へのブレイクアウト 赤いダッシュ は下降トレンド中の修正です 青いダッシュ は上昇トレンド中
OBVCD Pro
Narayanan Mohanan Mohanan Krishnan
OBVCD Pro:定量的出来高ボラティリティインジケーター 説明: 18年の市場経験を持つ定量的プログラマーによって開発されたOBVCD Proは、テクニカル分析用に設計されたモメンタムオシレーターです。オン・バランス・ボリューム (OBV) の特性とMACD (移動平均収束拡散手法) のロジックを組み合わせ、1.618のフィボナッチ比率ボラティリティチャネルを利用しています。 標準的なオシレーターは多くの場合、価格のみに依存します。OBVCD Proは、累積出来高フローから収束と発散を計算します。5状態の数学的フィルターを適用することで、トレーダーがさまざまな資産クラスと時間枠にわたって出来高の蓄積、分布、モメンタムの枯渇を視覚化するのに役立ちます。 5状態モメンタムロジック 色分けされたヒストグラムは、ボラティリティバンドに対する出来高モメンタムの傾きを評価し、現在の市場状態を表示します: 強い強気 (ライムグリーン): 出来高がモメンタムを拡大しながらアッパーバンドを上抜けます。 弱い強気 (ライトグリーン): 出来高はアッパーバンドの上にありますが、モメンタムは減少しています
トレンドラインは、外国為替取引におけるテクニカル分析の最も重要なツールです。残念ながら、ほとんどのトレーダーはそれらを正しく描画していません。自動トレンドラインインジケーターは、市場のトレンドの動きを視覚化するのに役立つ本格的なトレーダー向けのプロフェッショナルツールです。 トレンドラインには、強気トレンドラインと弱気トレンドラインの2種類があります。 上昇トレンドでは、外国為替トレンドラインは価格変動の最低スイングポイントを介して描画されます。 少なくとも2つの「最低安値」を接続すると、トレンドラインが作成されます。 下降トレンドでは、トレンドラインは価格変動の最も高いスイングポイントを介して描画されます。 少なくとも2つの「最高値」を接続すると、トレンドラインが作成されます。 トレンドラインが壊れたとき? 弱気のろうそくが強気のトレンドラインの下で閉じ、ろうそくの高さがトレンドラインの上にあるとき、強気のトレンドラインは壊れます。 強気のろうそくが弱気のトレンドラインの上で閉じ、ろうそくの安値がトレンドラインの下にあるとき、弱気のトレンドラインは壊れます。 トレ
Cumulative Volume Delta MAX MTF Pro v4.4 — 出来高ベース・トレーディングの究極の優位性 一つのインジケーターですべてを支配する:市場の「真の意図」を見抜く 値動きに現れる前に、大口投資家(機関投資家)が何をしているかを知ることで、推測の域を脱しましょう。CVD MAX MTF Pro v4.4は出来高分析テクノロジーの到達点であり、複雑なデータを明確で実用的なシグナルへと変換します。このバージョンでは、外科的精度の「ダイバージェンス検出」と「グラデーション認識型モメンタム」を導入し、価格変動を駆動する隠れた力をかつてない精度で明らかにします。 v4.4の新機能:精度の進化 動的グラデーション認識型移動平均線 (MA) 従来の静的なトレンドラインを「4色グラデーションシステム」に置き換えました。単に「上昇トレンド」を見るだけでなく、そのトレンドの「健全性」をリアルタイムで把握できます: DeepSkyBlue: ゼロラインより上で上昇中(強気な急騰) Orange: ゼロラインより上で下落中(強気の衰退/押し目) Magenta: ゼロラインより
The Trend Detect indicator combines the features of both trend indicators and oscillators. This indicator is a convenient tool for detecting short-term market cycles and identifying overbought and oversold levels. A long position can be opened when the indicator starts leaving the oversold area and breaks the zero level from below. A short position can be opened when the indicator starts leaving the overbought area and breaks the zero level from above. An opposite signal of the indicator can b
Bollinger Trend Lines – MT4 & MT5 Bollinger Trend Lines is a professional volatility-based trend indicator designed to clearly identify trend direction and dynamic stop levels using Bollinger Bands. Fuses on one core principle: follow the trend, ignore noise, and let volatility define the stop. How it works The indicator builds trailing trend lines using Bollinger Bands: In an uptrend , the lower band trails price and can only rise In a downtrend , the upper band trails price and can only
The Super Arrow Indicator provides non-repainting buy and sell signals with exceptional accuracy. Key Features No repainting – confirmed signals remain fixed Clear visual arrows: green for buy, red for sell Real-time alerts via pop-up, sound, and optional email Clean chart view with no unnecessary clutter Works on all markets: Forex, gold, oil, indices, crypto Adjustable Parameters TimeFrame Default:   "current time frame" Function:   Sets the time frame for indicator calculation Options:   Can
Nrha
Ratna Purwantari
This indicator uses Fibonacci to determine your trading levels precisely and measurably. It helps you to earn big profits. This indicator can also be used for various currency charts. You can also combine it with other indicators that you like so that the profits you get are also even greater. I hope you give me input so that this indicator can be better. We recommend using for the period M1 to M15. feel free to discuss with me. Thanks. 
Limitless MT5 is a universal indicator suitable for every beginner and experienced trader. works on all currency pairs, cryptocurrencies, raw stocks Limitless MT5 - already configured and does not require additional configuration And now the main thing Why Limitless MT5? 1 complete lack of redrawing 2 two years of testing by the best specialists in trading 3 the accuracy of correct signals exceeds 80% 4 performed well in trading during news releases Trading rules 1 buy signal - the ap
Introducing to your attention the unique trading system/indicator "Scaled Vidya Trends", designed for dynamic scalp trading on trend volatility pairs hour + timeframes. Main features of Scaled Vidya Trends: -Multi-level market analysis: it works on H1, H2, H3 timeframes; -Uses the most popular currency pairs: EURUSD, GBPUSD, USDCAD. Brokers usually set one of the lowest spreads for these pairs; -Applies a scalping method based on local targets for signals; -Signals appears at the new open of
Indicator “Tempest” for MQL5 Market (SEO-optimized, in English) 1. Introduction The Tempest indicator is a modern technical tool for MetaTrader 5 designed to automatically detect market reversal points by analyzing RSI across multiple timeframes. Provides clear BUY/SELL signals that allow traders to react instantly to market conditions. Easily integrates into Expert Advisors for fully automated trading. SEO Keywords: Tempest, RSI indicator, MQL5 trading robot, Forex automation, RSI strategy
TL Method — Automatic Trendline Detection & Strength Indicator Tired of drawing trendlines manually? TL Method does it for you — automatically detecting, drawing, and scoring trendlines in real time. What it does: Scans up to 1000 bars to find valid support and resistance trendlines Scores each trendline by counting confirmed anchor touches Generates buy/sell signal arrows when price approaches strong trendlines Alerts you via popup, push notification, or sound — with smart cooldown to avoid spa
Smart Buy Sell Signal is a powerful and easy-to-use trend trading indicator designed for traders who want clear and reliable buy and sell signals. The indicator uses an ATR-based smart trailing algorithm to detect trend reversals and generate precise entry signals. When the market trend changes, the indicator automatically plots Buy and Sell arrows directly on the chart, helping traders quickly identify trading opportunities. To improve decision making, the indicator also includes a Multi-Timefr
This is an advanced multi-timeframe version of the popular Hull Moving Average (HMA) Features Two lines of the Hull indicator of different timeframes on the same chart. The HMA line of the higher timeframe defines the trend, and the HMA line of the current timeframe defines the short-term price movements. A graphical panel with HMA indicator data from all timeframes at the same time . If the HMA switched its direction on any timeframe, the panel displays a question or exclamation mark with a tex
Separating Lines Trading System for MetaTrader 5 Separating Lines Trading System is a price action indicator for MT5 designed to detect 2-bar continuation patterns where both candles share the same opening level and the second candle resumes the prevailing trend. A detailed user guide is available on the author’s MQL5 Blog . Additional updates are available through the author’s   MQL5 Channel . Depending on the current support policy, buyers may receive additional access to selected companion t
Crypto_Forex MT5用インジケーター「 Major_Trend_Histogram 」、リペイント機能なし。 - Major_Trend_Histogramインジケーターは、非常に大きなトレンドを捉えるために設計されています。 - インジケーターは2色で表示可能:ピンクは弱気トレンド、緑は強気トレンド(色は変更可能)。 - トレンドの初期段階を検知します。標準的なMAよりもはるかに効率的です。 - Major_Trend_Histogramは、プライスアクション、VSA、その他のインジケーターなど、他の取引手法と組み合わせることができます。 - インジケーターにはモバイルとPCの両方でアラートが利用できます。 Click here to see high quality Trading Robots and Indicators! これは、このMQL5ウェブサイトでのみ提供されるオリジナル製品です。
ACB Breakout Arrows MT5
KEENBASE SOFTWARE SOLUTIONS
3.5 (2)
ACB Breakout Arrows インジケーターは、特別なブレイクアウトパターンを検出することで、市場における重要なエントリーシグナルを提供します。このインジケーターはチャートを常に監視し、一方向に勢いが定着してきた段階で、主要な値動きの直前に精度の高いエントリーシグナルを表示します。 マルチシンボル・マルチタイムフレームスキャナーはこちらから - ACB Breakout Arrows MT5 用スキャナー 主な機能 ストップロスとテイクプロフィットの水準が自動で表示されます。 すべての時間足のブレイクアウトシグナルを監視できるMTFスキャナーダッシュボードを搭載。 デイトレーダー、スイングトレーダー、スキャルパーに最適。 シグナル精度を高めるための最適化されたアルゴリズム。 損益分岐点やスキャルピングターゲットに使える特別なライン(クイックプロフィットライン)。 勝率、平均利益などのパフォーマンス分析メトリクスを表示。 リペイントなし。 トレードの確認 - 低確率のトレードを除外するために ACB Trade Filter インジケーター を使用してください。 強い買い:
# RSI Pro Alert - Advanced RSI Indicator A powerful professional-grade RSI indicator with intelligent alerts, scheduled snapshots, and multi-dimensional notifications to help you capture market opportunities with precision! --- ## Key Features ### Smart Signal Detection - **Precision Cross Detection** : Automatically identifies critical moments when RSI crosses overbought/oversold levels - **State Tracking Mechanism** : Real-time monitoring of market state changes (Overbought/Overso
このプロダクトを購入した人は以下も購入しています
このインジケーターを購入された方には、以下の特典を 無料 で提供しています: 各トレードを自動で管理し、ストップロスとテイクプロフィットを設定し、戦略ルールに基づいてポジションを決済する補助ツール 「Bomber Utility」 様々な銘柄に合わせたインジケーターの設定ファイル(セットファイル) 「最小リスク」、「バランスリスク」、「待機戦略」 の3つのモードで使用できる Bomber Utility 用の設定ファイル このトレーディング戦略をすぐに導入・設定・開始できる ステップバイステップのビデオマニュアル ご注意: 上記の特典を受け取るには、MQL5のプライベートメッセージシステムを通じて販売者にご連絡ください。 オリジナルのカスタムインジケーター 「Divergence Bomber(ダイバージェンス・ボンバー)」 をご紹介します。これは、MACDのダイバージェンス(乖離)戦略に基づいた 「オールインワン」型のトレーディングシステム です。 このテクニカルインジケーターの主な目的は、価格とMACDインジケーターの間に発生するダイバージェンスを検出 し、将来の価格の動きを示す
優れたテクニカルインジケーター「Grabber」をご紹介します。これは、すぐに使える「オールインワン」トレーディング戦略として機能します。 ひとつのコードに、市場のテクニカル分析ツール、取引シグナル(矢印)、アラート機能、プッシュ通知が強力に統合されています。 このインジケーターを購入された方には、以下の特典を無料で提供します: Grabberユーティリティ:オープンポジションを自動で管理するツール ステップバイステップのビデオマニュアル:インジケーターのインストール、設定、取引方法を解説 カスタムセットファイル:インジケーターをすばやく自動設定し、最大限の成果を出すための設定ファイル 他の戦略はもう忘れてください!Grabberだけが、あなたを新たなトレードの高みへと導いてくれるのです。 Grabber戦略の主な特徴: 推奨タイムフレーム:M5〜H4 対応通貨ペア・資産:どれでも使用可能ですが、私が実際に検証した以下を推奨します(GBPUSD、GBPCAD、GBPCHF、AUDCAD、AUDUSD、AUDSGD、AUDCHF、NZDUSD、NZDCAD、EURCAD、EURUSD、E
SignalTech MT5 is a trading system for EURUSD, USDCHF, USDJPY, AUDUSD, NZDUSD, EURJPY, AUDJPY, NZDJPY, CADJPY H2 and H3 Timeframe.  It can generate signals with Buy/Sell Arrows and Pop-Up/Sound Alerts. Each signal has clear Entry and Stop Loss levels, which should be automatically flagged on the chart, as well as potential Targets 1, 2, and 3. The Entry and TP levels are fixed after the trade is taken. The exit level is dynamic. If there are signs of a potential short-term trend reversal, the
ご紹介     Quantum Breakout PRO は 、ブレイクアウト ゾーンの取引方法を変革する画期的な MQL5 インジケーターです。 13年以上の取引経験を持つ経験豊富なトレーダーのチームによって開発されました。     クォンタム ブレイクアウト プロ   は、革新的でダイナミックなブレイクアウト ゾーン戦略により、あなたのトレーディングの旅を新たな高みに押し上げるように設計されています。 クォンタム ブレイクアウト インジケーターは、5 つの利益ターゲット ゾーンを備えたブレイクアウト ゾーン上のシグナル矢印と、ブレイクアウト ボックスに基づいたストップロスの提案を提供します。 初心者トレーダーにもプロのトレーダーにも適しています。 量子EAチャネル:       ここをクリック 重要!購入後、インストールマニュアルを受け取るためにプライベートメッセージを送ってください。 推奨事項: 時間枠: M15 通貨ペア: GBPJPY、EURJPY、USDJPY、NZDUSD、XAUUSD アカウントの種類: ECN、Raw、またはスプレッドが非常に低い R
これはMT5のインジケーターで、再描画なしで取引に参入するための正確なシグナルを提供します。 外国為替、暗号通貨、金属、株式、インデックスなど、あらゆる金融資産に適用できます。かなり正確な見積もりを提供し、取引を開始して終了するのに最適な時期を教えてくれます。1つのシグナルを処理しただけでインジケーターの元が取れた例の 動画 (6:22)をご覧ください。Entry PointsPro インジケーターの助けを借りたほとんどのトレーダーの最初の1週間の結果が改善しています。 Telegramグループ に登録してください。Entry Points Proインジケーターのメリットは次の通りです。 再描画のないエントリーシグナル 再描画されるインジケーターでは一度表示されたシグナルが削除されて大きな金銭的損失につながることがありますが、これと異なり、表示されて確認されたシグナルは消えることがありません。 エラーなしの取引開始 インジケーターアルゴリズムによって取引を開始する(資産を売買する)理想的な瞬間を見つけることができます。それを使用するすべてのトレーダーの成功率が向上します。 あら
Quantum TrendPulse を ご紹介します。これは、   SuperTrend   、   RSI   、および Stochastic のパワーを 1 つの包括的なインジケーターに組み合わせて、取引の可能性を最大限に引き出す究極の取引ツールです。精度と効率を求めるトレーダー向けに設計されたこのインジケーターは、市場のトレンド、勢いの変化、最適なエントリー ポイントとエグジット ポイントを自信を持って特定するのに役立ちます。 主な特徴: SuperTrend 統合: 現在の市場動向に簡単に追従し、収益性の波に乗ることができます。 RSI精度: 買われすぎと売られすぎのレベルを検出し、市場の反転のタイミングに最適で、SuperTrendのフィルターとして使用されます。 確率的精度: 確率的振動を活用して、変動の激しい市場で隠れたチャンスを見つけます。SuperTrend のフィルターとして使用されます。 マルチタイムフレーム分析:   M5 から H1 または H4 まで、さまざまなタイムフレームで市場を常に把握します。 カスタマイズ可能なアラート: カスタム取引条件が満たされ
Azimuth Pro
Ottaviano De Cicco
5 (7)
Azimuth Pro V2:MT5向けシンセティック・フラクタル構造分析と確認済みエントリー 概要 Azimuth Pro は Merkava Labs によるマルチレベルスイング構造インジケーターです。4つのネストされたスイングレイヤー、スイングアンカーVWAP、ABCパターン検出、3タイムフレーム構造フィルタリング、そして確定バーでの確認済みエントリー — 1つのチャートで、ミクロスイングからマクロサイクルまでを網羅するワークフロー。 これはブラインドシグナル製品ではありません。ロケーション、コンテキスト、タイミングを重視するトレーダーのための構造ファーストワークフローです。 V2発売記念オファー — Azimuth Pro V2をUSD 399で(次の100本)。最終価格:USD 499。 1. V2での変更点 シンセティック・マルチタイムフレームエンジン 上位タイムフレーム分析をMeridian Proと同じ独自のシンセティックアーキテクチャで一から再構築。よりクリーンなHTFコンテキスト、安定したライブ動作、従来のMTF同期問題なし。シンセティックエンジンは 固定比率タ
マーケットメーカーのためのツール。 Meravith は次の機能を提供します: すべての時間足を分析し、現在有効なトレンドを表示します。 強気と弱気の出来高が等しくなる流動性ゾーン(出来高均衡)を強調表示します。 異なる時間足のすべての流動性レベルをチャート上に直接表示します。 テキスト形式の市場分析を生成し、参考情報として表示します。 現在のトレンドに基づいて目標値、サポートレベル、ストップロスを計算します。 取引のリスクリワード比を算出します。 口座残高に基づいてポジションサイズを計算し、潜在的な利益を推定します。 また、市場に大きな変化があった場合には警告を表示します。 インジケーターの主要ライン: 強気/弱気の出来高エグゾーストライン ― 目標値として機能します。 市場のトレンドを示すライン。市場が強気か弱気かによって色が変わり、トレンドのサポートとして機能します。主にその色が市場センチメントを示します。 出来高均衡ライン(Eq)。Eq(Volume Equilibrium)ラインはシステムの中核です。これは買い手と売り手の出来高のバランスポイントを表します。市場の流動性を示し
BTMM State Engine Pro is a MetaTrader 5 indicator for traders who use the Beat The Market Maker approach: Asian session context, kill zone timing, level progression, peak formation detection, and a multi-pair scanner from a single chart. It combines cycle state logic with a built-in scanner dashboard so you do not need the same tool on many charts at once. What it does Draws the Asian session range; session times can follow broker server offset or be set in inputs. Tracks level progression (L
OmniSync Projection
Antonio-alin Teculescu
5 (1)
Chronos Fractal Engine is an innovative price projection indicator for MetaTrader 5, designed to transform your technical analysis by intelligently identifying and projecting historical price patterns. Built upon an advanced correlation algorithm and the fractal principles of the market, this powerful tool visualizes potential future price movements, giving you a unique edge in your trading decisions. What is Chronos Fractal Engine? At its core, the Chronos Fractal Engine employs a sophisticat
RelicusRoad Pro: 定量的市場オペレーティングシステム 【期間限定】無制限アクセス 70% OFF - 2,000人超のトレーダーと共に なぜ多くのトレーダーは「完璧な」インジケーターを使っても失敗するのでしょうか? それは、文脈を無視して 単一の概念 だけでトレードしているからです。文脈のないシグナルは単なるギャンブルです。勝ち続けるには、 根拠の重なり(コンフルエンス) が必要です。 RelicusRoad Proは単なる矢印インジケーターではありません。完全な 定量的市場エコシステム です。独自のボラティリティモデリングを用いて、価格が推移する「適正価値の道(Fair Value Road)」をマッピングし、ノイズと真の構造的ブレイクを判別します。 推測はやめましょう。機関投資家レベルの「ロード・ロジック」でトレードを。 コアエンジン:「Road」アルゴリズム システムの中心となる Road Algo は、市場環境にリアルタイムで適応するダイナミックなボラティリティチャネルです。 安全ライン(平衡点) と、価格が数学的に反転しやすい 拡張レベル を投影します。 Si
Bill Williams Advanced is designed for automatic chart analysis using Bill Williams' "Profitunity" system. The indicator analyzes four timeframes at once. Manual (Be sure to read before purchasing) Advantages 1. Analyzes the chart using Bill Williams' "Profitunity" system. Signals are displayed in a table in the corner of the screen and on the price chart. 2. Finds all known AO and AC signals, as well as zone signals. Equipped with a trend filter based on the Alligator. 3. Finds "Divergence Bar
ARICoin is a powerful trading companion designed to generate high-probability entry signals with dynamic TP/SL/DP levels based on volatility. Built-in performance tracking shows win/loss stats, PP1/PP2 hits, and success rates all updated live. Key Features: Buy/Sell signals with adaptive volatility bands Real-time TP/SL/DP levels based on ATR Built-in MA Filter with optional ATR/StdDev volatility Performance stats panel (Success, Profit/Loss, PP1/PP2) Alerts via popup, sound, push, or email Cust
Gannスクエアインジケーターは、W.D. Gannによって執筆された「市場予測のための数学的な式」の記事に基づく強力な市場分析ツールです。このツールは、解析に数学的な概念を応用し、Gann理論に基づいています。それは、144、90、52のスクエアや9のスクエアなど、Gannの関連テクニックの要素を取り入れています。さらに、の方法を組み込んでおり、9のスクエアとその関連性についてのチャネルやスターパターンに焦点を当てています。 ユーザーマニュアルと使用方法: このインジケーターを使用する前に、ユーザーマニュアルを読んで疑問点を解決するためにお問い合わせいただくことをお勧めします。ユーザーマニュアルの完全版は、当社のウェブサイトで入手できます。 MT5の完全版は購入できますし、MT4の無料版も試すことができます。両方のバージョンへのリンクを提供していますので、ご利用ください。 主な機能と機能: Gannスクエアインジケーターは、市場分析のための完全なツールセットを提供し、幾何学的な概念とGann理論に基づいて的確な判断を行う手助けをします。以下に主な機能を示します。 9のスクエアの分析:
Cvd Divergence
Thalles Nascimento De Carvalho
CVD Divergence ― オーダーフローとダイバージェンスのプロフェッショナル分析 CVD Divergence は、価格と Cumulative Delta Volume(CVD)との間に発生する信頼性の高いダイバージェンスを検出するために開発されたテクニカル指標です。実際の注文フローが価格の動きを確認していない局面を正確に捉え、反転、勢いの減衰、そして機関投資家による操作の可能性を示します。 このインジケーターは、アグレッシブボリュームの読み取りと価格構造の分析を組み合わせ、明確で客観的かつ先行性のあるシグナルを提供します。 インジケーターの機能 CVD Divergence は、累積デルタボリュームを用いて注文フローの方向と価格の方向を比較します。両者が大きく乖離した際、チャート上にマーカーを表示し、ダイバージェンスの方向を視覚的に示します。 検出できる内容: 強気ダイバージェンス(価格が下落しているが CVD が上昇している場合) 弱気ダイバージェンス(価格が上昇しているが CVD が下降している場合) 買い手・売り手の勢いの枯渇 機関投資家の不均衡によるフェイクムーブ
「 Dynamic Scalper System MT5 」インジケーターは、トレンド波の中でスキャルピング取引を行う手法のために設計されています。 主要通貨ペアと金でテスト済みで、他の取引商品との互換性があります。 トレンドに沿った短期的なポジションオープンのシグナルを提供し、追加の価格変動サポートも提供します。 インジケーターの原理 大きな矢印はトレンドの方向を決定します。 トレンド波の中では、小さな矢印の形でスキャルピングシグナルを生成するアルゴリズムが機能します。 赤い矢印は強気方向、青い矢印は弱気方向です。 トレンドの方向には敏感な価格変動ラインが描かれ、小さな矢印のシグナルと連動します。 シグナルは次のように機能します。適切なタイミングでラインが現れるとエントリーシグナルが形成され、ラインが開いている間はポジションが保持され、完了すると取引が終了します。 推奨される動作時間枠はM1~H4です。 矢印は現在のローソク足に形成され、次のローソク足が開いている場合は、前のローソク足の矢印は再描画されません。 入力パラメータ Trend Wave Period - トレ
Presenting one-of-a-kind Gann Indicator for XAUUSD IQ Gold Gann Levels is a non-repainting, precision tool designed exclusively for XAUUSD/Gold intraday trading. It uses W.D. Gann’s square root method to plot real-time support and resistance levels, helping traders spot high-probability entries with confidence and clarity. William Delbert Gann (W.D. Gann) was an exceptional market analyst whose trading technique was based on a complex blend of mathematics, geometry, astrology, and ancient calcul
Berma Bands
Muhammad Elbermawi
5 (8)
Berma Bands (BBs) インジケーターは、市場のトレンドを特定して活用したいトレーダーにとって貴重なツールです。価格と BBs の関係を分析することで、トレーダーは市場がトレンド段階にあるか、レンジ段階にあるかを判断できます。 詳細については、[ Berma Home Blog ] をご覧ください。 バーマ バンドは、上部バーマ バンド、中部バーマ バンド、下部バーマ バンドの 3 つの異なる線で構成されています。これらの線は価格の周りにプロットされ、全体的な傾向に対する価格の動きを視覚的に表します。これらのバンド間の距離から、ボラティリティや潜在的な傾向の反転についての洞察を得ることができます。 バーマ バンドの線がそれぞれ離れると、市場が横ばいまたはレンジ相場の期間に入っていることを示すことがよくあります。これは、明確な方向性の偏りがないことを示しています。トレーダーは、これらの期間中にトレンドを特定するのが難しいと感じる可能性があり、より明確なトレンドが出現するまで待つ場合があります。 バーマ バンドの線が 1 本の線に収束すると、強いトレンド環境の兆候となること
まず第一に、この取引ツールはノンリペイント、ノンリドロー、ノンラグの指標であり、プロの取引に理想的ですことを強調する価値があります。 オンラインコース、ユーザーマニュアル、デモ。 スマートプライスアクションコンセプトインジケーターは、新米から経験豊富なトレーダーまで、非常 に強力なツールです。Inner Circle Trader AnalysisやSmart Money Concepts Trading Strategiesなど、20以上の有用な指標を1つに組み合わせています。このインジケーターはスマートマネーコンセプトに焦点を当て、大手機関の取引方法を提供し、彼らの動きを予測するのに役立ちます。 特に、流動性分析に優れており、機関がどのように取引しているかを理解しやすくしています。市場のトレンドを予測し、価格の動きを慎重に分析するのに優れています。機関の戦略とトレードを合わせることで、市場の動向についてより正確な予測ができます。このインジケーターは多目的であり、市場構造を分析し、重要な注文ブロックを特定し、さまざまなパターンを認識するのに優れています。 このインジケーター
CGE Trading Suite
Carl Gustav Johan Ekstrom
5 (2)
Institutional-Grade Analytics for MT5 C GE Trading Suite delivers the analytical edge typically reserved for professional trading desks. The platform integrates a full suite of analytical tools into one seamless workflow: dynamic grid mapping, liquidity behavior analysis, ECM, trend lines, MIDAS, trade cycles, and directional channel projections. Together, these provide a unified view of market structure and momentum. Directional clarity is further enhanced by the capital flow index, which meas
Route Lines Prices MT5  - は、潜在的な取引シグナルを見つけるために設計されたインジケーターです。シンプルなインターフェースには、複数の価格変動アルゴリズムに加え、シグナル終点の検出と完了した軌跡の計算機能が搭載されています。アルゴリズムには、使用する時間枠に基づいたボラティリティと価格平滑化の計算が含まれています。 このインジケーターには、値を変更するための主要なパラメーター「 Calculating price values 」があります。デフォルト値の1は、バランスの取れた自動計算形式を提供し、インジケーターを手動で設定することなく使用できます。 2から500までの値を手動で変更することで、独自の取引システムに合わせてインジケーターをカスタマイズできます。 このインジケーターには、2本の移動平均線(高速移動平均線と低速移動平均線)の交点で表される市場方向インジケーターが組み込まれており、独自のトレンドを判断する際には無効にすることができます。 このインジケーターは、M1からH4の時間枠での使用を推奨します。あらゆる取引銘柄で使用できます。 シグナル
AriX
Temirlan Kdyrkhan
1 (4)
AriX Indicator for MT5 A powerful trend-following and signal-evaluation tool AriX is a custom MT5 indicator that combines Moving Averages and ATR-based risk/reward logic to generate clear buy/sell signals. It visualizes dynamic SL/TP levels, evaluates past trade outcomes, and displays win/loss statistics in a clean on-chart panel. Key features include: Buy/Sell signals based on MA crossovers ATR-based SL/TP1/TP2/TP3 levels with visual lines and labels Signal outcome tracking with real-time stat
多くの矢印インジケーターは、シグナルだけを表示して、その後の判断をすべてトレーダーに任せてしまいます。KT Alpha Hunter Arrows は、完整なトレードプランをチャート上に提示します。 各シグナル矢印が表示されるたびに、エントリーライン、ストップロス、4つのテイクプロフィット水準、そして現在の銘柄と時間足が今トレードに値するかどうかを示すリアルタイムのエッジ判定が、すでに描画された状態で表示されます。付属の Trade Manager EA は、あなたが手動でエントリーした後の実行管理を担当し、相場が荒れて判断がぶれやすい場面でも規律あるトレードを保ちやすくします。リペイントなし。確定足シグナルのみ。Forex、ゴールド、指数、その他あなたが取引するあらゆる銘柄に対応します。 主な機能 リペイントしない買い矢印と売り矢印を、足の確定後にのみ表示。 各シグナルに、エントリーライン、構造的ストップロス、4つのテイクプロフィット水準を表示。 Edge Dashboard が、現在のチャートで買いセットアップと売りセットアップを別々に評価。 判定システム:No Edge、Mar
Stop guessing the market. Start trading mathematical probabilities with Machine Learning. The Titan NPC Pro (Neural Probability Channel) is not just another moving average or standard deviation band. It is a highly advanced institutional-grade indicator powered by a Kernel Regression Engine . By utilizing a Rational Quadratic Kernel function, the algorithm calculates the true "Fair Value" of the asset and plots dynamic probability boundaries to pinpoint exact Mean Reversion (Overbought/Oversold)
ICT PO3 (Power of 3) AMD Protocol Framework Indicator True Time & Structure Integration   |  Non-Repainting | Real-Time  | Multi-Asset  | MT4 Version Available Full Setup Guide & Strategy Playbook: https://www.mql5.com/en/blogs/post/768683 MT4 Version: https://www.mql5.com/en/market/product/171742 Indicator Overview The ICT PO3 AMD Protocol Framework is a complete structural overlay for MetaTrader 5 that maps the True Daily Cycle directly onto your lower-timeframe execution chart. It projects
Ultimate SMC Indicator
Hicham Mahmoud Almoustafa
1 (1)
Ultimate SMC Indicator v2.20 — Smart Money Concepts All-in-One Stop switching between 5 different indicators. Ultimate SMC gives you everything Smart Money traders need — in one clean indicator with interactive controls. GUIDE What makes this different? Most SMC indicators show you Order Blocks or FVGs separately. You still have to figure out which zones actually matter. Ultimate SMC does the hard work: it scans for Order Blocks, Fair Value Gaps, Liquidity Sweeps, Supply & Demand zones, Fibo
TPA True Price Action indicator reveals the true price action of the market makers through 100% non-repainting signals strictly at the close of a candle! TPA shows entries and re-entries, every time the bulls are definitely stronger than the bears and vice versa. Not to confuse with red/green candles. The shift of power gets confirmed at the earliest stage and is ONE exit strategy of several. There are available now two free parts of the TPA User Guide for our customers. The first "The Basics"
Current event:  https://c.mql5.com/1/326/A2SR2025_NoMusic.gif MT5向けA2SR インジケーター:自動実需給(S/R)。 + 取引商品。 Product description in English here. --   Guidance   : -- at   https://www.mql5.com/en/blogs/post/734748/page4#comment_16532516 -- and  https://www.mql5.com/en/users/yohana/blog 強力で信頼性が高く、時間を節約。よりスマートな取引判断を実現。 + EA互換オブジェクト。 主な利点 先行する実SRレベル(遅延やリペイントなし) 2014年以来、MT4で長年にわたり信頼性が実証されてきたA2SRが 、MetaTrader 5でも利用可能になりました。 価格がサポートレベルとレジスタンスレベルに到達する前に、実際のサポートレベルとレジスタンスレベルを特定できる、リペイントなしの先行インジケーターにより、トレー
ZIVA Signal Intelligence
Hassan Abdullah Hassan Al Balushi
ZIVA Signal Intelligence An Adaptive, Modular Market Intelligence System ZIVA Signal Intelligence is not positioned as a conventional trading indicator. It is a fully integrated, proprietary market intelligence system engineered to deliver structured, high-precision interpretation of price behavior within a controlled analytical environment. Developed through an independent architectural approach, ZIVA does not rely on, derive from, or replicate existing indicators. It represents a standalone
Kalman Adaptive Zones — 量的確率バンド 価格がどこへ向かうのかを推測するのはやめましょう。統計的に「どこにあるべきか」を理解しましょう。 Kalman Adaptive Zones(KAZ)は、価格の周囲にインテリジェントな確率バンドを描画するプロフェッショナルな量的インジケーターです。これらのバンドは市場環境に応じてリアルタイムで自動適応します。 Bollinger Bands や Keltner Channels のような固定された過去期間に依存する指標とは異なり、KAZは複数層の量的分析を組み合わせ、現在の市場の状態をより正確に反映するバンドを生成します。 仕組み KAZの中核は適応型フィルターであり、ノイズを除去しながらも実際の価格変動には敏感に反応しつつ、真の基礎価格を継続的に推定します。 この中心線の周囲に、確率ゾーンが構築されます。その幅は2つの要因によって同時に決定されます: 市場の不確実性 :フィルターの信頼区間が広いほどゾーンは拡大 レジームの不安定性 :単なるボラティリティではなく、その変化自体の大きさ その結果、市場とともに「呼吸する」バ
作者のその他のプロダクト
Introducing the trend indicator! Ready trading system. The principle of the indicator is to automatically determine the current state of the market when placed on a chart. The indicator analyzes market dynamics for pivot points. Shows the favorable moments of entering the market with stripes. Can be used as a channel indicator or level indicator! This indicator allows you to analyze historical data, and on their basis display instructions to the trader on further actions. To find out how to dete
The indicator monitors the market trend with very high reliability. Sharp price fluctuations, as well as noise around averaged prices, are ignored. All intersection points will be ideal points at which the direction of the trend changes. Signal points, places where color changes, can be used as points of potential market reversal. This development can be used both for long-term trading, and for piping on small periods. The indiuctor algorithm implements a kind of technical analysis based on the
This indicator will provide you with everything you need in order to overcome losses due to human emotions. The indicator determines the moments of a trend reversal and the direction of its movements. This development is equipped with the most modern, adaptable trading algorithms. The main secret of short-term trading is to have information on when to enter a deal. The indicator works great on all timeframes and informs the trader about the most successful moments of buying or selling a currency
It can be used as an independent trading system. It is based on the idea that some currency pairs follow one another. The indicator allows you to simultaneously display several other charts on the chart of one currency pair, which allows you to anticipate some movements and fairly accurately determine the beginning of trends. The principle of trading according to indicator signals is also simple: you need to sell a currency pair whose chart is higher, and buy the lower one.
This indicator gives signals about a trend change, shows successful signals. High probability of a successful trend, it can be used with an optimal risk to profit ratio. The indicator does not redraw and is not late; it can be used both for piping on small periods and for long-term trading. The indicator algorithm works using open prices, and you can work with a zero bar. It works on all currency pairs and on all timeframes.
This indicator will provide you with everything you need in order to overcome losses due to human emotions. The indicator determines the moments of a trend reversal and the direction of its movements. This development is equipped with the most modern, adaptable trading algorithms. The main secret of short-term trading is to have information on when to enter a deal. The indicator works great on all timeframes and informs the trader about the most successful moments of buying or selling a currency
The indicator ignores sharp fluctuations and market noise and tracks market trends with absolute reliability. It is suitable for trading on small timeframes and on large ones, it ignores sudden price spikes or price movement corrections due to the reduction of market noise around the average price value. For calculations, the indicator uses indicators: iLow, iHigh, iMA, iATR. Since the output signal relies on reliable indicators, it is also reliable. You can configure both a sound signal and se
Turbo Pro - Advisor uses a number of indicators to search for signals for entry. It works in fully automatic mode! Use default settings. Unlike alternative developments, this bot can simultaneously trade on both buy and sell. This is a significant advantage in real work because it makes it possible to achieve significantly better results due to increased capitalization. The bot works like a scalpel with sharp price movements, or uses series closures by averaging the overall position. Turbo Pro
This is a convenient tool if you are used to trading on a clean chart, but sometimes you need to look at this indicator. If you are not sure how to determine the inflection point of a trend and are concerned about how to draw trend lines, then this indicator is for you. From now on, you do not need to sit near the computer and analyze the price, use this indicator carefully.
This is a hybrid trend indicator, as it is based on the signals of elementary indicators and a special algorithm for analysis. The smart algorithm of the indicator determines the trend, filters out market noise and generates input signals. The indicator uses a color alarm: blue - when changing from descending to ascending, and red - on the contrary, to descending. You can use the indicator as the main indicator for determining the trend. The indicator can work both for entry points and as a filt
Special Volume - Volume indicator, in the Forex market volumes are peculiar (teak). Why is Forex not possible to track normal volumes? The fact is that it is an OTC market. Therefore, it is practically not realistic to calculate the volume of purchases and sales by one instrument. Many Forex traders completely abandon volume indicators in their work. But for those who want to use them, there are some interesting tools, and one of them is Special Volume. The Special Volume indicator shows the ave
Direction Trend indicator. Shows the direction of the current trend. Colors bars in red and blue. It works on all currency pairs and on all timeframes. Do not forget that the approach should be comprehensive, indicator signals require additional information to enter the market. The principle of the indicator is that when placed on a chart, it automatically determines the current state of the market, analyzes historical data, based on historical data.
This indicator is a professional indicator for Forex trading. Shows points for entering the market, points of potential market reversal. Uses one parameter for settings. Ready trading system. The indicator combines several progressive algorithms. Combined systems for analyzing historical data are projected onto lines in the form of straight lines connecting extremes. That is the pivot point of the market. These extremes or pivot points of the market can be used as line levels! Which is very conv
A trend indicator, and not the first view, is a regular indicator, but it can be used with an optimal risk coefficient. The principle of work is simple - the indicator shows the moments for entering the market with arrows, which is very easily perceived visually. It is recommended to use an oscillator with an additional indicator, for example, standard RSI. You need to respond to level 50. Or use some other confirmation system. The indicator can be used both for piping for small periods and f
Turbo Fix - the adviser uses a number of indicators to search for signals to enter. It works in fully automatic mode! Use default settings. Unlike alternative developments, this bot can simultaneously trade on both buy and sell. This is a significant advantage in real work because it makes it possible to achieve significantly better results due to increased capitalization. The bot works like a scalpel with sharp price movements, or uses series closures by averaging the overall position. Turbo F
The indicator shows the direction of the trend, signaling this using pivot points. It can be used with an optimal risk ratio. The arrows indicate favorable moments and directions for entering the market. Uses one parameter to adjust (adjust from 1 to 3). It works on all currency pairs and on all timeframes. The indicator can be used both for piping for small periods and for long-term trading. It works on all currency pairs and on all timeframes. When using, it is recommended to look at an addi
HighScalpel
Ivan Simonika
5 (1)
Introducing the HighScalpel scalping system. It is enough to optimize once, for example, per month. After that, he shows excellent results on the forward period (several times larger), which can be seen in the screenshots. Be attentive to the spread indicators of your broker! The higher the spread, the less often the market entries. If the spread is above 20 pips, then the number of inputs falls by two orders of magnitude. It is ideal to use a broker with a floating spread of 6 pips. Such bro
The Revers Line signals a change in the angle of the moving average, the LevelZero parameter sets the circle of the zero point, there are limits from -LevelZero to LevelZero including those that will be considered a zero point, this can be indicated in red on histograms.   Options:   LevelZero - zero point [-LevelZero, LevelZero];   Length - length of the moving average;   Start - the starting point for calculating the angle;   End - the end point for calculating the angle;   MetodMA - averagin
We present to you a fully automated Expert Advisor designed for trading major currency pairs. The bot uses a set of its own trading algorithms and has protection against crashes. Attention! The bot only works correctly when the spread is less than 6 pips! I ask you to weigh this fact, and if you do not have the appropriate conditions for trading, this bot will not work for you! The robot controls the volume of trading positions, slippage, spread, maintains and protects open orders, can work wit
A new trend determination algorithm has been developed for this indicator. The algorithm with acceptable accuracy generates input signals and output levels. Strategy for trend trading, filtering and all the necessary functions built into one tool! The principle of the indicator’s operation is to automatically determine the current state of the market when placing it on a chart, analyze historical data based on historical data and display instructions for further actions on the screen to the trad
This development is a scalping system. The bot shows excellent results, which can be seen in the screenshots. You can shamelessly start the protest and bot with such a rite, self-confidently chucking in yogo abilities. The bot can be tested on high currency pairs and high periods. In order to install the test tester so it is indicated on the screenshots, for correct test. You need to trade on timeframes M1-M15. An expert created to trade on any instrument. It is preferable to test the adviser w
Traders can use the Trends Histogram indicator to identify potential areas of profit taking in the next section of an uptrend or downtrend. So it is for direct entry into the market. The indicator is used in the same way as any of these indicators individually or in combination with other indicators. This indicator shows an uptrend and a downtrend (green histogram). Only one input parameter is available: Length. It affects the scale of indicator price coverage. Installed input parameters can
This development is a scalping system. The Forex Go bot shows excellent results, which can be seen in the screenshots. You can shamelessly start the protest and the bot with such a rite, self-confidently churning in your abilities. The bot can be tested on high currency pairs and high periods. In order to install the test tester so it is indicated on the screenshots, for correct test. You need to trade on timeframes M1-M15. Expert Advisor is designed to trade on any instrument. It is preferable
The work of the Stable Pulse bot is displayed in the form of several key mmoments, which can be seen in the screenshots. This development is a scalping system. You can download and test the bot for free this way by yourself making sure of its capabilities. The bot can be tested on different currency pairs and different periods. The main thing is to set the tester settings as shown in the screenshot, for correct testing. You need to trade on timeframes M1-M15. Expert Advisor is designed to trade
Universal scalper with averaged algorithm to exit the drawdown. The Protected Article advisor uses an author's scalping strategy. More than a year of work on a demo and on real accounts. The adviser will be a good assistant when scalping, trading on the news, as well as when opening many transactions on different currency pairs. It must be run on the chart of each pair that you want to trade. The parameters of the adviser are clear and easy to configure. Advisor Goal Scalping results in small
The Trend Agil e indicator tracks the market trend with very high reliability. Sharp price fluctuations, as well as noise around averaged prices, are ignored. All intersection points will be ideal points at which the direction of the trend changes. Signal points, places where color changes, can be used as points of potential market reversal. This development can be used both for long-term trading, and for piping on small periods. The indiuctor algorithm implements a variety of technical analysis
Balanced Bot - the adviser uses a number of indicators to search for signals for entry. It works in fully automatic mode! Use default settings. Unlike alternative developments, this bot can simultaneously trade on both buy and sell. This is a significant advantage in real work because it makes it possible to achieve significantly better results due to increased capitalization. The bot works like a scalpel with sharp price movements, or uses series closures by averaging the overall position. Tur
This indicator gives signals about a trend change, shows successful signals. High probability of a successful trend, it can be used with an optimal risk to profit ratio. The indicator does not redraw and does not lag, it can be used both for pipsing in small periods and for long-term trading. The indicator algorithm works using open prices, and you can work with a zero bar. It works on all currency pairs and on all timeframes.
Introducing the trend indicator! Ready trading system. The principle of the indicator is to automatically determine the current state of the market when placed on a chart. The indicator analyzes market dynamics for pivot points. Shows the favorable moments of entering the market in stripes. It can be used as a channel indicator or level indicator! This indicator allows you to analyze historical data, and on their basis display instructions to the trader on further actions. To find out how to det
Analyst Bot - the adviser uses many moving average indicators to search for signals to enter. Works in fully automatic mode! You do not need any settings, you can use the default settings. The bot passes the historical gap for the 19-year period from 2000 to 2019. Unlike alternative developments, this bot can simultaneously trade both on buy and on sell. That is, it has two independent systems of analysis. This is a significant advantage in real life because it gives the opportunity to achieve
フィルタ:
レビューなし
レビューに返信