MarketTrend
- インディケータ
-
Ivan Simonika
 List of the best products: https://www.mql5.com/ru/users/dragonivan/seller
e-mail: dragon.ivan.sym@gmail.com - バージョン: 1.0
- アクティベーション: 5
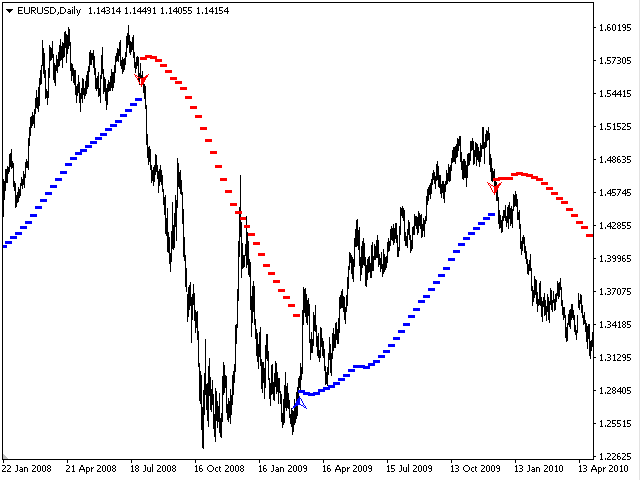
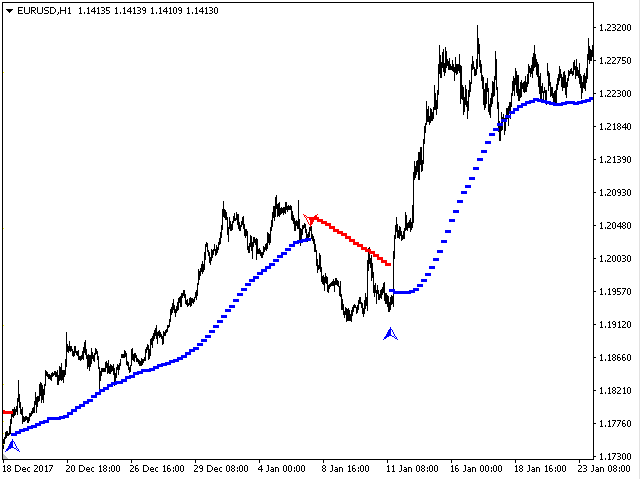
This indicator will provide you with everything you need in order to overcome losses due to human emotions. The indicator determines the moments
of a trend reversal and the direction of its movements. This development is equipped with the most modern, adaptable trading algorithms.
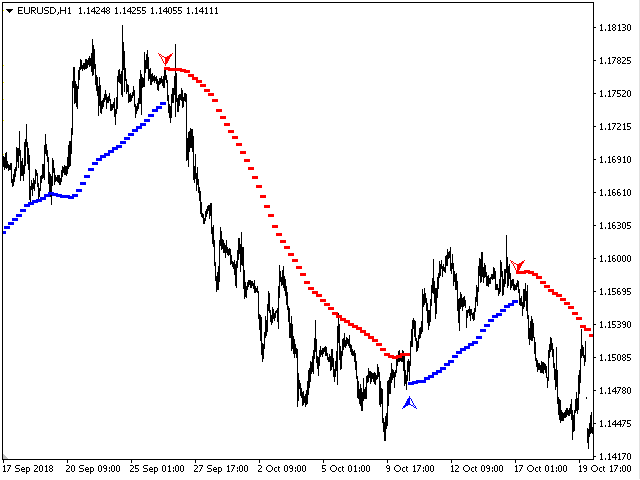
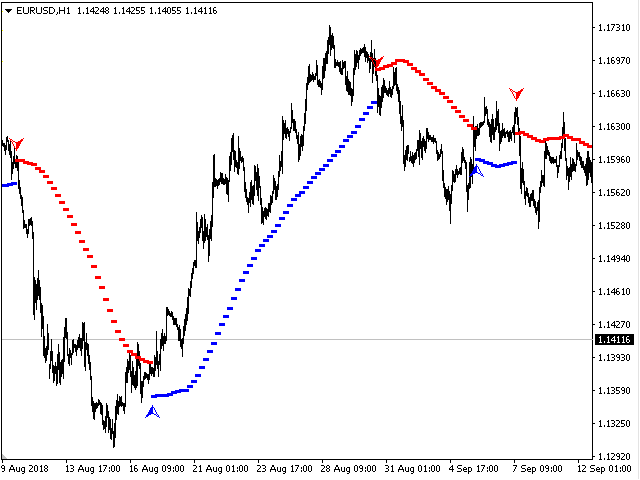
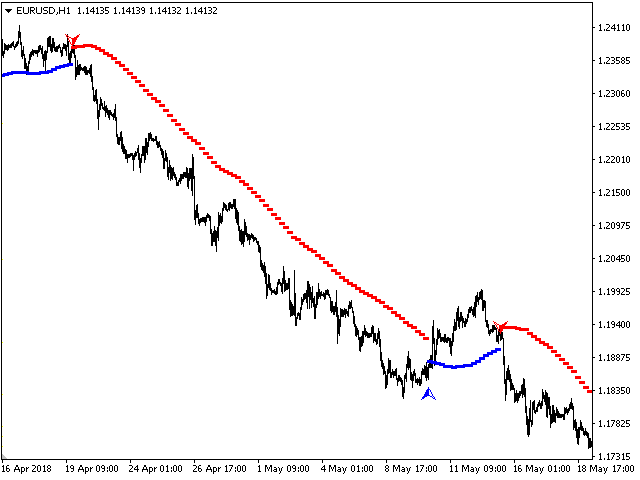
The main secret of short-term trading is to have information on when to enter a deal. The indicator works great on all timeframes and informs
the trader about the most successful moments of buying or selling a currency pair.