Enhanced Volume Profiles
- インディケータ
- バージョン: 1.0

Overview
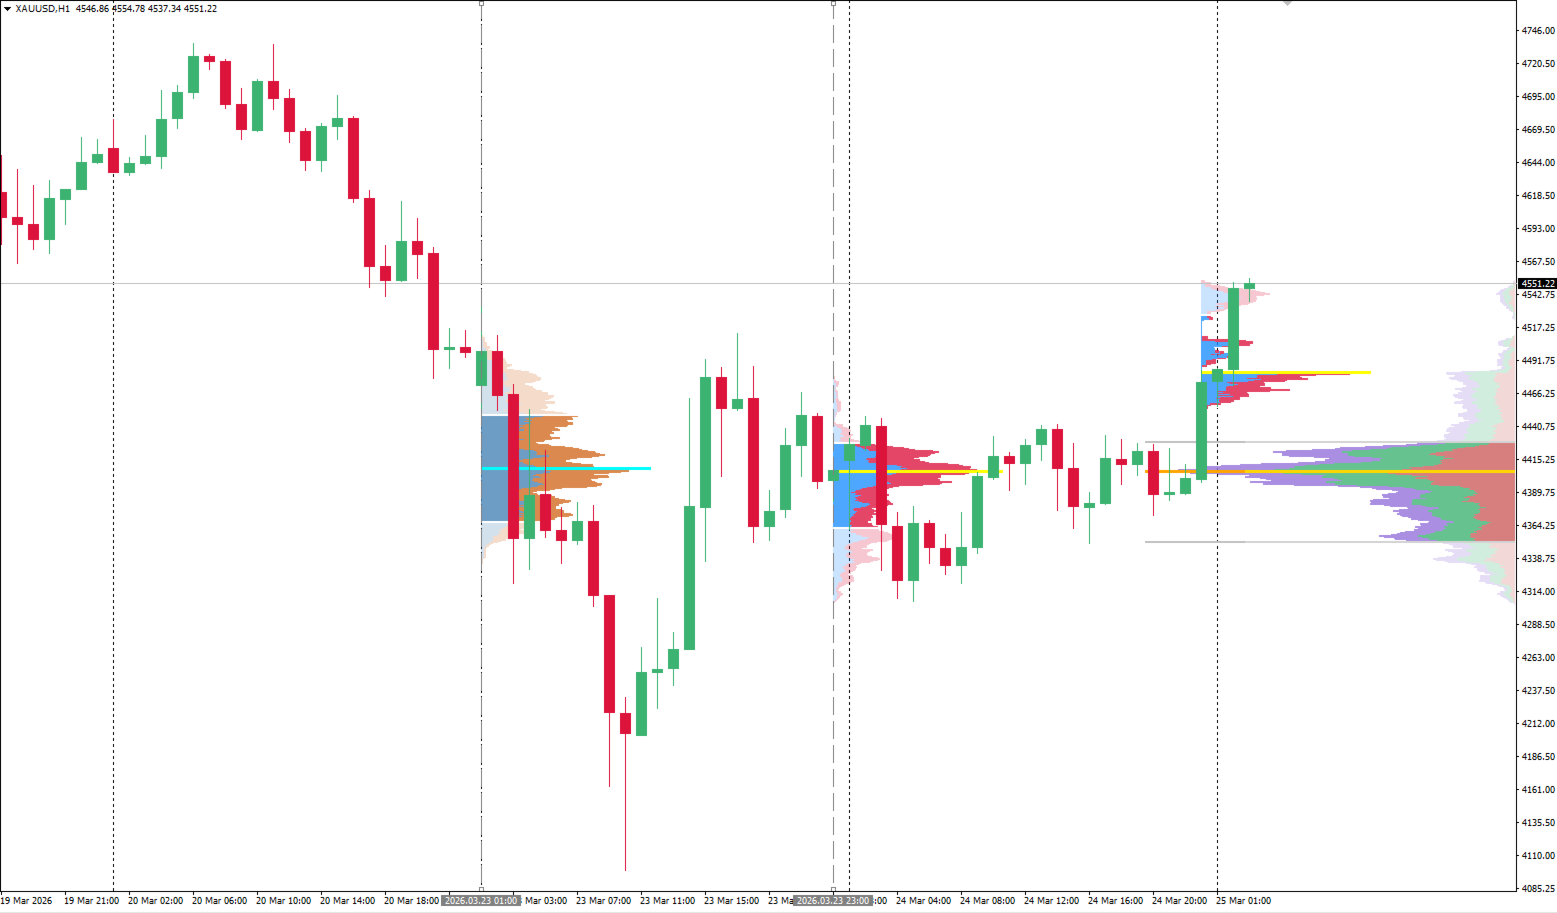
Enhanced Volume Profile is an indicator for MetaTrader 5 that displays the traded volume at specific price levels over a defined period. It separates the total volume into buy and sell components, presenting them as a side-by-side histogram on the chart. This allows users to observe the volume distribution and the proportion of buy and sell volumes at each price level.
Graphics Rendering
The indicator uses the CCanvas class to draw the histograms as a single bitmap image rather than creating multiple individual graphical objects. This method reduces the graphical load on the trading terminal, helping to maintain standard chart responsiveness even when several volume profiles are displayed at the same time. The indicator updates its calculations when a new one-minute bar forms.
Main Features
-
Buy and Sell Volume Separation: The indicator divides the volume at each price level into buy and sell volumes. These are displayed next to each other within the histogram for direct comparison.
-
Multiple Timeframe Profiles: Users can display volume profiles for daily, weekly, and monthly periods. The settings allow for the display of both the current and previous periods.
-
Market Session Profiles: The indicator can draw volume profiles for specific trading sessions, including Australia, Asia, Africa, Europe, and America. A time offset parameter is included to adjust the session times according to the specific broker's server time.
-
Profile Alignment: To manage chart space, the current weekly and monthly profiles are aligned to the right side of the chart window. Daily, session, and previous period profiles are aligned to the left at their respective starting times. Users can adjust the maximum width for each profile type independently to manage overlapping visuals.
-
Value Area and Point of Control: The indicator calculates the Point of Control (the price level with the highest traded volume) and the Value Area (the price range where a specified percentage of the total volume was traded, with a default setting of 70 percent). The histogram colors inside the Value Area are drawn as solid colors, while the colors outside the Value Area are drawn with transparency.
-
Custom Profile: Users can create a volume profile for a custom time range. By enabling this feature, two vertical lines appear on the chart. Users can drag and drop these lines to define the start and end points for the custom volume profile calculation.
Indicator Elements
-
Point of Control Line: A horizontal line indicating the price level with the highest volume concentration within the selected period.
-
Value Area Lines: Horizontal lines marking the upper (Value Area High) and lower (Value Area Low) boundaries of the specified volume percentage.
-
Stacked Histogram: The visual representation of the volume, with distinct colors for buy volume and sell volume.
Parameters
-
Ticks per Level: Defines the price step for each volume bin.
-
Max Profile Width: Sets the maximum width of the histogram in pixels.
-
Volume Type: Allows selection between Tick Volume and Real Volume.
-
Value Area Percent: Sets the percentage of volume to be included in the Value Area.
-
Broker Offset Hours: Adjusts the session start and end times based on the broker's time zone.
-
Color and Display Settings: Individual toggles and color inputs for daily, weekly, monthly, session, and custom profiles.


Mantap!!!