Complete Pending Orders N Grid System MT5

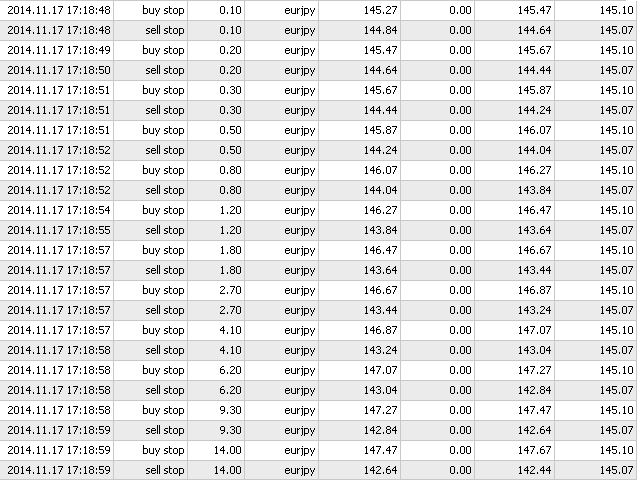
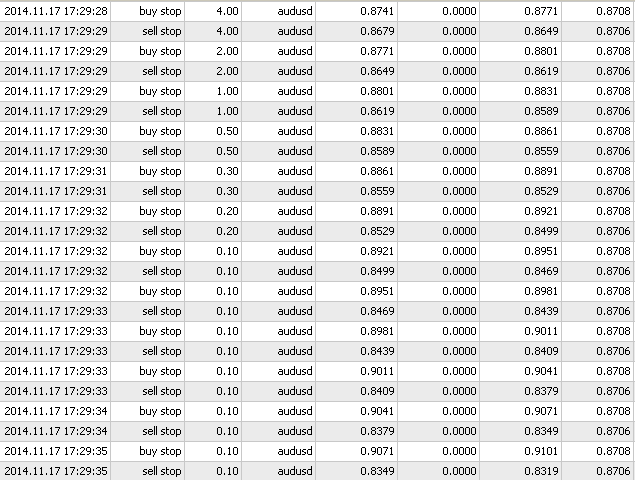
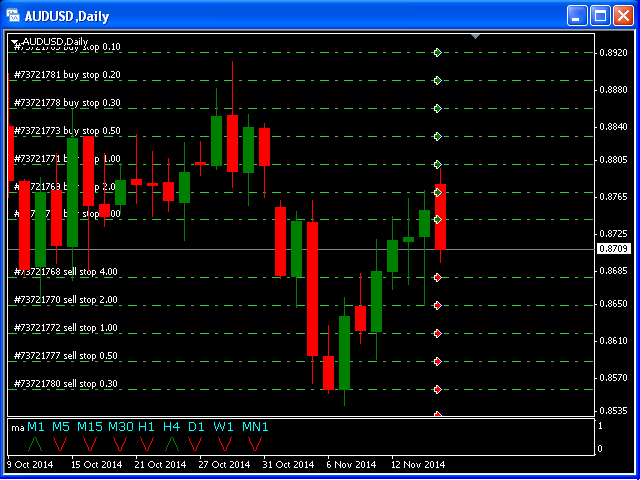
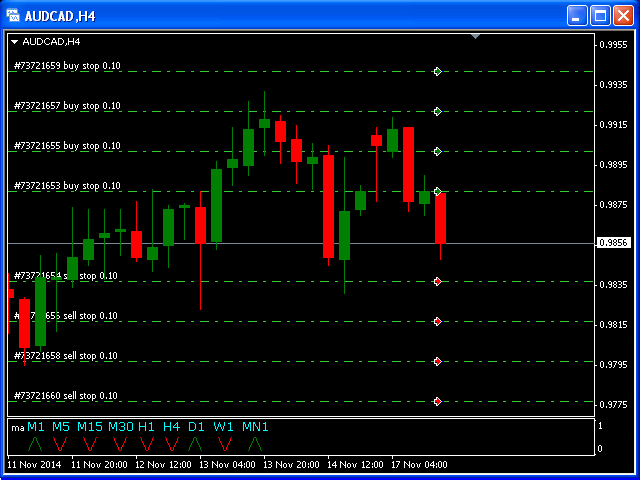
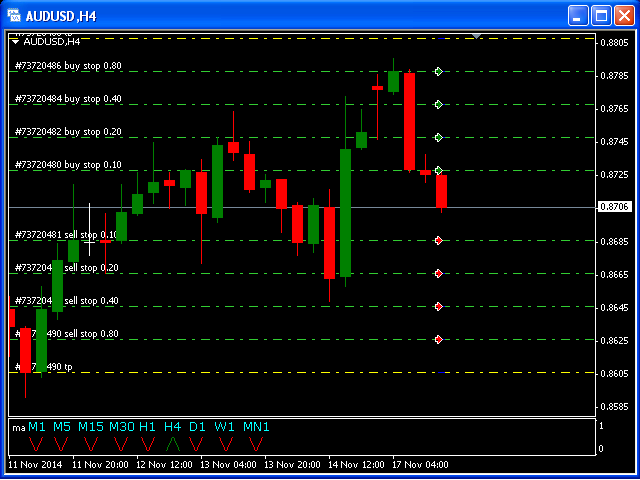
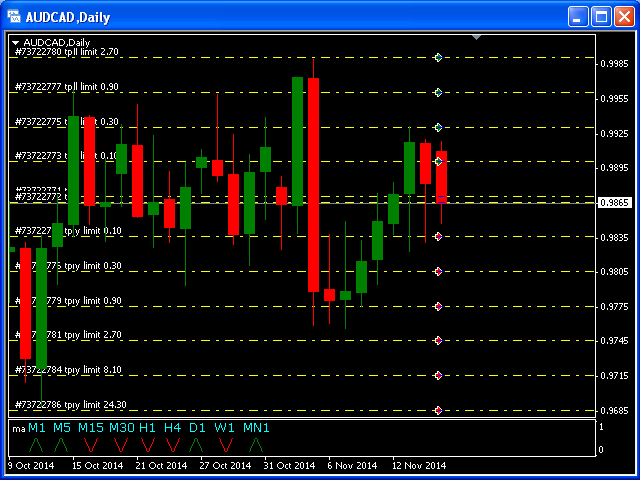
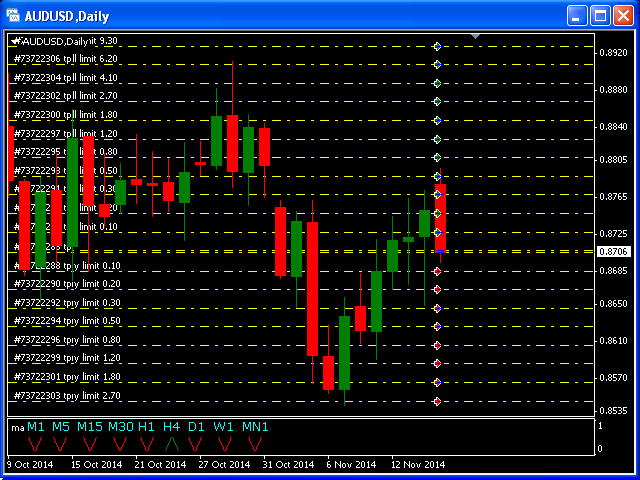
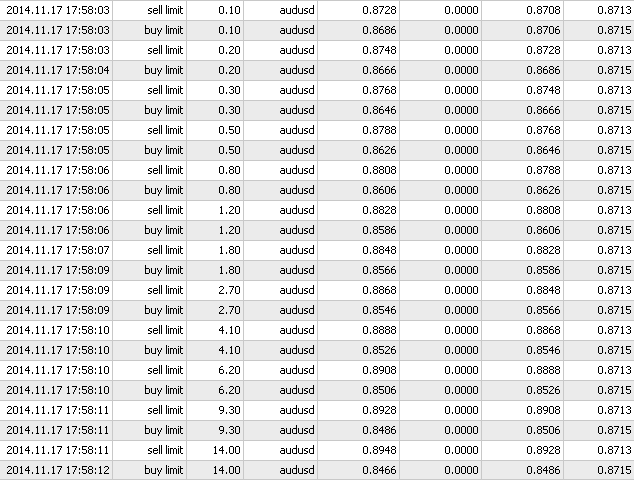
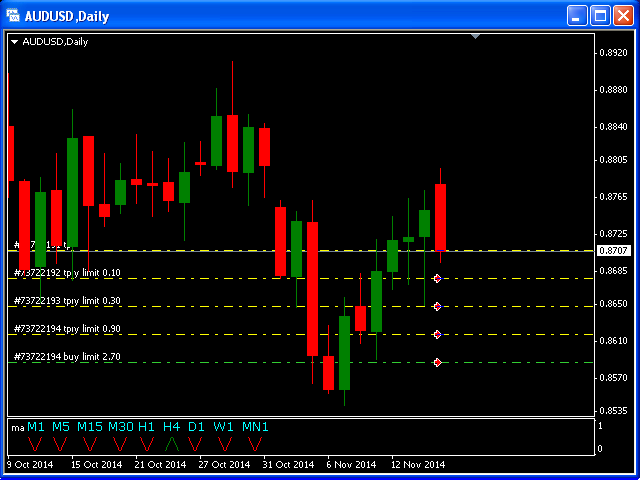
Complete Pending Orders Grid System opens any combinations of Buy Stop, Sell Stop, Buy Limit and Sell Limit pending orders and closes all existing pending orders. You just need to drop this script on the chart of a desired currency pair.

Before placing all pending orders, the input window is opened allowing you to modify all input parameters:

  • DeleteAllPendings – if 'true', then all pending orders (for current currency) are deleted.
  • BuyStop – if 'true', Buy Stop order is opened.
  • SellStop – if 'true', Sell Stop order is opened.
  • BuyLimit – if 'true', Buy Limit order is opened.
  • SellLimit – if 'true', Sell Limit order is opened.
  • InitLot – initial lot.
  • LotCoeff – if 1, all pending orders will have the same lot size.
  • InitStep – difference between two consecutive orders in points.
  • StepCoeff – step coefficient.
  • NumOfOrders – number of orders.
  • Slippage – allowed slippage.
  • MagicNum – magic number.

Attention:

  • If DeleteAllPendings=true, the script is able to delete existing pending orders for the current currency pair only.
  • You have to allow automated trading on the Expert Advisors tab (Tools->Options).
おすすめのプロダクト
SMT Trade Planner は、 MetaTrader 用のプロフェッショナルなチャート上リスク計算機・取引実行パネルです。リスク設定に基づいてロットサイズを計算し、チャート上で直接ドラッグ可能なエントリー、ストップロス、テイクプロフィットラインを表示し、設定可能なリスクルールに照らして取引を検証し、ワンクリックで取引を実行できます。   動作原理 Trade Plannerを任意のチャートにアタッチします。パネルにアカウント情報とリスク選択ボタンが表示されます。チャート上にエントリー価格(青)、ストップロス(赤)、テイクプロフィット(緑)の3本の水平線が表示されます。ラインをドラッグして取引設定を調整します。すべての計算がリアルタイムで更新されます。方向はSLの位置から自動検出されます。BUYまたはSELLをクリックして実行します。   パネルセクション アカウント:残高、証拠金維持率、余剰証拠金のリアルタイム表示。リスク設定:4つのクイック選択ボタン。取引計画:方向、エントリー価格、SLとTPのピップス距離。LINKモードでSL/TP比率を維持。ロットサイズ:リスク%に基づ
Telegram Broadcast MT5
Volodymyr Hrybachov
3.67 (3)
TELEGRAM BROADCASTユーティリティは、取引をTelegramチャネルに即座に公開するのに役立ちます。あなたが長い間FOREX信号であなた自身のテレグラムチャンネルを作りたいと思っていたなら、これはあなたが必要とするものです。 TELEGRAM BROADCASTはメッセージを送信できます: 取引の開始と終了。 保留中の注文の配置と削除。 ストップロスとテイクプロビジョニングの変更(ラストオーダー); 損失を止め、provをトリガーします。 保留中の注文のアクティブ化と削除: 取引レポートの送信; 入金と出金のメッセージを送信する。 ドローダウンまたは利益がN値に達したときにメッセージを送信します。 アカウントの監視-N分ごとに統計を送信します。 独自のテキストを追加して、各メッセージに分単位で遅延を投稿できます。すべてのメッセージは柔軟です。ユーティリティは1つのチャートにのみインストールされますが、すべてのシンボルからメッセージを送信します。設定で任意の記号を非表示にできます。 ユーティリティ構成: [サービス]-> [設定]-> [エキスパートアドバイザ
Is your trade at a loss? Does not matter ! You can use this Extra martingale tool.  In the set loss of your trade or your EA's trade , this tool will open another trade at a better price. It can also open multiple trades at different distances and with different lot sizes. Each trade will be assigned a TakeProfit. This tool has a lot of settings. You can set variable lot sizes, variable trade distances, variable TakeProfit sizes, maximum total profit or loss in money. You can also close trades
Strategy Manager is a  Multi-Time-Frame & Multi-Currency  Dashboard for  Metatrader 4 and 5. Thanks to a free, external graphical user interface, build your own strategy by combining any indicators and loading them into the dashboard to see the result ! In addition, you can precisely  set-up your Auto-trading & Notifications and use indicators for Stop-Loss, partial profit or limit. Filter your automatic trading & notifications with forex calendar and more. Open and Manage your orders directly w
This program is a GUI for issuing orders that can be done more quickly. Faster TP SL setting This program is not an automated trading platform. Trading is risky, please manage your risk. We do not accept any responsibility. It should be tried with Demo before using it with Real. Normally, the setting sets the risk to 1:1 to shift manually or to enter the risk to x:1, where x can be entered and everything can move freely. Thank you to all customers who have purchased our products. We would like t
このユーティリティは、ローソク足が手動で配置されたトレンドラインに触れたときに、より明確な未決注文であるかのように注文をオープンします。  これはどの資産にも使用でき、注文を開くとタッチしたラインが削除され、矢印が作成されます。この場合、これは価格反転操作に使用され、強気のローソク足がボトムアップラインに触れたときに売り注文をオープンし、弱気のローソク足がトップダウンラインに触れたときに買い注文をオープンします。  ストップロスとテイプロフィットを調整できます。このユーティリティは、価格が上昇および下降のサポートラインとレジスタンスライン(両方とも水平線など)に達したときに、注文を開いて画面を終了するようにプログラムできるため、非常に便利です。価格が上昇および下降のサポートラインとレジスタンスラインに達したときに、チャートパターンに非常に機能します。そして垂直。 最新のアップデートでは複数行を配置できるようになりました。 非常に重要: Meta trader 5 には取引履歴があり、注文がクローズされて線が引かれると、この線がロボットのロジックと混同され、不要な注文がオープンさ
FREE
Overview The Expert Advisor sends notifications to a mobile phone, via e-mail or plays a sound in case any changes are detected on the trading account: opening/closing positions, changing order or position parameters, balance or leverage. Also, the Expert Advisor can inform that Equity on the trading account has dropped below a specified value or Free Margin is small compared to Margin. The Expert Advisor does not trade, it only monitors your account. Launching the Expert Advisor You should all
One Click Breakeven Function: For multiple orders of the same currency but different order types (sell or buy), under the condition that the overall position is profitable, set the same stop-loss level or take-profit level. For example: there are currently 10 EURUSD orders, including 7 sell orders and 3 buy orders. When the overall position is profitable, if the overall take-profit for sell orders is set to 50 points: (1) When the total profit of the 7 sell orders is greater than the total loss
トレーダーの皆さん、こんにちは!私はあなたの取引アシスタントです。あまり話さないで、私の特技を教えてあげましょう: 1.私はあなたの持倉を管理するのが得意で、あなたがどの端で注文しても、私は最初にあなたに合理的な停止線と移動停止線を加えることができます。 2.私はあなたのために上昇や下落を回避し、原則を守れない人間的な弱点を根源から根絶することができます。 3.最適なポイントでモバイル端末のMT 5クライアントに通知メッセージを送信します。参考にしてください。もちろん、モバイルデバイス内のMetaTrader 5 APP内のMetaQuotes IDをMetaTrader 5クライアントに登録する必要があります-->オプション-->通知-->MetaQuotes IDの編集ボックスに登録し、オープン通知ポイントの決定をチェックしてください。 4.ポリシーテストでの手動シミュレーションのためのダッシュボード練習をよくサポートします。 5.追加のAI支援クライアントスーパーアシスタントプログラムを入手できるように連絡してください。 メモ:このプロジェクトでは、お客様が利益を得ることは約束
It is a utility that posts customized messages on Telegram based on account trading activity. Once the utility is on the chart, with each new position opened from the same chart symbol the utility is added, a customized message will be sent to the Telegram group defined in the input parameters. The utility will post to the Telegram group if a new position is opened and if it is the same symbol as the chart the utility is running on. If you are using an Expert Advisor for Buy and Sell and want to
Ticks Charting
Mativenga Geoffrey Mativenga
Tick Copier EA — Description & Usage Guide Instead of seeing the market like everybody else using time based charts, instead view the market using ticks like an x-ray. This Expert Advisor (EA) for MetaTrader 5 copies live ticks from the chart it is attached to and sends them to a custom symbol you already created (for example EURUSD TICKS ). Each time a new market tick arrives:  EA reads the current tick data from the source symbol. It copies the tick values: time bid price ask price last price
Pending Orders Grid Complete System   opens any combination of Buy Stop, Sell Stop, Buy Limit and Sell Limit pending orders and closes all existing pending orders. Only one time of the pending order at the same time!!! You will have a possibility to put a legitimate   Open Price   for the first position in the grid. Usually it should in the area of Support/Resistance lines. You just need to drop this script on the chart of a desired currency pair. Input Parameters Before placing all pending ord
BossFXTradePanelEA (MT5)  [First 10 copies sold at 50 USD price will increase to 99USD] BossFXTradePanelEA is a fully interactive trade management panel designed for MetaTrader 5, providing traders with an easy-to-use, one-click interface to execute and manage trades. This EA simplifies trade execution , risk management, and position control by combining market orders, stop loss, take profit, trailing stops, and breakeven functionalities into a single, intuitive panel.  Key features include: On
Overview Breakout Meter is a price action tool that identifies key breakout zones based on recent daily price activity. It highlights areas where momentum is likely to trigger, helping traders anticipate breakouts or reversals with minimal configuration. How It Works The EA analyzes a user-defined number of recent daily candles and marks high and low zones where price has shown strong reactions. It automatically updates levels with new data and removes outdated zones to keep charts clear. Users
Account Profit & Loss Killer Full Account-Level Intelligent Risk Management EA (MT5) ⸻ Product Introduction Account Profit & Loss Killer is a true "overall account control and risk management tool". It does not participate in any trading strategy; it focuses on only one thing: When the total floating profit or total floating loss of all positions in the account reaches your set amount, it immediately and within milliseconds forcibly closes all orders in the account. This is a true "
FREE
Trade Signal Pro (MT5) — Telegram Signal Provider (Utility) A lightweight utility that sends trade notifications from your MT5 account to Telegram. It does NOT open/close trades. It only reads positions/deals and sends messages. What it sends Entry signal (BUY/SELL) with Entry, SL, TP, pips + Risk:Reward   Updates when SL/TP is modified (reply/tag to the original signal)   Close notifications: TP hit / SL hit / Breakeven / Manual close   Optional Daily & Weekly performance summary (win
EA is parsing trade signals from Telegram bot and executes it in MT5 terminal. To configure you need to complete the following steps: Specify the bot tokein in input settings. Specify a list of key words used for detecting a type of signal (Buy/Sell), for entry price and for stops. Specify default settings for stops and lot size in case incoming signal don't include these details.
This utilities can constantly monitors and handle the equity/ balance account to prevent drawdowns and protect your account. This Utilities can handle manually order and automatically order by other Expert Advisors.  If the conditions are reached, the open position will be close/ all close (depending your setting). How to use : attach this utilities on new chart (same pair) you need to handle make sure magic number is same with other EA you need to handle entry magic number '0' if you need han
FlowAxis
Aysar Alafif
5 (1)
Product Overview   FlowAxis is a semi-automated Expert Advisor for Meta Trader 5 designed for traders who rely on manual trendline analysis and want precise, rule-based trade execution.   Instead of guessing market direction, the trader defines the trend visually, and FlowAxis executes trades automatically when price interacts with predefined trendlines. This approach       combines human market analysis with disciplined, rule-based execution. Important – Please Read Before Use   FlowAxis EA
1 つのチャートで完全な制御を実現。 各チャートのオブジェクト、色、設定を個別に管理する時間を無駄にする必要はありません。     チャート同期マネージャーを 使用すると、     すべてのMetaTraderチャートを同期、コピー、制御します   たった 1 つのパネルといくつかのショートカットを使用して、瞬時に実行できます。 一度描いたら、どこでも更新。チャートをワンクリックで開閉。ワークスペースを整理整頓。     シンボルベースのオブジェクト管理 。重要な詳細を見逃すことはありません。     スプレッド表示、カウントダウンタイマー、ローソク足クローズアラートなど。 時間を節約し、エラーを減らし、よりスマートに取引します。 Chart Sync Manager インストールと入力ガイド EA に関する通知を受け取りたい場合は、URL (   http://www.betasoft.dev   ) MT4/MT5 ターミナル (スクリーンショットを参照) を追加します。 MT4バージョン https://www.mql5.com/en/market/product/1484
Trade Control Panel Function Normal One Click Function Close All Close All Profit Close All Loss Close All Pending Order Close All Sell Close All Buy Advance One Click Function 1.  Close Partial Lot Sell by Percent It will help you partial close for all open position by desire percent you wanted. No longer partial close one by one for every open position Manual input for desire percent 2. Close Partial Lot Buy by Percent It will help you partial close for all open position by desire percent
MA crossing bot MT5
Matthieu Jean Baptiste Wambergue
4.63 (8)
特別オファー!$50(通常$90) MT4バージョンを こちら から入手! あなたの移動平均戦略を自動化しましょう! これは、私のベストセラー'MA crossing bot'のMT5バージョンであり、 こちら で入手できます。 "MA crossing bot"は、移動平均クロスオーバーの強力で実績ある戦略に頼るトレーダーのための究極のtradingアシスタントです。この多用途なbotは、2本の移動平均線がクロスするたびにアラートを出したり、自動的にポジションをオープンしたりするよう設計されており、精度高く重要な市場トレンドを捉えるのに役立ちます。経験豊富なトレーダーでも、自動売買システムに不慣れな方でも、MA crossing botを使えば、他の作業やtradingチャンスに集中しながら戦略を完全に自動化できます。 しかしこのEAは、単なるクロスオーバーアラートシステムにとどまりません。第3の移動平均の追加、RSI (Relative Strength Index) によるフィルター、さらにはピボットポイントの統合など、複数の高度なフィルターを備えています。これにより、単なるク
Close Assistant (CA)  is a full featured utility for monitoring and closing a set of positions placed by trader or EA. It closes filtered orders in specified time or level or candle patterns or when a certain profit or loss of the total positions is reached. CA uses Zero Profit Lock function to save deposit when total profit falls to zero. Profit and loss levels can be set in fixed amount of account currency or percentage of balance or equity or margin. CA only monitors and works on filtered pos
All Pending Orders with StopLoss opens any combination of Buy Stop, Sell Stop, Buy Limit and Sell Limit pending orders and closes all existing pending orders. If boolSL = true then this Script will calculate one common StopLoss value as the StopLoss for a first/last orders and put this value in all pending orders. Input Parameters Before placing all pending orders, the input window is opened allowing you to modify all input parameters: DeleteAllPendings : if true , then all pending orders (for
Trade Guardian Risk Manager is a MT5 utility Expert Advisor dedicated to risk control and equity protection. Many know how to trade. Few know when to stop. Trade Guardian formalizes discipline and mechanically enforces your limits when emotions or over-exposure take over. Risk management utility No trading logic — Does NOT open trades : does not open positions, does not provide signals, contains no strategy, and does not guarantee results. Operating principle — Equity Monitoring + rule enf
Trading panel for fast and convenient trading. The panel allows you to quickly open and close orders. Separate closing of orders for Sell and Buy positions. It is also possible to close all orders completely. The trading panel displays information about profit, total volume and number of orders for Sell and Buy positions. Sometimes some positions may not be closed due to market volatility. In this case, click close the position again.
MultiChart Pro
Pablo Filipe Soares De Almeida
MultiChart Pro – MetaTrader 5用の高機能チャート管理ツール MultiChart Pro は、MetaTrader 5 で複数のチャートを自動的に開き、設定するためのエキスパートアドバイザー(EA)です。トレーダーが異なる時間足のチャートを効率的に管理できるように設計されており、わずか数秒で分析環境を整えることができます。 このツールは、最大4つのチャート(例:D1、M1、M15、および10秒のオフラインチャート)を自動で開き、現在のチャート(例:M5)も設定します。トレード戦略に合わせて時間足を自由に選択できるため、マルチタイムフレーム分析を行うトレーダーに最適です。 主な機能: チャートの自動生成: 複数の時間足を同時に開き、手動操作を省きます。 テンプレートの自動適用: 各チャートに指定されたテンプレートを適用し、存在を確認してから読み込みます。 オフラインチャート対応: 10秒などのカスタム時間足を利用でき、スキャルピングなど短期取引にも活用可能です。 設定の柔軟性: 入力パラメータを通じてすべての設定を簡単に変更可能。 MultiChart Pro
Hello, Every one  A script to close all market positions and/or pending orders. ----------------------------------------------------------------------------------- This is Close All      market positions and/or pending orders button  You can close all orders in 1 second by one click  For advanced version:  Advanced:  https://www.mql5.com/en/market/product/77763           https://www.mql5.com/en/market/product/89311 Key:  1 Close all button: The script will close All orders market + pending
FREE
Short Description: The ultimate trading assistant. Open trades on ANY symbol with automatic lot size calculation based on your risk percentage. Fast, precise, and safe. Full Description: Stop guessing your lot size. Start trading like a professional. Risk Calculator Pro Panel is designed for traders who need speed and precision. Forget manual calculations or external spreadsheets. This utility allows you to execute trades directly from the chart while automatically managing your risk. Why y
ある MT5 または MT4 アカウントから別の MT5 アカウントに取引量をコピーするためのシンプルなユーティリティ。 ネッティング口座とヘッジ口座の間で任意の組み合わせでポジションをコピーできます。デフォルトでは、同じボリュームを持つすべての一致するシンボルによって開かれたポジションがコピーされます。シンボル名が異なる場合、またはコピーされたポジションのボリュームが異なる場合、またはすべてのポジションをコピーする必要がない場合は、この 投稿 で説明されている設定で目的の動作を指定できます。この製品は、将来のリリースで機能を拡張します。 バージョン 2.0 までは、この製品は無料です。 インストール順序: 送信者アカウントの端末で、Expert Advisor を送信者モードで起動します。 受信者アカウントのターミナルで、Expert Advisor を受信者モードで起動し 、以前に起動した送信者の 1 つを選択して、そこからポジション ボリュームをコピーします。
FREE
このプロダクトを購入した人は以下も購入しています
Trade Assistant MT5
Evgeniy Kravchenko
4.42 (208)
取引 ごとのリスクの 計算、新規注文 の 簡単 な 設置、部分的 な 決済機能 を 持 つ 注文管理、 7 種類 のトレーリングストップなど 、便利 な 機能 を 備 えています 。 追加の資料と説明書 インストール手順   -   アプリケーションの手順   -   デモアカウント用アプリケーションの試用版 ライン機能 チャート上にオープニングライン、ストップロス、テイクプロフィットを表示します。この機能により、新規注文を簡単に設定することができ、注文を出す前にその特徴を確認することができます。   リスク計算 リスク計算機能は、設定されたリスクとストップロス注文のサイズを考慮して、新規注文のボリュームを計算します。ストップロスの大きさを自由に設定できると同時に、設定したリスクを守ることができます。 Lot calc ボタン - リスク 計算 を 有効 / 無効 にします 。 Risk フィールドでは 、必要 なリスクの 値 を 0 から 100 までのパーセンテージまたは 預金通貨 で 設定 します 。 設定」 タブで 、 リスク 計算 の 種類 を 選択 します :「 $ 通
Trade Manager EAへようこそ。これは、取引をより直感的、正確、そして効率的にするために設計された究極の リスク管理ツール です。これは単なるオーダー実行ツールではなく、包括的な取引計画、ポジション管理、リスク管理のためのソリューションです。初心者から上級者、迅速な実行を必要とするスキャルパーまで、Trade Manager EAはあらゆるニーズに対応し、為替、指数、商品、暗号通貨などさまざまな市場で柔軟に対応します。 Trade Manager EAを使用すると、複雑な計算が過去のものになります。市場を分析し、エントリーポイント、ストップロス、テイクプロフィットのレベルをチャート上のラインでマークし、リスクを設定するだけで、Trade Managerが最適なポジションサイズを即座に計算し、SLとTPをピップ、ポイント、口座通貨でリアルタイムに表示します。すべての取引が簡単かつ効果的に管理されます。 主な機能: ポジションサイズ計算機 :定義されたリスクに基づいて取引サイズを瞬時に決定します。 簡単な取引計画 :エントリー、ストップロス、テイクプロフィットを設定するためのド
Local Trade Copier EA MT5
Juvenille Emperor Limited
4.96 (135)
Local Trade Copier EA MT5 による、驚くほど高速な取引コピーを体験してください。1分で簡単にセットアップできるこの取引コピー機は、同じWindowsコンピュータまたはWindows VPS上の複数のMetaTrader端末間で取引をコピーすることができ、0.5秒未満の高速コピースピードを実現します。 初心者であろうとプロのトレーダーであろうと、 Local Trade Copier EA MT5 には、あなたの特定のニーズに合わせてカスタマイズするための幅広いオプションが用意されています。これは、利益の可能性を高めたい人にとって究極のソリューションです。 今すぐ試してみて、これが市場で最も速くて簡単なトレードコピー機である理由を理解してください。 ヒント: デモアカウントで Local Trade Copier EA MT5 デモバージョンをダウンロードして試すことができます: ここ ダウンロードした無料のデモ ファイルを MT5 >> ファイル >> データ フォルダを開く >> MQL5 >> Experts フォルダに貼り付けて、ターミナルを再起動しま
TradePanel MT5
Alfiya Fazylova
4.87 (151)
Trade Panelは多機能なトレーディングアシスタントです。アプリには手動取引用の50以上のトレーディング機能が搭載されており、ほとんどの取引作業を自動化することができます。 ご注意ください!割引は期間限定で、毎週火曜日に価格が5ドルずつ上昇します(上限100ドルまで)。 購入前に、デモアカウントでアプリのデモ版をテストすることができます。デモアカウント用のアプリの試用版をダウンロードするには、次のリンクをご利用ください: https://www.mql5.com/en/blogs/post/750865 。 完全な手順 こちら 。 取引。 ワンクリックで取引操作を行うことができます: リスクを自動計算して指値注文やポジションを開く。 複数の注文やポジションをワンクリックで開く。 注文のグリッドを開く。 保留中の注文やポジションをグループごとに閉じる。 ポジションの方向を反転(Buyを閉じてSellを開く、またはSellを閉じてBuyを開く)。 ポジションをブロックする(不足している量のポジションを開くことでBuyとSellのポジション量を等しくする)。 すべてのポジションを部分的
Farmed Hedge Yield Farming | All Markets (Manual - Hybrid - Semi/Automated EA) MULTI-ASSET SUPPORT Trade any asset available on your broker - Forex: Major, Minor, Exotic pairs - Crypto: BTC, ETH, XRP, SOL, BNB - Stocks: Apple, Tesla, Amazon, Google, etc. - Commodities: Gold, Silver, Oil, Gas - Indices: US30, NAS100, SPX500, DAX40 - Any CFD your broker offers VERIFIED TRADING RESULTS - Farmed Hedge Yield Axi Copy:  https://www.mql5.com/en/signals/2356376 - Farmed Hedge Yield Exn Copy:   https:/
ベータリリース Telegram to MT5 Signal Trader はまもなく正式なアルファ版をリリースします。いくつかの機能はまだ開発中で、小さな不具合に遭遇する可能性があります。問題が発生した場合はぜひご報告ください。皆さまのフィードバックがソフトウェア改善に役立ちます。 Telegram to MT5 Signal Trader は、 Telegram のチャンネルやグループからの取引シグナルを自動的に MetaTrader 5 にコピーする強力なツールです。 パブリックおよびプライベートの両方のチャネルに対応し、複数のシグナル提供元を複数のMT5口座に接続可能です。ソフトウェアは高速で安定し、すべての取引を細かく制御できます。 インターフェースは直感的で、ダッシュボードとチャートは見やすく設計されており、リアルタイムで動作状況をモニターできます。 必要環境 MQL の制限により、EA は Telegram と通信するためのデスクトップアプリが必要です。 インストーラーは公式の インストールガイド にあります。 主な機能 マルチプロバイダー: 複数の Telegram
Tired of complex order placement and manual calculations? Trade Dashboard is your solution. With its user-friendly interface, placing orders becomes effortless, by a single click, you can open trades, set stop loss and take profit levels, manage trade lot size, and calculate risk to reward ratios, allowing you to only focus on your strategy. Say goodbye to manual calculations and streamline your trading experience with Trade Dashboard. Download  Demo Version  right now. You can find  Details of
Exp COPYLOT CLIENT for MT5
Vladislav Andruschenko
3.82 (34)
MetaTrader 5 用のプロフェッショナル取引コピー機 MetaTrader 向けの高速・高性能・信頼性の高い 取引コピー機 です。 COPYLOT は、MT4 と MT5 のターミナル間で Forex 取引をコピーでき、 Hedge 口座と Netting 口座の両方に対応しています。 COPYLOT MT5 版の対応構成: - MT5 Hedge → MT5 Hedge - MT5 Hedge → MT5 Netting - MT5 Netting → MT5 Hedge - MT5 Netting → MT5 Netting - MT4 → MT5 Hedge - MT4 → MT5 Netting MT4 版 完全な説明 + DEMO + PDF 購入方法 インストール方法 ログファイルの取得方法 テストと最適化の方法 Expforex のすべての製品 MT4 ターミナルへのコピーも可能です(MT4 → MT4、MT5 → MT4): COPYLOT CLIENT for MT4 COPYLOT は、2台、3台、さらには10台のターミナル間で同時に動作できる、プロフェッ
Footprint Chart Pro — Professional OrderFlow EA for MetaTrader 5 Version 6.34 | Professional tool for real traders | Institutional-Grade Visualization DEMO USERS - PLEASE SELECT EVERY TICK / REAL TICK WHEN TESTING AND YOU HAVE DOWNLOADED HISTORICAL DATA. IF YOU SEE A WAITING SCREEN AND IT IS NOT DOWNLOADING, IT MEANS YOU HAVE LOW HISTORICAL DATA. TRY 1 MIN AND 5 MIN FIRST ON 1 DAY DATA. ONE DAY DATA SHOULD BE THE NEWEST AND MOST CURRENT DATE. PLEASE WAIT UNTIL THE MARKET HAS ROLLED OVER PERIOD.
Copy Cat More Trade Copier MT5 (コピーキャット MT5) は、今日の取引課題に対応して設計されたローカルトレードコピーシステムと完全なリスク管理・実行フレームワークです。プロップファームのチャレンジから個人ポートフォリオ管理まで、堅牢な実行、資本保護、柔軟な設定、高度な取引処理の組み合わせで、あらゆる状況に適応します。 コピーシステムはマスター(送信側)とスレーブ(受信側)の両方のモードで動作し、成行注文と指値注文、取引修正、部分決済、両建て決済操作のリアルタイム同期を行います。デモ口座とライブ口座、取引ログインまたは投資家ログインの両方に対応し、EA、ターミナル、またはVPSが再起動してもパーシスタント取引メモリシステムを通じて復旧を保証します。複数のマスターとスレーブをユニークIDで同時に管理でき、ブローカー間の違いはプレフィックス/サフィックス調整またはカスタムシンボルマッピングを通じて自動的に処理されます。 マニュアル/設定  | Copy Cat More MT4 | チャンネル  特別機能: 設定が簡単 — わずか30秒で完了(ビデオをご覧
MT5 to Telegram Signal Provider は、Telegramのチャット、チャンネル、またはグループに 指定された シグナルを送信することができる、完全にカスタマイズ可能な簡単なユーティリティです。これにより、あなたのアカウントは シグナルプロバイダー になります。 競合する製品とは異なり、DLLのインポートは使用していません。 [ デモ ] [ マニュアル ] [ MT4版 ] [ Discord版 ] [ Telegramチャンネル ]  New: [ Telegram To MT5 ] セットアップ ステップバイステップの ユーザーガイド が利用可能です。 Telegram APIの知識は必要ありません。必要な全ては開発者から提供されます。 主な特長 購読者に送信する注文の詳細をカスタマイズする機能 例えば、Bronze、Silver、Goldといった階層型のサブスクリプションモデルを作成できます。Goldサブスクリプションでは、すべてのシグナルが提供されます。 id、シンボル、またはコメントによって注文をフィルターできます 注文が実行されたチャート
Ultimate Extractor - Professional Trading Analytics for MT5 *****this is the local HTML version of Ultimate Extractor. !!!!!it is not compatible with Cloud!!!! For the online version please reach out to me directly****** Ultimate Extractor transforms your MetaTrader 5 trading history into actionable insights with comprehensive analytics, interactive charts, and real-time performance tracking. What It Does Automatically analyzes your MT5 trading history across all Expert Advisors and generates
この製品は、ニュースタイム中にすべてのエキスパートアドバイザーと手動チャートをフィルタリングするため、急激な価格変動によるマニュアルトレードのセットアップの破壊や他のエキスパートアドバイザーによって入力された取引について心配する必要はありません。この製品には、ニュースのリリース前にオープンポジションとペンディングオーダーを処理できる完全な注文管理システムも付属しています。 The News Filter  を購入すると、将来のエキスパートアドバイザーのためにビルトインのニュースフィルターに頼る必要はなく、今後はすべてのエキスパートアドバイザーをここからフィルタリングできます。 ニュース選択 ニュースソースは、Forex Factoryの経済カレンダーから取得されます。 USD、EUR、GBP、JPY、AUD、CAD、CHF、NZD、CNYなど、任意の通貨数に基づいて選択できます。 Non-Farm(NFP)、FOMC、CPIなどのキーワード識別に基づいて選択することもできます。 影響レベルによってフィルタリングするニュースを選択することができ、低、中、高の影響範囲から選択できます。
HINN MAGIC ENTRY – the ultimate tool for entry and position management! Place orders by selecting a level directly on the chart! full description   ::  demo-version  :: 60-sec-video-description Key features: - Market, limit, and pending orders - Automatic lot size calculation - Automatic spread and commission accounting - Unlimited partitial take-profits  - Breakeven and trailing stop-loss and take-profit  functions - Invalidation leves - Intuitive, adaptive, and customizable interface - Works
AntiOverfit PRO:バックテストの不都合な真実 そのEAを買う前に、少し立ち止まってください。 年利250%をうたうシステムを見つけたところです。バックテストは完璧に見えます。販売者の価格は399ドル、あるいは1,999ドルかもしれません。表面上は、すべてが理にかなって見えます。 しかし問題があります。そのバックテストは、あなたが思っていることを証明してはいません。 過去データだけでは、ほとんど何も証明できません。確認できるのは、そのロジックが ある1つの 特定の市場シーケンスで機能したということだけです。価格が別の経路をたどった瞬間に、ロボットは崩れ始めます。 そして高額なEAの多くは、まさにそこで失敗します。 AntiOverfit PROがすること AntiOverfit PROは、システムを売る前にほとんど誰も見せないものを提供します。お金を使う 前に 、その堅牢性を確認する方法です。 数学者である必要はありませんし、難しく考える必要もありません。流れはとてもシンプルです。 MT5のチャートにAntiOverfitを配置します。 AntiOverfitが現実的な
Limited time offer: 20% off for a few days only!  - Annual subscription $360 instead of $450  - Lifetime plan $550 instead of $690 The core idea: using the user interface, you configure the parameters the chart must meet before entering a position (or positions), choose which entry models to use, and set the rules for when trading and planning should end. Lazy Trader  handles the rest: it  takes over all the routine chart watching and execution! full description  :: 3 key videos [1] ->  [2]   -
The product will copy all telegram signal to MT5 ( which you are member) , also it can work as remote copier.  Easy to set up, copy order instant, can work with almost signal formats, image signal,  s upport to translate other language to English Work with all type of channel or group, even channel have "Restrict Saving Content", work with  multi channel, multi MT5 Work as remote copier: with signal have ticket number, it will copy exactly via ticket number. Support to backtest signal. How to s
Custom Alerts AIO:マルチマーケット監視を一括で実現 — 設定不要ですぐに使えるインテリジェントツール 概要 Custom Alerts AIO は、追加のインジケーター設定が不要で、インストール後すぐに利用できる高機能マーケットスキャナーです。FX Power、FX Volume、FX Dynamic、FX Levels、IX Power を内部にすべて統合し、主要なすべての資産クラス(為替、金属、指数、暗号資産)を一括監視できます。MetaTrader の仕様により、株式は個別のシンボルとして追加可能ですが、一般的には利用頻度は低めです。 1. なぜ Custom Alerts AIO を選ぶべきか 追加ライセンス不要 • 必要なすべての Stein Investments インジケーターが内蔵されており、すぐに使用可能です。 • チャートに表示されるグラフィックは省略されており、アラート生成に特化した構成です。 市場を広範囲にカバー • 為替、金属、暗号資産、株価指数に対応(株式は手動追加可能)。 • シンボル名を入力する必要はなく、プロパティで資産クラス
ウォッチリスト全体の極端なバーをリアルタイムでスキャン。 Power Bar Scannerは全てのシンボルを同時に監視し、極端な価格バーが出現した瞬間にアラートを送信します。チャートを切り替える必要はありません。全ての機会を一つのパネルで確認できます。 あらゆる時間足に対応。Forex、Indices、ゴールド、Crypto - 全てを一画面で表示。 仕組み スキャナーはMarket Watch内の各シンボルについて、ローソク足の実体が N x ATR を超えるバーをチェックします。検出すると、そのシンボルが方向(BUY/SELL)、ATR比率、何本前にシグナルが発生したかと共に表示されます。どのシンボルが今アクティブかを一目で確認できます。 ワンクリックナビゲーション スキャナー内の任意のシンボル名をクリックすると、チャートが即座にそのシンボルに切り替わります。シグナルを見つけて、クリックして、分析する。手動でのシンボル切り替えやチャートタブの検索は不要です。 ソート可能なカラム 任意のカラムヘッダーをクリックして、シンボル、価格、シグナル、比率、経過時間でソートできます。最も
Trader Evolution
Siarhei Vashchylka
5 (7)
" Trader Evolution " - A utility designed for traders who use wave and technical analysis in their work. One tab of the utility is capable of money management and opening orders, and the other can help in making Elliott wave and technical analysis. Manual (Be sure to read before purchasing) | Version for MT4 Advantages 1. Trading in a few clicks. Immediate and pending orders are available in the panel 2. Money management. The program automatically selects the appropriate lot size 3. Simplifies
MT5のエキスパートアドバイザーリスクマネージャーは非常に重要であり、私の意見ではすべてのトレーダーにとって必要なプログラムです。 このエキスパートアドバイザーを使用すると、取引口座のリスクを管理することができます。リスクと利益の管理は、金銭的およびパーセンテージの両方で実行できます。 エキスパートアドバイザーが機能するには、それを通貨ペアチャートに添付し、許容可能なリスク値を預金通貨または現在の残高の%で設定するだけです。 [Instruction for Risk Manager parameters] アドバイザ機能 このリスクマネージャーは、リスクの管理を支援します。 -取引のために -1日あたり - 1週間 - ひと月ほど 制御することもできます 1)取引時の最大許容ロット 2)1日あたりの最大注文数 3)1日あたりの最大利益 4)エクイティを引き受ける利益を設定する それだけではありません。設定で自動設定を指定した場合、アドバイザーはデフォルトのSLとTPを設定することもできます。 アドバイザーは各イベントにアラートを添えて、注文を削除する理由を説明し
TelegramからMT5へ: 究極のシグナルコピーソリューション Telegram to MT5 を使えば、取引がシンプルになります。DLL を必要とせず、Telegram のチャンネルやチャットから MetaTrader 5 プラットフォームに取引シグナルを直接コピーできる最新ツールです。この強力なソリューションは、正確なシグナル実行、豊富なカスタマイズオプション、時間の節約、そして効率性の向上を実現します。 [ Instructions and DEMO ] 主な特徴 直接的なTelegram API統合 電話番号とセキュアコードで認証します。 ユーザーフレンドリーな EXE ブリッジを通じてチャット ID を簡単に管理できます。 複数のチャネル/チャットを追加、削除、更新して、同時に信号をコピーします。 高度なフィルターによる信号解析 例外的な単語 (例: 「レポート」、「結果」) を含む不要な信号をスキップします。 柔軟な SL および TP 形式 (価格、ピップ、ポイント) をサポートします。 価格ではなくポイントを指定するシグナルのエントリ ポイントを自動的に計算します。
Trade Manager は、リスクを自動的に計算しながら、取引を迅速に開始および終了するのに役立ちます。 過剰取引、復讐取引、感情的な取引を防止する機能が含まれています。 取引は自動的に管理され、アカウントのパフォーマンス指標はグラフで視覚化できます。 これらの機能により、このパネルはすべてのマニュアル トレーダーにとって理想的なものとなり、MetaTrader 5 プラットフォームの強化に役立ちます。多言語サポート。 MT4バージョン  |  ユーザーガイド + デモ Trade Manager はストラテジー テスターでは機能しません。 デモについてはユーザーガイドをご覧ください。 危機管理 % または $ に基づくリスクの自動調整 固定ロットサイズを使用するか、ボリュームとピップに基づいた自動ロットサイズ計算を使用するオプション RR、Pips、または価格を使用した損益分岐点ストップロス設定トレーリングストップロス設定 目標に達したときにすべての取引を自動的に終了するための 1 日あたりの最大損失 (%)。 過度のドローダウンからアカウントを保護し、オーバートレードを防ぎます
Grid Manual MT5
Alfiya Fazylova
4.9 (21)
「Grid Manual」は、注文のグリッドを操作するための取引パネルです。 ユーティリティはユニバーサルで、柔軟な設定と直感的なインターフェイスを備えています。 それは、損失を平均化する方向だけでなく、利益を増やす方向でも注文のグリッドで機能します。 トレーダーは注文のグリッドを作成して維持する必要はありません。 すべてが「Grid Manual」によって行われます。 注文を開くだけで十分であり、「Grid Manual」は注文のグリッドを自動的に作成し、非常に閉じるまでそれに付随します。 完全な説明とデモバージョン ここ。 ユーティリティの主な機能と機能 ユーティリティは、モバイル端末から開かれた注文を含め、あらゆる方法で開かれた注文を処理します。 「制限」と「停止」の2種類のグリッドで機能します。 グリッド間隔の計算には、固定と動的(ATRインジケーターに基づく)の2つの方法で機能します。 オープンオーダーグリッドの設定を変更できます。 チャート上の各注文グリッドの損益分岐点を表示します。 各注文グリッドの利益率を表示します。 ワンクリックでグリッドから収益性の高い注文を閉じるこ
Poc Breakout Signal: The Ultimate Institutional Order Flow & Price Action System Elevate your trading with Poc Breakout, a comprehensive technical analysis tool designed to bridge the gap between retail trading and institutional market understanding. This all-in-one system combines powerful Buy/Sell signals, advanced Volume Profile analysis, real-time Order Flow (Depth of Market), and critical macroeconomic data to give you a clear, unambiguous edge in the markets. Poc Breakout Signal decodes c
The Ultimate TradingView to MT5 Bridge Automation 手動取引や遅延の問題に終止符を。 TradingView to MT5 Copier PRO は、TradingViewのアラートをMetaTrader 5で直接実行するための、最速かつ最も信頼性の高いブリッジツールです。カスタムインジケーター、ストラテジーテスターのスクリプト、または手動の描画ツールを使用しているかに関わらず、このEAは 高速WebSocket技術 を使用して即座にトレードを実行します。 単純なコピーツールとは異なり、このPROバージョンには Arena Statistics が含まれています。これは、トレードパフォーマンス、ドローダウン、シャープレシオをチャート上で直接分析できる、プロ仕様の統合ダッシュボードです。 主な機能 トレードコピー機能 (Trade Copier) 超高速約定: WebSocket接続(標準的なWebRequestよりも高速)を使用し、スリッページを最小限に抑えます。 ユニバーサルブローカー対応: あらゆるブローカー および プロップファーム
Cerberus Equity Watcher
Samuel Bandi Roccatello
5 (3)
Cerberus the Equity Watcher はリスク管理ツールであり、アカウントの資産を常に監視し、不完全な EA や裁量的なトレーダーの場合は感情的な行動によって引き起こされる大きなドローダウンを回避します。これは、バグを含む可能性のある EA や、予想外の市況でうまく機能しない可能性のある EA に依存するシステマティック トレーダーにとって非常に役立ちます。 Cerberus では、最小エクイティ値と (オプションで) 最大値を設定できます。これらのいずれかに達すると、すべてのポジションがフラットになり、すべての未決注文がクローズされ、すべての EA が「強制終了」されます。すべての位置を平坦化すると、ユーザーの携帯電話に通知が送信され、画面に明確なメッセージが表示されます。 「平坦化」の後、Cerberus は株式価値を監視し続け、再初期化されるまでそれ以上の取引の試みを停止し続けます。 Cerberus によって実行されるすべての操作は、画面に明確に表示され、Expert advisor タブに報告され、通知がユーザーに送信されます。ユーザーのミスを避けるために、
Smart Stop Scanner – マルチアセット対応の市場構造型ストップロス分析システム 概要 Smart Stop Scanner は、複数の市場にわたるストップロス構造をプロフェッショナル品質で監視するために設計されたツールです。 実際の市場構造、重要なブレイクアウト、価格アクションロジックに基づいて最も意味のあるストップゾーンを自動的に検出し、 高精細(DPI対応)で見やすい統一パネルに表示します。 Forex、ゴールド、インデックス、メタル、暗号資産など幅広い市場に対応しています。 ストップレベルの算出方法 従来型のインジケーターや任意の計算式は使用していません。 代わりに、 ブレイクアウト、より高い高値、より低い安値 といった実際の市場構造イベントを検出します。 ストップレベルはこれらの構造ポイントから直接生成されるため、より自然で信頼性が高く、 実際の市場動向に即したストップ設定が可能になります。 主なハイライト • 高精度のマルチアセット対応 Forex、メタル、ゴールド、インデックス、暗号資産など、幅広い銘柄をサポートし、桁数やティックサイズを自動処
EA DIDI アラート - ATM システム検針器 金融市場で最高の取引機会を活用するのに役立つツールをお探しですか? 次に、ATM SystemsのDIDI Alert - Agulhadas Detectorは、DIDI INDEXを通じてDidi Aguiarの強力なNeedles Setup取引戦略を使用する市場で唯一のアドバイザーであり、この戦略の他の専任アドバイザーとは異なり、利用可能なさまざまなリソースを備えていることを知っておく必要があります。非常に完成度が高く、機能的で実用的です。ボリンジャーバンドのニーズ、トレンド、空き状況を特定し、「完全なニーズ」が検出されると、プッシュ通知や電子メールを介してアラートを発します。また、ボリンジャーバンドの結果を迅速かつ簡単に表示するための直感的なグラフィカルダッシュボードも提供します。分析。 DIDI Alert は最先端の人工知能を使用して開発され、コードのすべての行が最適化および洗練され、最大限のパフォーマンスと精度を保証します。さらに、DIDI Alert は、世界最大かつ最も信頼できる取引コミュニティである MQL
The Ultimate Drawdown Recovery & Trade Protection EA for MT5! Watch tutorial video here: https://youtu.be/QqAbcznNWJA?si=8u7BwPE2OoLiCKTO Your Trades Deserve a Second Chance. Give Them This Soldier. Struggling with floating losses or sudden drawdowns that threaten your account? Stop watching your trades drown in red and let the Ultimate Drawdown Recovery EA (UDR) recover, protect, and empower your trading strategy automatically. What Is UDR? UDR is an ultra-smart, lightning-fast MT5 Expert Advi
作者のその他のプロダクト
This Multi TimeFrame indicator is based on the "Fractals" classical indicator. 2 Inputs: TimeFrame1; TimeFrame2; You can put any available TimeFrame values (from M1 (Period_M1) to MN1 (Period_MN1)) equal or greater ( >= ) than the Period of the current Time Frame. The last Fractals will shown as color lines (Dots Line) of Support and Resistance for the Price moving.
This is a Multi-Time indicator which allows to display RSI and Stochastic indicators from upper timeframes on a single chart. As an example: a single chart EURUSD M5 and RSI (blue line) and Stochastic (yellow line) from H1. Red Histogram is representing Lower trend and Green Histogram is representing Upper trend.
When you put this Multi TimeFrame Parabolic SAR indicator on the chart it will automatically use Parabolic SAR from next available 3 timeframes. Green arrow will show the beginning of Up trend and Red arrow will show the beginning of Down trend. If AlertsEnabled = true, the indicator will show the Alert (message window) with a text like this: "Price going Down on ", Symbol(), " - ", Period(), " min", " price = ", Bid; If eMailEnabled = true the Indicator will send you an eMail with the same text
The zero line is characterized the Flat trend. V-shaped impulse indicates the entrance to the opposite direction. U-shaped impulse = entry orders in the same direction. If AlertsEnabled = true, the indicator will show the Alert (message window) with a text like this: "Price going Down on ", Symbol(), " - ", Period(), " min", " price = ", Bid; If eMailEnabled = true the indicator will send you an eMail with the same text an Alert message with subject: "Trinity-Impolse" (of course you have to chec
The indicator displays the usual Moving Average with input parameters: maPeriod_1; maMethod_1; maAppPrice_1. Then it calculates and displays MA on MA1 with input parameters: maPeriod_2; maMethod_2. Then it calculates and displays MA on MA2 with input parameters: maPeriod_3; maMethod_3. If AlertsEnabled = true the Indicator will show the Alert (message window) with a text like this: "Price going Down on ", Symbol(), " - ", Period(), " min", " price = ", Bid; If eMailEnabled = true the Indicator w
Multi TimeFrame Indicator "MTF CCI Trigger" based on the Commodity Channel Index from the upper TF (input parameter "TimeFrame") yellow line. Aqua line is representing ATR envelopes from the current TF. Green and Red arrows is triggered by CCI and represented UP and DOWN trends accordingly.
The BBImpulse indicator is based on the standard Moving Average indicator. You have MA input parameters: maPeriod - Moving Average period; maMODE - Moving Average mode (0 = MODE_SMA; 1 = MODE_EMA; 2 = MODE_SMMA; 3 = MODE_LWMA); maPRICE - Applied price (0=PRICE_CLOSE; 1=PRICE_OPEN; 2=PRICE_HIGH; 3=PRICE_LOW; 4=PRICE_MEDIAN; 5=PRICE_TYPICAL; 6=PRICE_WEIGHTED). Green Histogram is representing an UP-trend, Red Histogram is representing a Down-trend.
Multi TimeFrame indicator MTF ADX with Histogram shows ADX indicator data from the TF by your choice. You may choose a TimeFrame equal or greater than current TF. Yellow line is representing a price trend from the upper TF. Green line is representing +DI from the upper TF. Red line is representing -DI from the upper TF. Green histogram is displaying an Up-trend. Red histogram is displaying a Down-trend.
This Indicator creates 2 white lines based on Exponential Moving Averag e of High and Low prices. You can regulate how many bars will be involved in the calculation with input parameter HL_Period. Red and Blue arrows are displaying the moment to go Short and Long trades accordingly.
The most common way to interpreting the price Moving Average is to compare its dynamics to the price action. When the instrument price rises above its Moving Average, a buy signal appears, if the price falls below its moving average, what we have is a sell signal. To avoid a spontaneous entries one may use this update from Moving Average Indicator = Stepper-MA.
Envelopes technical Indicator is formed with two Moving Averages one of which is shifted upward and another one is shifted downward. Envelopes define the upper and the lower margins of the price range. Signal to sell appears when the price reaches the upper margin of the band; signal to buy appears when the price reaches the lower margin. To avoid a spontaneous entries one may use this update from Envelopes Indicator = Envelopes-Stepper.
The interpretation of the Bollinger Bands is based on the fact that the prices tend to remain in between the top and the bottom line of the bands. Abrupt changes in prices tend to happen after the band has contracted due to decrease of volatility; If prices break through the upper band, a continuation of the current trend is to be expected; If the pikes and hollows outside the band are followed by pikes and hollows inside the band, a reverse of trend may occur; The price movement that has starte
Fibonacci sequence is defined by integer sequence: 0, 1, 1, 2, 3, 5, 8, 13, 34, 55, 89, 144, ... By definition, it starts from 0 and 1, the next number is calculated as a sum of two previous numbers. Instead of the standard moving average, the indicator uses the caluclation of average price in form: Bar0 + Bar1 + Bar2 + Bar3 + Bar5 + Bar8 + Bar13 +... Input parameters:  FiboNumPeriod (15) - Fibonacci period; nAppliedPrice (0) - applied price (PRICE_CLOSE=0; PRICE_OPEN=1; PRICE_HIGH=2; PRICE_LOW=
This indicator present a main Moving Average line with input parameters maPeriod_1, maMethod_1 and maAppPrice_1. The second line will be a calculation of the Moving Average data of a first line with input parameters maPeriod_2, maMethod_2. The third line will be a calculation of the Moving Average data of a second line with input parameters maPeriod_3, maMethod_3. To avoid a spontaneous entries one may use this indicator-stepper.
This indicator (as almost all others) is based on classical Moving Averages. It shows the Average Bar under the current bar colored in aqua or over the current bar colored in orange. Input Parameters: ma_Period and ma_Method. The Average Bar maybe helpful to predict where the price will move in the nearest future. Of course, this "near future" depends of the current time frame.
Buy when the market is falling and sell when the market is rising. When the market is moving down you start observing and looking for buy signals. When the market is moving up you start looking for sell signals. This indicator points to the moments to Buy (Blue arrow) and to Sell (Orange arrow). Two input parameters: barsNumber and step for optimization (depending on symbol and Time Frame).
This indicator shows: A green light in case the price goes up; A red light in case the price goes down; A yellow light in case there are a sideways trend. A sideways trend is the horizontal price movement that occurs when the forces of supply and demand are nearly equal. This typically occurs during a period of consolidation before the price continues a prior trend or reverses into a new trend
This indicator is created for M1 timeframe. It shows how many ticks has occurred during current minute and ( after the slash) the sum of points Up (aqua color) and Down (orange color). In times of a high trading activity a grow up number of ticks Up and Down will signal of a big move of the price in the near future. In times of a high trading activity a grow up number of sum of points Up and Down will signal of a big move of the price in the near future too.
Two yellow lines. This is similar to classical Envelopes but with automatic deviation. The Envelopes indicator is   a tool that attempts to identify the upper and lower bands of a trading range. Aqua line. This is a classical Commodity Channel Index added to the Envelopes on the chart, not in a separate window. The Commodity Channel Index ( CCI ) is a technical   indicator   that measures the difference between the current price and the historical average price.
Probability deals with the likelihood of an event happening.   Forex   probability indicates a possibility at a specific time. This is because the forex market is highly volatile, and predicting future events affecting it is impossible. This indicator will show a positive number above the current High or negative number under the current Low as a probability of the trend. Higher time frames usually show a higher probability, even more then 100%.
Envelopes is an excellent indicator when the market is trending. Open Long position when the ClosePrice crossed the upper Aqua band. Close Long position when the Price crossed the upper Yellow band moving down. Open Short position when the ClosePrice crossed the lower Aqua band. Close Short position when the Price crossed the lower Yellow band moving up.
Moving Average Bars is a self-explanatory indicator with one input parameter: nPeriod. When the previous Price Close is above the previous indicator Bar, the probability to go Long is very high.   When the previous Price Close is under the previous indicator Bar, the probability to go Short is very high.
This indicator is based on the same idea as https://www.mql5.com/en/market/product/2406 , but instead of Average Bars it uses series or Fibonacci sequence. When the previous Price Close is above the previous indicator Bar, the probability to go Long is very high. When the previous Price Close is under the previous indicator Bar, the probability to go Short is very high.
This indicator is based on two ideas: Correlations between 5 main currency pairs: EURUSD, GBPUSD, USDCHF, USDJPY, USDCAD; US Dollar Index = the value of the United States dollar relative to a basket of foreign currencies. The use of the indicator is the same as classical  Commodity Channel Index  (CCI) indicator. CCI is calculated with the following formula:  (Typical Price - Simple Moving Average) / (0.015 x Mean Deviation) (Typical Price - Simple Moving Average) / (0.015 x Mean Deviation)
A  tick  is a measure of the minimum upward or downward movement in the  price  of a security. A  tick  can also refer to the change in the  price  of a security from one trade to the next trade.  This indicator will show amounts of ticks when the price goes up and down. This indicator is designed for M1 time frame and shows: Sum of points when the price goes up (Green Histogram). Sum of points when the price goes down (Red Histogram). 
This indicator is a combination of 2 classical indicators MA and RVI. The Relative Vigor Index (RVI) is a momentum indicator used in technical analysis that measures the strength of a trend by comparing a security's closing price to its trading range while smoothing the results using a simple moving average   The input parameter  counted_bars  determines how many bars the indicator's lines will be visible. The input parameter MaRviPeriod  is used for MA and RVI calculation.
This indicator is a combination of 2 classical indicators: MA and Force Index. The input parameter  counted_bars  determines on how many bars the indicator lines will be visible. The input parameter  MaForcePeriod  is used for MA and Force calculation. You may go Long if the current price crossed Up the Ribbon (HISTOGRAM)  and you may go Short if the current price crossed Down the Ribbon (HISTOGRAM)
This indicator is a combination of 2 classical indicators: MA and CCI. Two moving averages form Upper and Lower bands. The input parameter  counted_bars  determines on how many bars the indicator's lines will be visible. The input parameter  barsNum  is used for MA and CCI calculation.
This indicator is using 2 classical indicators: Commodity Channel Index from the higher TF (which you may change using input parameter TimeFrame ) and Average True Range from the current TF. The Green ribbon indicates the upper trend and the Red ribbon indicates the down trend. Buy when the Yellow line crosses the Upper bound (Aqua line). Sell when the Yellow line crossover the Lower bound (Aqua line).
This is a self-explanatory indicator - do nothing when the current price in the "fence" (flat) mode. Definition of a flat market: A market price that is neither Up nor Down. The input parameter  counted_bars  determines on how many bars the indicator's lines will be visible starting from the current Bar backward. The input parameter  barsNum  is used as a Period for aqua "fence" calculation.
フィルタ:
レビューなし
レビューに返信