Complete Smart Market Concepts

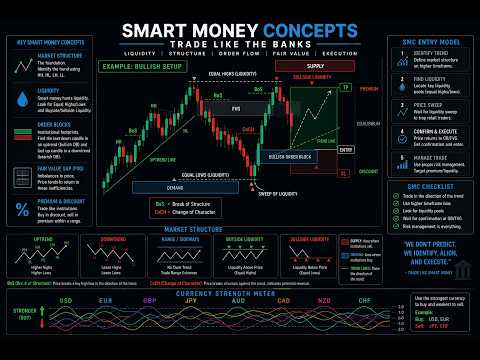
The Complete Smart Market Concepts indicator is your all-in-one institutional-grade tool designed to decode Smart Money Concepts (SMC) and reveal how the "big players" — banks, hedge funds, and institutions — truly move the forex markets.


Built specifically for traders who want to trade like the smart money, this  indicator automatically identifies and plots the most essential SMC elements directly on your charts, giving you crystal-clear insights without manual drawing or guesswork.


👑 Core Features Include:


⚡ Advanced Market Structure Analysis - BoS | CoCH 

Real-time detection of Break of Structure (BoS) for trend continuation and Change of Character (CoCH) for potential reversals, helping you stay aligned with the dominant institutional order flow.

⚡ Order Blocks (OB) 

Automatically detects and highlights high-probability bullish and bearish Order Blocks — the institutional footprints where smart money accumulated or distributed large positions before major impulsive moves (often the last opposing candle before a strong BOS displacement), acting as powerful support/resistance zones for reversals or continuations.

⚡ Fair Value Gaps (FVG) 

Automatically highlights inefficiencies and imbalances where price is likely to return, providing high-probability reversal or continuation zones.

⚡ Volume Imbalance (VI) 

Automatically highlights volume imbalances where there is no overlap between candle wick and body of previous candles, providing high-probability reversal or continuation zones.

⚡ Supply & Demand Zones 

Clearly marked institutional supply (sell) and demand (buy) areas, including premium and discount arrays to show where smart money accumulates or distributes positions.

⚡ Premium & Discount Zones 

Visual ranges that indicate whether price is trading at an "expensive" (premium — ideal for sells) or "cheap" (discount — ideal for buys) level relative to equilibrium.

⚡ Market Session Lines 

The dashboard carries a market session area that displays all major trading sessions (Sydney, Asian, London, New York) and detects the current trading session. A vertical line is  automatically drawn to help you identify the current market session thereby giving idea of high-volatility periods, session overlaps, and when institutional activity is most likely to occur.

🔥 Auto Trendlines

Intelligent trendline drawing that adapts to market structure, helping identify key directional bias and potential liquidity grabs.

🔥 Currency Strength Meter (28 Pairs -- Price Action, RSI , MFI) 

Built-in real-time meter comparing the relative strength of major currencies from a basket of 28 currency pairs, allowing you to pair the strongest against the weakest for maximum edge in your trades. The currency meter comes with three (3) options for strength calculations. It comes with a Price Action Calculations that is based on the daily price movement of currency pairs, and also it comes with the RSI and MFI oscillators.


おすすめのプロダクト
It's a variation of mid of HH and LL since it compares the higher of HH or LL against a period and twice the number of bars back to avoid whipsaws. I used to display this against lines on a chart, but made a histogram out of it and it looks interesting. It looks good at gauging trend strength and general turns (see image below). The name of the indicator is BAM, which is an acronym for "Below and Above Mid". Ways to use it: 1. To see general trend on longer TFs (more than 30 bars back).
Femade Indie
Opengates Success International
Femade Indie Vs 1.0 is a simple but multi-currency monitoring Indicator created to instantly notify the trader when an attached currency pair is ready to buy, sell or give signal when such currency pair is getting ready for a big move either up or down. It does this by visual aids on the screen charts, sound and pop-up alerts. If it shows " Medium ", this means that the so called currency signal is almost gone but can still be traded provided the trader will not need a lot of pips which can be b
Using multiple timeframes for analysis with Multi Timeframe Average Directional Index  can provide several significant benefits for traders: Comprehensive Market View: By applying Mtf ADX Standard across different timeframes, traders gain a broader perspective on market dynamics. This allows them to identify trends, patterns, and potential reversal points that might be more apparent or consistent across various scales. Enhanced Pattern Recognition: Multiple timeframes help in identifying repeati
FREE
/ ********** ********** ********** ********** ********** ********** ********** ********** ********** ********** / Big Sales for Easter! Price is reduced > 50 % already! Grasp the chance and Enjoy it!  /   ********** **********   ********** **********   ********** **********   ********** **********   ********** **********   / This is a powerful EA that support single order strategy, martingale strategy, multiple timeframes strategy, etc with lots of useful indicators and self defined methods. I
EUTUSDKILLER is a trend EA that works in all market conditions (i)It buys when the indicator confirms a trend  (ii)Sell when the same indicator confirms a down trend. (iii)Easy visual and effective trend detection. (iV)It filters and improve your trading strategies. (v) It scans previous data and give real time output. (vi) It can be set to auto calculate lots size.
The advantages of EA TWO CANDLE SMART are: It is equipped with various filters, including: maxspread, maxlot, takeprofit (4 step), stop loss (3 step), profit target per day, and many more. Open order BUY = If iClose[2] > iOpen[2] && iClose[1] > iOpen[1]. Open order SELL = If iClose[2] < iOpen[2] && iClose[1] < iOpen[1]. Target_profit_perday=50; ==> can work on forward test. lockprofit=2;//Minimal Profit in money Step_LockProfit_in_Money=25; Stoploss_in_Money=1000; Stoploss_in %=50;==> Stoploss
Buy & Sell Levels with Alerts is a comprehensive trading indicator that combines Stochastics, Previous Day Levels, Multi-Timeframe (MTF) Trend Meter , and rejection detection into one powerful tool. It helps traders quickly spot key support/resistance zones, trend direction, and high-probability reversal signals with visual arrows and automated alerts. Key Features: Stochastic Oscillator: Displays fast (%K) and slow (%D) lines in a separate window. Helps identify overbought and oversold conditio
Smart Trend Forecasting Slope-Based Trend Analysis Indicator with Alert Support Overview Smart Trend Forecasting is a slope-based trend analysis indicator derived from a classic moving average trend model originally developed by Wizard Serg and referenced in Forex Magazine #104. The indicator is designed to monitor: Trend direction Momentum shifts Trend transition conditions Moving average slope behavior It includes visual markers and configurable alert notifications for trend state changes. Ma
The arrow indicator for Forex and Binary options is based on tick volumes. Unlike many volume indicators, the "Super volumes" indicator calculates bullish and bearish volumes and gives signals based on the predominance of any of them. If, say, there was an advantage of bullish volumes in this range at the moment, then the signal will be on Buy. Or if the predominance was bearish volumes, then, accordingly, the signal will be on Sell. In the indicator settings in the "volumes" variable, you can
This Dashboard displays signals in grid view for the 28 major fx currency pairs. It is Mainly used for forex scalping in between 10 to 20 pips maximum and can be used on major trend market decisions. It Uses mainly Moving average and does not give false signal. All you need to note is the point in the grid where the signal occurs.  A beep sound is heard whenever there is a new signal and it will be displayedat the top of the chart.
This Expert Advisor uses scalping as its main strategy based on a statistical model called Bollinger Band. It embedded with two exit market strategies called 1st and 2nd dagger. The 1st dagger exits on the mid line of the band and the 2nd dagger exits by trailing until the maximum profit. It is recommended to use both strategies to lower the risk since it would split the lot into half for each dagger. Recommended: M5/M15, EURAUD/GBPAUD, ECN account Please add the news link ( http://ec.forexprost
CHF Portal is designed for Trading USDCHF specifically. Trading Concept The operation concept of CHF Portal is based on an algorithm which tries to determine the Trend. To be more specific, CHF Portal works with its own calculation logic according to historical volatility and price movement. It is trying to find out the Top or Bottom in a Trend, and open the Short or Long Position accordingly. Don't expect CHF Portal can be able to open the trade on the highest or lowest level, because CHF Port
Please download User Guide / set files / Strategy Tester Report from here: https://www.mql5.com/en/blogs/post/689449 Twins Grid System is a powerful and flexible tool for experienced trader. This system is consist of 2 full grids: Grid A and Grid B, each full grid contains 4 basic grid: BuyLimits Grid, SellLimits Grid, BuyStops Grid and SellStops Grid. There are 31 system parameters, 22 parameters for each basic grid. It’s able to create various kinds of grid strategies. Features (1) Some grid
説明 Triangle Breakout Retest Dashboard Pro Multi Symbol は、マーケットストラクチャーに基づいたブレイクアウトおよびリテスト取引のために設計されたマルチ通貨ペア対応のインスティテューショナル型インジケーターです。 複数の通貨ペアを自動的にスキャンし、三角持ち合いパターンを検出し、ブレイクアウトの方向を特定し、リテストが確認されるまでエントリーシグナルを生成しません。 このツールは、マーケット構造に基づいた確認エントリーに集中することで、フェイクブレイクアウトを回避するために設計されています。 主な機能 三角形パターン検出 上昇三角形を自動検出 下降三角形を自動検出 対称三角形を自動検出 視覚的確認のためにトレンドラインを描画 ブレイクアウト検出エンジン 有効な構造ブレイクアウトを検出 市場の方向性(上昇または下降)を決定 ブレイクアウトレベルを記録 リテスト確認システム 価格がブレイクアウトレベルに戻るのを待機 価格反応を確認してからエントリー フェイクシグナルを大幅に削減 買いリテスト確認シグナルを生成 売りリテスト確認シグナルを生
EPriceJPY is a auto-trading EA focused on USDJPY. Trading Concept The operation concept of EPriceJPY is based on an algorithm that tries to determine the Trend. To be more specific, EPriceJPY works with its own calculation logic based on simulation. It is trying to find out the Top or Bottom in a Trend, and open the Short or Long Position accordingly. Don't expect EPriceJPY to open the trade on the highest or lowest level, because EPriceJPY will trade only when the Top/Bottom can be confirmed.
HMA Multi-Basket Grid EA (MT4) HMA Multi-Basket Grid EA is a rule-based automated trading system for MetaTrader 4 designed to manage multiple independent trade baskets using a structured grid approach. The Expert Advisor focuses on order management, basket control, and risk handling , making it suitable for traders who want an organized grid framework rather than a single-trade system. Key Features Multi-Basket Architecture Each signal opens and manages its own basket independently using
Economic Strategist: Advanced Economic Intelligence Economic Strategist is a high-performance trading system designed for professional traders who value a synergy of classic technical analysis and modern capital management algorithms. The bot specializes in identifying institutional price zones and adaptive position management in dynamic market conditions. Built on the principle of Capital Preservation, Economic Strategist implements a multi-level signal filtering system and flexible risk calib
Zenith Aquarius Booster A Refined Strategy Engine for BTCUSD Most Expert Advisors on the market fall into one of two traps: they are either over-optimised to historical data and fail in live conditions, or they rely on grid and martingale recovery logic that averages deeper into losing positions. Zenith Aquarius Booster takes a different approach. Instead of offering dozens of loosely tested combinations across many symbols, Aquarius Booster is specifically engineered for BTCUSD — a market known
This trading expert advisors is an clone & upgrade of  "EA Rough Duster ", also trades best on GBPNZD minute 5 timeframe. Maintains a constant account growth and runs best on low spread and commission based accounts. Uses Martingale & perfect hedging to recover unprofitable positions ensuring no loss. Its consistent profit curves,low DrawDowns & risk proves the record for itself in reliability and consistency plus its unique market analysis ensures quick extraction of profits by scalping the mar
Check out my youtube channel about forex trading robots:  https://www.youtube.com/channel/UCL_p6fuQtNkg-1rRY69t5Ig Message me on telegram if you have any questions:  https://t.me/BRobotTrader H1 TIMEFRAME Updates and improvements(2021.08.12): USE THE SET FILES FROM THE COMMENT SECTION! This is the biggest update in the life of the KILIMANJARO EA, it got new features and NEW engine, plus many new parameters to optimize and play around with. ---It got the official TheNomadTrader Dynamic e
Oscillator helps determine the direction of the market Shows the direction of the price movement and is painted in the appropriate color. Allows you to conduct trend and counter trend trading It works on all timeframes, on any currency pairs, metals and cryptocurrency Can be used when working with binary options Distinctive features Does not redraw; Simple and clear settings; It works on all timeframes and on all symbols; Suitable for trading currencies, metals, options and cryptocurrency (Bitco
VWAP for IntradayTraders Session-aware VWAP lines for fast, precise scalps. ️ Inputs (MT4/MT5) Enable_Hourly_VWAP: Toggle hourly VWAP. Enable_Asia_VWAP: Toggle Asia session VWAP. Enable_Europe_VWAP: Toggle Europe session VWAP. Enable_NA_VWAP: Toggle North America session VWAP. Enable_Extended_VWAP: Toggle extended session VWAP. Enable_Daily_VWAP: Toggle daily VWAP. Asia Session (GMT) Session_Asia_Start_Hour: Asia session start time. Session_Asia_End_Hour: Asia session end time. Europe Sessi
FREE
Smart Momentum MT4
Mostafa Saad Saeed Shawara
製品名 Smart Momentum (MT4) – SmartView シリーズ 短い説明 MetaTrader プラットフォームで独特なユーザー体験を提供する Momentum インジケーター。以前は利用できなかった高度な機能を提供し、ダブルクリックで設定を開く、削除せずにインジケーターを非表示/表示する、インジケーターウィンドウをチャート全体のサイズで表示するなどの機能を備えています。SmartView Indicators シリーズの残りの部分とシームレスに連携するように設計されています。 概要 SmartView シリーズは、革新的な機能を通じて MetaTrader プラットフォーム上のインジケーターに独特で特徴的なユーザー体験を提供し、インジケーター管理をより速く、より簡単にします。各インジケーターには、チャート上のスマートコントロールパネルが装備されており、基本情報を表示し、すべての重要な機能への迅速なアクセスを提供します。 以前は利用できなかった独自の機能 SmartView シリーズは、インジケーターでの作業をより簡単で迅速にする高度な機能を提供します: ダブルクリ
FREE
Neelo Scalper EA   Neelo Scalper EA FOR MT4 EA works on based on HFT (high frequency trading) algorithm. Its mean trades average holding time remains in seconds. EA put two stop orders 1 buy stop and 1 sell top and two limit orders 1 buy limit and 1 sell limit at near current price. And these 4 pending orders frequently keep modifying at predefined timer in seconds at predefined distance from current price. And during news events and sudden high volatility events EA took these orders into trade
Top Gun Oscillators
Safwan Rushdi Khalil Arekat
5 (2)
Note : New in 1.6: the indicator now exports the trade signal (but not displayed). Go long with light blue. Go short with red. Exit otherwise. Signal to be imported to your EA using iCustom. This indicator provides Best of the Best linear filter momentum oscillators that I am aware of (Low Pass Differentiators, LPD's) . All of them are  recent developments by this developer, or other researchers. The oscillator line is the first buffer of the indicator, and can be called  in other indicators or
FREE
HFT Passing Prop EA   is a fully automatic robot. It can help you overcome the Challenges and Evaluations of Prop Firm Companies with High Frequency Scalp trading ( within minutes ). With one purchase, you can use it indefinitely. MT5 Version:  https://www.mql5.com/en/market/product/119633 Blogs:   https://www.mql5.com/en/blogs/post/764335 Download Set File:  https://www.mql5.com/en/market/product/119633#!tab=comments&page=1&comment=55162020 Public channel :  https://www.mql5.com/en/channels
Jerk Indicator
Safwan Rushdi Khalil Arekat
5 (1)
In physics, "Jerk" is the third time-derivative of position, with acceleration being the second derivative and velocity the first derivative. In technical analysis, the first derivative of price is the price momentum, with the second derivative,acceleration, being seldom used and the third derivative virtually unknown. The magnitude frequency response of a digital differentiator is a positive-slope straight line passing through zero frequency. Therefore, every instance of a digital signal differ
FREE
Indi RBO
Syarief Azman Bin Rosli
Input: Range Start Time : The starting time of the range creation Range End Time : The ending time of range creation Trade End Time : The time where the line of range zone high/low will be extended to Minimum Size : The minimum size of the range in point Maximum Size : The maximum size of the range in point If the range size is between the minimum and maximum, indicator will print the 1st color (blue).
トレーダーの皆様、こんにちは。 私の最高の取引ツールを紹介します。 機動部隊 PPAAF モデル T. マルチタイムフレーム 正確なプライスアクションアローフィルタリングされたモデル T。  この取引ツールは、長年さまざまな取引ツールを作成してきた私の最高傑作です。 なぜこの取引ツールが最高で信頼できるのでしょうか?  1. このツールは 6 つのインジケーターを使用します。  ダブル CCI = 高速 CCI x 低速 CCI デュアル ストキャスティクス = 高速ストキャスティクス (高速ストキャスティクス メイン ライン x 高速ストキャスティクス シグナル ライン) & スロー ストキャスティクス (低速ストキャスティクス メイン ライン x 低速ストキャスティクス シグナル ライン)  デュアルMACD = 高速MACD (高速MACDメインライン x 高速MACDシグナルライン) & スローMACD (低速MACDメインライン x 低速MACDシグナルライン) 6 つの移動平均 = MA 1 x MA 2 、MA 3 x MA 4 および
Your Key to PASS HFT Prop Firm Challenges   Are you ready to unlock the world of High-Frequency Trading ( HFT ) and take on the challenges set by proprietary trading firms? Look no further than   PropFirmFastPass , the ultimate Expert Advisor (EA) designed to help you pass unlimited HFT prop firm challenges effortlessly .  Unlimited Challenges, One-Time Fee Conquer evaluations from over 13 supported prop firms, including  Quantec Trading Capital , with just a single purchase. Say goodbye to e
このプロダクトを購入した人は以下も購入しています
Neuro Poseidon is a new indicator by Daria Rezueva. It combines precise trading signals with adaptive TP/SL levels - creating best possible trades as a result! Message me and get  Neuro Poseidon Assistant  as a gift to automize your trading process! What makes it stand out? 1. Proven profitability on all assets and timeframes 2. Only confirmed BUY and SELL signals present on the chart 3. Adaptive TP & SL levels generated by the software for each trade 4. Easy to understand - suitable for all
Dynamic Forex28 Navigator - 次世代の Forex 取引ツール。 現在 49% オフ。 Dynamic Forex28 Navigator は、長年人気のインジケーターを進化させたもので、3 つの機能を 1 つにまとめています。 Advanced Currency Strength28 インジケーター (レビュー 695 件)  + Advanced Currency IMPULSE with ALERT (レビュー 520 件) + CS28 コンボ シグナル (ボーナス)。 インジケーターの詳細 https://www.mql5.com/en/blogs/post/758844 次世代の Strength インジケーターが提供するもの  オリジナルで気に入っていたすべての機能が、新機能と精度の向上によって強化されました。 主な機能: 独自の通貨強度計算式。 すべての時間枠でスムーズかつ正確な強度ライン。 トレンドの特定と正確なエントリーに最適です。 ダイナミックマーケットフィボナッチレベル (マーケットフィボナッチ)。 このインジケーターに固有
Enigmera
Ivan Stefanov
5 (8)
ENIGMERA: 市場の中心 重要:MQL5.comのデモはStrategy Testerで実行されており、Enigmeraの機能を完全には反映していない場合があります。詳細については、説明、スクリーンショット、ビデオをご確認ください。質問があれば、遠慮なくメッセージを送ってください! インジケーターのコードは完全に書き直されました。バージョン3.0は新機能を追加し、インジケーターの開始以来蓄積されたバグを修正しました。 紹介 このインジケーターとトレーディングシステムは、金融市場への注目すべきアプローチです。ENIGMERAはフラクタルサイクルを使用して、サポートとレジスタンスのレベルを正確に計算します。真の蓄積フェーズを示し、方向と目標を提供します。トレンドでも修正でも機能するシステムです。 動作方法 インジケーターのほとんどの機能は、チャートの左側にあるボタンで制御され、市場の状況に迅速に対応できるようになっています。 ボタン ON/OFF – インジケーター全体を表示または非表示にします。 Channel – サポートチャネルを有効にし、許容範囲の偏差を示します。 Dev
Scalper Inside PRO Scalper Inside PRO は、MetaTrader 4 向けの短期トレンドおよびスキャルピング用インジケーターです。独自アルゴリズムを用いて、市場の方向性と主要なターゲットレベルを素早く検出します。エントリー、イグジット、複数の利確ターゲットを自動計算し、詳細なパフォーマンス統計を表示することで、さまざまな銘柄やストラテジーがどのように機能してきたかを確認できます。これにより、現在のマーケットコンディションに最も適した取引銘柄を選択するのに役立ちます。さらに、Scalper Inside PRO には、お使いの矢印インジケーターを簡単に接続でき、その統計と過去のパフォーマンスを素早く評価できます。 本インジケーターは、あらゆる銘柄と時間足で動作し(短期トレードには M5 を推奨)、複数の内蔵ストラテジーを備えています。そのため、単体のスキャルピングツールとしても、トレーディングシステム内の強力な分析コンポーネントとしても活用できます。 主な機能 独自アルゴリズム(Next‑Generation Trend Detection Algor
このインジケーターは実践的なトレードに最適な自動波動分析のインジケーターです! 場合... 注:   Tang Lun (Tang Zhong Shuo Zen) の命名規則の影響で、私は波のグレーディングに西洋の名前を使用することに慣れていません。基本的な波を ペン 、二次波のバンドを セグメント と名付けました。同時に、 セグメント にはトレンドの方向が指定されます (この命名方法は将来のノートで使用されます。最初に言っておきます)。ただし、アルゴリズムは曲がりくねった理論とはほとんど関係がないため、付けるべきではありません。これは、私の市場分析 によって要約された、絶えず変化する複雑な運用ルール を反映しています。 バンドは標準化され、人によって異なることがないよう定義されており、市場参入を厳密に分析する上で重要な役割を果たす人為的な干渉の描画方法が排除されています。 このインジケーターを使用することは、取引インターフェイスの美しさを改善することと同等であり、元の K ライン取引を放棄し、取引の新しいレベルに連れて行きます。また、宣伝の観点から顧客の認識も向上します。 イ
多くの矢印インジケーターは、シグナルだけを表示して、その後の判断はすべてトレーダー任せです。KT Alpha Hunter Arrows は、最初から完成されたトレードプランを提供します。 各シグナル矢印が表示されると、エントリーライン、ストップロス、4つのテイクプロフィット水準、そして現在の銘柄と時間足を今トレードする価値があるかを示すリアルタイムのエッジ判定が、チャート上にまとめて描画されます。付属の Trade Manager EA は、手動でエントリーした後の管理をサポートし、相場が荒れて感情が揺れやすい場面でも、トレードの規律を保ちやすくします。リペイントなし。確定足のみでシグナルを表示。Forex、ゴールド、指数、その他あなたが取引するあらゆる銘柄向けに設計されています。 主な機能 リペイントしない買い・売り矢印。シグナルは足が確定した後にのみ表示されます。 各シグナルにエントリーライン、構造的なストップロス、4つのテイクプロフィット水準を表示。 Edge Dashboard が、現在のチャート上で買いと売りのセットアップを個別に評価。 判定システム:No Edge、Ma
Price & Time Market Structure Indicator A professional market structure tool that analyzes waves through both price and time — not price alone. Main Description NeoWave PRO is a professional market structure indicator for MetaTrader 4 designed for traders who want to move beyond traditional one-dimensional wave tools such as ZigZag, swing indicators, and basic high/low systems. Most wave indicators analyze only one thing: Price. But a real market wave is not only a price movement. A true wave de
Current event:  https://c.mql5.com/1/326/A2SR2025_NoMusic.gif A. A2SR とは何ですか ?   * 先行テクニカル指標です (塗り直しなし、ラグなし)。 -- ガイダンス : -- https://www.mql5.com/en/blogs/post/734748/page4#comment_16532516 -- そして https://www.mql5.com/en/users/yohana/blog A2SR には、サポート (需要) とレジスタンス (供給) のレベルを決定する特別な手法があります。 ネットで見かける通常の方法とは異なり、A2SR は実際の SR レベルを決定する独自のコンセプトを持っています。 元の手法はインターネットから取得されたものではなく、インターネット上で公開されたこともありません。 A2SR は、取引スタイルに応じて SR レベルを自動選択します。 時間枠を変更しても、SR レベルはその位置にとどまります。 実際のSRは、使用する時間枠から取得されるわけではないため. A2SR
トレンドトレーディング は、タイミングのプルバックとブレイクアウトにより、市場で起こっているトレンドから可能な限り利益を得るように設計された指標です。確立されたトレンドの中で価格が何をしているかを分析することにより、取引の機会を見つけます。 [ インストールガイド | 更新ガイド | トラブルシューティング | よくある質問 | すべての製品 ] 自信を持って効率的に金融市場を取引する むち打ちにならずに確立されたトレンドから利益を得る 収益性の高いプルバック、ブレイクアウト、早期の逆転を認識する この指標は、独自の品質とパフォーマンスを分析します 複数時間枠のダッシュボードを実装します インジケーターは再描画されていません 電子メール/音声/視覚アラートを実装します 確立されたトレンドは多くの取引機会を提供しますが、ほとんどのトレンド指標はそれらを完全に無視しています。インジケーターの解釈はかなり簡単です: (1) トレンドの変化 (2) トレンドの方向への後退 (3) トレンドの方向へのブレイクアウト 赤いダッシュ は下降トレンド中の修正です 青いダッシュ は上昇トレンド中
Step into the world of Forex trading with confidence, clarity, and precision using   Gold Indicator   a next-generation tool engineered to take your trading performance to the next level. Whether you’re a seasoned professional or just beginning your journey in the currency markets, Gold Indicator equips you with powerful insights and help you trade smarter, not harder. Built on the proven synergy of three advanced indicators, Gold Indicator focuses exclusively on medium and long-term trends eli
この製品は 2026 年の市場向けに更新され、最新の MT5 ビルドに最適化されています。 価格更新のお知らせ: Smart Trend Trading System は現在 $99 で提供されています。 次の 30 件の購入 後、価格は $199 に上がります。 特別オファー: Smart Trend Trading System を購入後、私にプライベートメッセージを送ることで、 Smart Universal EA を無料 で受け取り、Smart Trend のシグナルを自動売買に変えることができます。 Smart Trend Trading System は、リペイントなし、再描画なし、遅延なしの完全なトレーディングシステムです。よりクリーンなシグナル、より明確なトレンド方向、そしてより整理された取引方法を求めるトレーダー向けに作られています。 Online course , manual and download presets . このシステムは、トレンド検出、反転ゾーン、Smart Cloud、トレーリングストップロジック、サポートとレジスタンス、ローソク足の色分け、ア
スイングトレーディング は、トレンドの方向のスイングと可能な反転スイングを検出するように設計された最初のインジケーターです。トレーディングの文献で広く説明されているベースラインスイングトレーディングアプローチを使用します。インディケータは、いくつかの価格と時間のベクトルを調査して、全体的なトレンドの方向を追跡し、市場が売られ過ぎまたは買われ過ぎて修正の準備ができている状況を検出します。 [ インストールガイド | 更新ガイド | トラブルシューティング | よくある質問 | すべての製品 ] むち打ちを起こさずに市場スイングの利益 インジケーターは常にトレンドの方向を表示します 色付きの価格帯は機会のベースラインを表します 色付きのダッシュは、可能な反転スイングを表します この指標は、独自の品質とパフォーマンスを分析します 複数時間枠のダッシュボードを実装します カスタマイズ可能なトレンドおよびスイング期間 電子メール/サウンド/プッシュアラートを実装します インジケータは再描画またはバックペインティングではありません Swing Tradingとは Swing Tradingは
BTMM State Engine Pro is a MetaTrader 4 indicator for traders who use the Beat The Market Maker approach: Asian session context, kill zone timing, level progression, peak formation detection, and a multi-pair scanner from a single chart. It combines cycle state logic with a built-in scanner dashboard so you do not need the same tool on many charts at once. What it does Draws the Asian session range; session times can follow broker server offset or be set in inputs. Tracks level progression (L
「 Dynamic Scalper System 」インジケーターは、トレンド波の中でスキャルピング取引を行う手法のために設計されています。 主要通貨ペアと金でテスト済みで、他の取引商品との互換性があります。 トレンドに沿った短期的なポジションオープンのシグナルを提供し、追加の価格変動サポートも提供します。 インジケーターの原理 大きな矢印はトレンドの方向を決定します。 トレンド波の中では、小さな矢印の形でスキャルピングシグナルを生成するアルゴリズムが機能します。 赤い矢印は強気方向、青い矢印は弱気方向です。 トレンドの方向には敏感な価格変動ラインが描かれ、小さな矢印のシグナルと連動します。 シグナルは次のように機能します。適切なタイミングでラインが現れるとエントリーシグナルが形成され、ラインが開いている間はポジションが保持され、完了すると取引が終了します。 推奨される動作時間枠はM1~H4です。 矢印は現在のローソク足に形成され、次のローソク足が開いている場合は、前のローソク足の矢印は再描画されません。 入力パラメータ Trend Wave Period - トレンド方向
M30/H1/H4スイング版もあります M5/M15では取りきれない大きな波を狙いたい方へ。 Gold Signal Swing Pro(M30/H1/H4対応)を販売中。 1トレードで$20〜$80+の値幅を狙う。 https://www.mql5.com/en/market/product/177643 KURAMA GOLD SIGNAL PRO(MT4版)— 7層フィルター・自動TP/SL・品質スコア搭載 XAUUSD完全トレードシステム リペイントなし。リドローなし。ラグなし。すべてのサインは確定後に変わりません。見たままが結果です。 特典:買い切りライセンスをご購入いただいた方に、AI Zone Radar($59相当)+PDFマニュアルを無料プレゼント。購入後にMQL5でメッセージをお送りください。 AI Zone Radar: https://www.mql5.com/en/market/product/175834 トレーダーから信頼されています:ゴールドトレーダーのコミュニ
MonsterDash Harmonic Indicator is a harmonic pattern dashboard. It recognizes all major patterns. MonsterDash is a dashboard that displays all detected patterns for all symbols and (almost) all timeframes in sortable and scrollable format. Users can add their own user defined patterns . MonsterDash can open and update charts with the pattern found. Settings MonsterDash's default settings are good enough most of the time. Feel free to fine tune them to your needs. The color settings are for thos
このインジケーターは、エリオット波動理論と組み合わせて作動し、2つの方法で使用されます: 自動モード: このモードでは、インジケーターがチャート上の全ての5つのモーティブ波を自動的に検出し、予測とポテンシャルな逆転ゾーンを提供します。また、アラートやプッシュメッセージを生成する能力も備えています。この自動機能により、エリオット波動パターンの識別と分析のプロセスが効率化されます。 手動モード: このオプションは、エリオット波動理論を手動で扱いたいトレーダー向けです。9つの段階を使用して波を描画することができます。各段階は、表示された後に描画されたラインを調整して個別に定義できます。この機能により、手動で波を描画するプロセスがより効率的になります。重要な点として、すべての描画データが将来の参照のためにプラットフォームのデータフォルダに保存されることに注意してください。 パラメータ: Name: インジケーターの名前。 Use_System_Visuals: インジケーターのテーマを有効または無効にして、取引プラットフォーム全体の外観に合わせます。 Explain_Comment: 波の番号
Introduction to Fractal Pattern Scanner Fractal Indicator refers to the technical indicator that makes use of the fractal geometry found in the financial market. Fractal Pattern Scanner is the advanced Fractal Indicator that brings the latest trading technology after the extensive research and development work in the fractal geometry in the financial market. The most important feature in Fractal Pattern Scanner is the ability to measure the turning point probability as well as the trend probabi
トレンドラインプロ   市場の真の方向転換点を理解するのに役立ちます。この指標は、真のトレンド反転と主要プレーヤーが再び参入するポイントを示します。 分かりますか     BOSライン   複雑な設定や不要なノイズなしに、より長い時間足でのトレンドの変化と重要なレベルを把握できます。シグナルは再描画されず、バーが閉じた後もチャート上に残ります。 VERSION MT 5     -     RFI LEVELS PRO インジケーター と組み合わせることで、その潜在能力を最大限に発揮します。 インジケーターが示す内容: 本当の変化   トレンド(BOSライン) 一度シグナルが現れたら、それは有効です!これは、リペイント機能を持つインジケーターとの重要な違いです。リペイント機能を持つインジケーターは、シグナルを発した後、それを変更し、資金の損失につながる可能性があります。これにより、より高い確率と精度で市場に参入できます。また、矢印が現れた後、目標値(利益確定)に達するか、反転シグナルが現れるまで、ローソク足の色を変更する機能もあります。 繰り返しエントリ       主要プレーヤーの
The Propfolio Master Suite is the ultimate all-in-one analytical workstation for professional traders. Combining the power of the Beat The Market Maker (BTMM) methodology, Smart Money Concepts (SND/Liquidity), and Advanced Volume Profile, this suite replaces multiple different indicators with one optimized engine. Monitor up to 14 pairs simultaneously from a single chart, instantly identify market cycles, and seamlessly map institutional footprints with the click of a button. The Command Center
このインジケーターは、反転ポイントと価格戻りゾーンを正確に表示します。     主要プレーヤー 。新たなトレンドが形成される場所を把握し、最大限の精度で意思決定を行い、すべての取引をコントロールします。 TREND LINES PRO インジケーターと組み合わせることで、その潜在能力を最大限に発揮します。 VERSION MT5 インジケーターが示す内容: 新しいトレンドの始まりに活性化する反転構造と反転レベル。 リスクと報酬の比率を最小限に抑えた利益 確定 と 損失停止の レベルの表示     RR 1:2   。 インテリジェントな削減ロジックによるストップロス。 指定されたインジケーターから 2 つのトレンド タイプの反転パターンを表示します。 指標: トレンドを追う   TREND LINES PRO   (世界的なトレンドの変化) TREND PRO   (クイックトレンド変更) シンプルで効果的   スキャナー   リアルタイムトレンド(新機能)。 マルチタイムフレームのインストゥルメント フィルタリング。 画面   利益     LOGIC AI信号の後。 当日プラス方
Gold Venamax   - これは最高の株式テクニカル指標です。 指標アルゴリズムは資産の価格変動を分析し、ボラティリティと潜在的なエントリーゾーンを反映します。 インジケーターの機能: これは、快適で収益性の高い取引のためのマジックとトレンド矢印の 2 つのブロックを備えたスーパー インジケーターです。 チャート上にブロックを切り替えるための赤いボタンが表示されます。 マジックはインジケーター設定で設定されているため、異なるブロックを表示する 2 つのチャートにインジケーターをインストールできます。 Gold Venamax は、異なる矢印バッファー (GV と SD) を備えた 2 つのチャートに配置できます。 これを行うには、設定で異なる Magic を選択する必要があります。たとえば、あるマジック = 999、別のマジック = 666 を選択します。次に、チャート上の赤いボタンで矢印バッファを選択できます。 インジケーター設定の各矢印バッファー (GV および SD) には、快適で収益性の高い取引のための個別の矢印フィルターがあります (UseFiltrGV = tru
Trend Breakout Arrows Indicator The Trend Breakout Arrows Indicator is a momentum-based signal tool designed to identify potential bullish and bearish breakout opportunities. It displays clear arrow signals directly on the price chart, helping traders quickly recognize possible trend changes and continuation setups. Up Arrow (Buy Signal) A magenta up arrow appears below a candle when bullish momentum begins to strengthen. This signal indicates that buying pressure may be overtaking selling press
NAM Order Blocks
NAM TECH GROUP, CORP.
3.67 (3)
MT4マルチタイムフレームオーダーブロック検出インジケーター。 特徴 -チャートコントロールパネルで完全にカスタマイズ可能で、完全な相互作用を提供します。 -必要な場所でコントロールパネルを表示および非表示にします。 -複数の時間枠でOBを検出します。 -表示するOBの数量を選択します。 -さまざまなOBユーザーインターフェイス。 -OBのさまざまなフィルター。 -OB近接アラート。 -ADRの高線と低線。 -通知サービス(画面アラート|プッシュ通知)。 概要 注文ブロックは、金融機関や銀行からの注文収集を示す市場行動です。著名な金融機関と中央銀行が外国為替市場を牽引しています。したがって、トレーダーは市場で何をしているのかを知る必要があります。市場が注文ブロックを構築するとき、それは投資決定のほとんどが行われる範囲のように動きます。 注文の構築が完了すると、市場は上向きと下向きの両方に向かって急激に動きます。注文ブロック取引戦略の重要な用語は、機関投資家が行っていることを含むことです。それらは主要な価格ドライバーであるため、機関投資家の取引を含むあらゆる戦
RelicusRoad Pro: 定量的市場オペレーティングシステム 【期間限定】無制限アクセス 70% OFF - 2,000人超のトレーダーと共に なぜ多くのトレーダーは「完璧な」インジケーターを使っても失敗するのでしょうか? それは、文脈を無視して 単一の概念 だけでトレードしているからです。文脈のないシグナルは単なるギャンブルです。勝ち続けるには、 根拠の重なり(コンフルエンス) が必要です。 RelicusRoad Proは単なる矢印インジケーターではありません。完全な 定量的市場エコシステム です。独自のボラティリティモデリングを用いて、価格が推移する「適正価値の道(Fair Value Road)」をマッピングし、ノイズと真の構造的ブレイクを判別します。 推測はやめましょう。機関投資家レベルの「ロード・ロジック」でトレードを。 コアエンジン:「Road」アルゴリズム システムの中心となる Road Algo は、市場環境にリアルタイムで適応するダイナミックなボラティリティチャネルです。 安全ライン(平衡点) と、価格が数学的に反転しやすい 拡張レベル を投影します。 Si
これはほぼ間違いなく、MetaTraderプラットフォームで見つけることができる最も完全な調和価格形成自動認識インジケーターです。 19種類のパターンを検出し、フィボナッチプロジェクションをあなたと同じように真剣に受け止め、潜在的逆転ゾーン(PRZ)を表示し、適切なストップロスとテイクプロフィットレベルを見つけます。 [ インストールガイド | 更新ガイド | トラブルシューティング | よくある質問 | すべての製品 ] 19の異なる調和価格形成を検出します プライマリ、派生および補完フィボナッチ投影(PRZ)をプロットします 過去の価格行動を評価し、過去のすべてのパターンを表示します この指標は、独自の品質とパフォーマンスを分析します 適切なストップロスとテイクプロフィットのレベルを表示します ブレイクアウトを使用して適切な取引を通知します すべてのパターン比をグラフにプロットします 電子メール/音声/視覚アラートを実装します スコット・M・カーニーの本に着想を得て、この指標は最も純粋で急を要するトレーダーのニーズを満たすように設計されています。ただし、トレードを容易にする
この製品は 2026 年の市場向けに更新され、最新の MT5 ビルドに最適化されています。 価格更新のお知らせ: Smart Price Action Concepts は現在 $200 で提供されています。 次の 30 件の購入 後、価格は $299 に上がります。 特別オファー: 購入後、私にプライベートメッセージを送ることで、 無料ボーナス + ギフト を受け取ることができます。 まず、このトレーディングツールはリペイントなし、再描画なし、遅延なしのインジケーターであり、プロフェッショナルな取引に最適であることを強調しておきます。 Online course , and manual Smart Price Action Concepts Indicator は、初心者から経験豊富なトレーダーまで使える非常に強力なツールです。20 種類以上の便利なインジケーターを 1 つにまとめ、Inner Circle Trader Analysis や Smart Money Concepts Trading Strategies などの高度な取引アイデアを組み合わせています。このインジケ
Advanced Market Footprint Profiles is a specialized market analysis tool, representing a customized volume distribution profile enhanced with Delta and Bid/Ask profiles. The indicator builds fixed horizontal profiles (Fixed Range), displaying the distribution of Volume, Delta, and Bid/Ask at each price level with high precision. Unlike standard horizontal volume profiles, which only show overall volume distribution, this indicator combines Volume, Delta, and Bid/Ask within the selected range a
MV Arrow– Professional Swing Signal Indicator comment for set files and user manual. MV Arrow v4.0 is a precision-based MT4 arrow indicator designed to identify high-probability swing BUY and SELL zones using a multi-filter confirmation system. It focuses on market extremes , filtering noise and low-quality signals to deliver clear, well-spaced trade opportunities . This indicator is ideal for traders who prefer clean charts, disciplined entries, and confirmation-based signals rather than co
ゴールドラッシュ・トレンド・アロー・シグナル ゴールドラッシュ・トレンド・アロー・シグナル 指標は、XAU/USDにおける高速・短期スキャルパー向けに最適化された、正確でリアルタイムのトレンド分析を提供します。 1分足専用に設計されたこのツールは、明確なエントリーポイントを示す方向矢印を表示し、スキャルパーが変動の激しい市場状況でも自信を持って取引できるよう支援します。 この指標は、PRIMARY(主要)とSECONDARY(補助)のアラート矢印で構成されています。PRIMARYシグナルは、トレンドの方向転換を示す白と黒の方向矢印であり、SECONDARYシグナルは、PRIMARY矢印が示す方向を確認し、潜在的なエントリーポイントを示す青と赤の矢印です。 注意:トレンド方向の変化後にPRIMARYアラート矢印が1つだけ表示される場合、複数のSECONDARY青/赤矢印が表示される点に注意が必要です。SECONDARYシグナルは、シグナル基準を満たす任意のローソク足後に表示されます。したがって、長期的なトレンド移動の場合、画面に多くのSECONDARY矢印が表示されます(添付の
作者のその他のプロダクト
Note : The slow loading of the indicator issue has been addressed . This new version loads fast and does not slow the platform. Version 1.3 : We have updated the indicator to include an historical bar scanning option . So instead of scanning all bars in the history (which can make the indicator slow sometimes ) , you can select the maximum number of bars it can scan which can increase the performance and make the indicator faster. This indicator scans the 1-3 Trendline pattern . The indicato
YOU CAN NOW DOWNLOAD FREE VERSIONS OF OUR PAID INDICATORS . IT'S OUR WAY OF GIVING BACK TO THE COMMUNITY ! >>>    GO HERE TO DOWNLOAD This system is an Heiken Ashi system based on RSI calculations . The system is a free open source script originally published on TradingView by JayRogers . We have taken the liberty of converting the pine script to Mq4 indicator . We have also added a new feature which enables to filter signals and reduces noise on the arrow signals. Background HEIKEN ASHI Th
FREE
Flag Pattern pro is a   Price Action (PA)   analytical tool that scans the   continuation patterns   known as   "Flag and Pennant Patterns"   . Flag and Pennant patterns are continuation patterns characterized by a move in a previous trend direction after a shallow retracement usually below 50% of the original move . Deep retracements can however be sometimes found at the 61.8 % levels. The original move is know as the   flag pole   and the   retracement   is called the flag.   Indicator Funda
YOU CAN NOW DOWNLOAD FREE VERSIONS OF OUR PAID INDICATORS . IT'S OUR WAY OF GIVING BACK TO THE COMMUNITY ! >>>    GO HERE TO DOWNLOAD This system is an Heiken Ashi system based on RSI calculations . The system is a free open source script originally published on TradingView by JayRogers . We have taken the liberty of converting the pine script to Mq4 indicator . We have also added a new feature which enables to filter signals and reduces noise on the arrow signals. Background HEIKEN ASHI Th
FREE
YOU CAN NOW DOWNLOAD FREE VERSIONS OF OUR PAID INDICATORS . IT'S OUR WAY OF GIVING BACK TO THE COMMUNITY ! >>>    GO HERE TO DOWNLOAD More About Advanced Currency Meter Every good forex system has the following basic components: Ability to recognize the trend direction. Ability to identify the strength of the trend and answer the basic question Is the market trending or is it in a range? Ability to identify safe entry points that will give a perfect risk to reward (RR) ratio on every position.
FREE
YOU CAN NOW DOWNLOAD FREE VERSIONS OF OUR PAID INDICATORS . IT'S OUR WAY OF GIVING BACK TO THE COMMUNITY ! >>>    GO HERE TO DOWNLOAD   The system is a free open source pine script originally published on TradingView by everget   . It was converted to Mt4 by Forex Robot Makers. This system is a  popular trend indicator based on ATR ( Average True Range ) , Moving Averages and the Donchian channel . System BackGround ATR The average true range is an indicator of the price volatility of an asse
FREE
YOU CAN NOW DOWNLOAD FREE VERSIONS OF OUR PAID INDICATORS . IT'S OUR WAY OF GIVING BACK TO THE COMMUNITY ! >>>    GO HERE TO DOWNLOAD The   Volatility Ratio   was developed by Jack D. Schwager to identify trading range and signal potential breakouts. The volatility ratio is defined as the current day's true range divided by the true range over a certain number of days N (i.e. N periods).  How to Use Volatility Ratio The use of a volatility ratio helps to identify situations where the price of
FREE
Channel Vertex is a price action pattern formed by price Chanel and a triangle pattern . Price channels basically indicates possible support and resistance zones around a price movement and retracement    or breakout at these levels can indicate possible trend continuation or reversal .  Majority of the times price fluctuations forms triangle patterns defined by 3 vertexes , these triangle patterns most times defines a trend continuation.  A triangle pattern is a trend continuation pattern that
CONGESTION BREAKOUT PRO This indicator scans the breakout of congestion zones . This indicator unlike any other congestion indicator you will find in the market right now,  it uses an advanced algorithm not peculiar to most traditional congestion indicators available today . The advanced algorithm used to define the congestions  is greatly responsible for the high rate real congestion zones and low rate fake congestion zones spotted by this product. UNDERSTANDING CONGESTION Congestion are ar
YOU CAN NOW DOWNLOAD FREE VERSIONS OF OUR PAID INDICATORS . IT'S OUR WAY OF GIVING BACK TO THE COMMUNITY ! >>>    GO HERE TO DOWNLOAD The Volatility Ratio was developed by Jack D. Schwager to identify trading range and signal potential breakouts. The volatility ratio is defined as the current day's true range divided by the true range over a certain number of days N (i.e. N periods).  How to Use Volatility Ratio The use of a volatility ratio helps to identify situations where the price of a s
FREE
M & W Pattern Pro is an advanced scanner for M and W patters , it uses extra filters to ensure scanned patterns are profitable. The indicator can be used with all symbols and time frames. The indicator is a non repaint indicator with accurate statistics calculations. To use , simply scan the most profitable pair using the statistics dashboard accuracy , then enter trades on signal arrow and exit at the TP and SL levels. STATISTICS : Accuracy 1 : This is the percentage of the times price hits TP
Version 1.6 ! Volume Strength 28 is better , easier to use and more awesome ! Based on complaint we got from the reviews, we understood many don't know how to really use the time frame setting on the input menu thus they have complaints of volatility, thus we have designed an Automatic Time Frame selection system that is suitable for novice traders.! The design of the indicator has been changed along with some calculation metrics. Based on complaints of high volatility we have been getting ,we
YOU CAN NOW DOWNLOAD FREE VERSIONS OF OUR PAID INDICATORS . IT'S OUR WAY OF GIVING BACK TO THE COMMUNITY ! >>>    GO HERE TO DOWNLOAD Camarilla Pivots Historical plots the historical data of the camarilla pivot point levels on the chart. The Camarilla Pivot levels was originated in 1989 by Nick Scott. The levels are used as primary support and resistance levels by Intraday traders. The levels are calculated with the following formula: R4 = C + RANGE * 1.1/2 R3 = C + RANGE * 1.1/4 R2 = C + RANG
FREE
YOU CAN NOW DOWNLOAD FREE VERSIONS OF OUR PAID INDICATORS . IT'S OUR WAY OF GIVING BACK TO THE COMMUNITY ! >>>  GO HERE TO DOWNLOAD Most of the time, market reversals / pull backs usually follow volume and price spikes thus  these spikes could be the first indication of an exhaustion and possible reversal/pullback. High volume Turns is an indicator that scans the market for price and volume spikes around over-bought/over-sold market conditions. These spikes when spotted serves as the first indi
FREE
YOU CAN NOW DOWNLOAD FREE VERSIONS OF OUR PAID INDICATORS . IT'S OUR WAY OF GIVING BACK TO THE COMMUNITY ! >>>    GO HERE TO DOWNLOAD V1 Scalper is an easy to use tool designed for trend scalping. It tries to spot good entry points in a major trend by using swing high and lows formed along the trend . This tool can be used on Fx Pairs , Indices , Commodities and stocks. Not often  but in some signals , the arrow might repaint on the current candle so extra confirmation tools are advised for tr
FREE
YOU CAN NOW DOWNLOAD FREE VERSIONS OF OUR PAID INDICATORS . IT'S OUR WAY OF GIVING BACK TO THE COMMUNITY ! >>>    GO HERE TO DOWNLOAD The popular saying in forex  "The Trend is your friend"   has always stood the test of time because it is valid statement for every generation of traders and in every market. Most successful traders do not fight against the trend but lend to flow with it.  Sometimes finding the best pair to trade can be a daunting task even when you have a good strategy . Some
FREE
YOU CAN NOW DOWNLOAD FREE VERSIONS OF OUR PAID INDICATORS . IT'S OUR WAY OF GIVING BACK TO THE COMMUNITY ! >>>    GO HERE TO DOWNLOAD Momentum channel is a simple momentum based system yet with a great degree of accuracy in detecting turning points. The market momentum are defined by Average True Range Channels . When price breaks these channels most times , it is an indication of a shift in market momentum and thus a possible new trend formation. The system can be traded on any time frame and
FREE
Ask any successful forex traders the secret of their success and they will tell you that the first key to a successful forex trading is proper trade management. Trade management is what differentiates the rookie from the pro in Forex. While the rookie trades based on emotions and greed, the pro trades based on certain logic and rules . These logic and rules are all embodied in a successful Trade Management System. Advanced Trade Manager is a combination of different trade management systems desi
Good News ! Advanced Currency Meter is more awesome now ! If you have been a fan of the free version of Advanced Currency Meter then I will implore you not to be discourage because you will soon find that the new paid version is worth every dime. Unlike the free version the new paid version of Advanced Currency Meter now has a newly added panel called the “% Daily Range” . Why A Paid Version Now? We believe you like good things and many who has used Advanced Currency Meter over the years will te
This Currency Meter Calculates Strength Using a currency basket of 28 pairs? This Currency Meter uses a basket of 28 currency pair to define strength. This is very important because it gives an wholesome view of the strength of a currency by considering its reaction to all major currencies paired with it. This Currency Meter is Multi-timeframe!!! Majority of the currency strength indicators around the market today only has a single time frame view. Even with the so called multi-timeframe versi
Pivots Dashboard is the single most complete instruments set for Pivot Points trading currently available in the market. We have done a comprehensive research prior to the product design to make sure that this product meets every need of Pivot Point trading. Pivots Points are significant levels technical analysts can use to determine directional movement and potential support/resistance levels. Pivot Points are thus predictive or leading indicators. While the points were originally used by floor
WOLFE WAVE PATTERNs First discovered by Bille Wolfe . The wolfe wave  is a 5 wave price action pattern that is formed by supply and demand in a market and the fight to reach equilibrium in the market . The entry spot of the pattern is defined by the breakout of the trend created by wave 1 and wave 3 . This pattern forms in any market where there is supply and demand thus it can also be used to trade commodities and stocks. Wolfe Waves are reversal patterns that usually carry a low risk margin. P
The swing continuation pattern happens in a trend direction after a short reversal / pull back . As the name suggests , these patterns occurs along the swing high and swing lows of a trend , this makes the patterns very low risk patterns with potential high rewards . The swing continuation indicator also combines Currency Meter as a filter for its execution. The idea is to go with both the price trend flow and currency trend flow. Which means the price action must be supported by the currency st
M & W Pattern Pro is an advanced scanner for M and W patters , it uses extra filters to ensure scanned patterns are profitable. The indicator can be used with all symbols and time frames. The indicator is a non repaint indicator with accurate statistics calculations. To use , simply scan the most profitable pair using the statistics dashboard accuracy , then enter trades on signal arrow and exit at the TP and SL levels. STATISTICS : Accuracy 1 : This is the percentage of the times price hits TP
The market session currency meter is an advanced currency meter designed majorly for intra-day trading. The meter tracks price movements and volatilities across the different market sessions daily. With this market meter you will be able to see how price moved within the four (4) major market sessions ( SYDNEY , TOKYO , LONDON and NEW YORK ). The indicator comes with an inbuilt daily savers time adjuster that automatically adjusts the hours for each session when ever the daily savers time (DST)
This Currency Meter Calculates Strength Using a currency basket of 28 pairs? This Currency Meter uses a basket of 28 currency pair to define strength. This is very important because it gives an wholesome view of the strength of a currency by considering its reaction to all major currencies paired with it. This Currency Meter is Multi-timeframe!!! Majority of the currency strength indicators around the market today only has a single time frame view. Even with the so called multi-timeframe versio
Flag Pattern pro is a   Price Action (PA)   analytical tool that scans the   continuation patterns   known as   "Flag and Pennant Patterns"   . Flag and Pennant patterns are continuation patterns characterized by a move in a previous trend direction after a shallow retracement usually below 50% of the original move . Deep retracements can however be sometimes found at the 61.8 % levels. The original move is know as the   flag pole   and the   retracement   is called the flag. Indicator Fundam
This indicator scans the 1-3 Trendline pattern . The indicator is a 100 % non repaint low risk breakout system . The patterns are formed around swing high and swing lows which make them a low risk pattern with high reward. PATTERN BACKGROUND The 1-3 Trendline Breakout pattern is formed by four(4) points which are composed of three (3) primary points and the pattern neck. A trendline is always formed by the point 1 and the neck of the pattern . When price breaks out of the trendline formed , it
Channel Vertex is a price action pattern formed by price Chanel and a triangle pattern . Price channels basically indicates possible support and resistance zones around a price movement and retracement    or breakout at these levels can indicate possible trend continuation or reversal .  Majority of the times price fluctuations forms triangle patterns defined by 3 vertexes , these triangle patterns most times defines a trend continuation.  A triangle pattern is a trend continuation pattern that
CONGESTION BREAKOUT PRO This indicator scans the breakout of congestion zones . This indicator unlike any other congestion indicator you will find in the market right now,  it uses an advanced algorithm not peculiar to most traditional congestion indicators available today . The advanced algorithm used to define the congestions  is greatly responsible for the high rate real congestion zones and low rate fake congestion zones spotted by this product. UNDERSTANDING CONGESTION Congestion are ar
フィルタ:
レビューなし
レビューに返信