Investment Castle Volatility Index
- 지표
-
Ahmed Alaaeldin Abdulrahman Ahmed Elherzawi
 Every day is a new opportunity. You can build on yesterday's success or put its failures behind and start over again. That's the way life is, with a new game every day, and that's the way baseball is.
 - 버전: 1.1
- 업데이트됨: 12 6월 2021
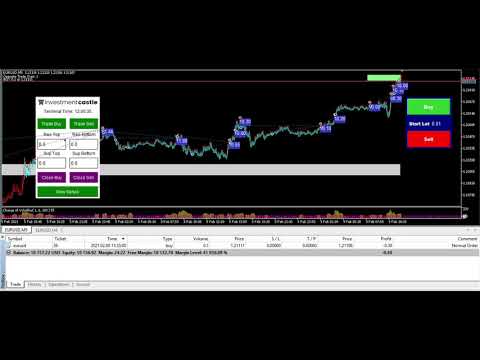
Investment Castle Volatility Index — Read the Market's Energy
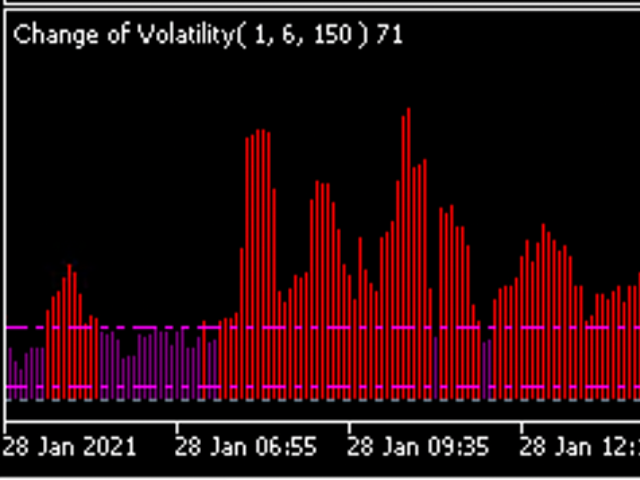
The Investment Castle Volatility Index shows you the current symbol's volume and market volatility in one clean reading. It is the same volatility engine the Investment Castle EA uses to set dynamic distances and time its opposite entries.
What it does for you
- Volume & volatility at a glance: see how active and how volatile the current market really is.
- Powers dynamic distances: the same index the Investment Castle EA uses for adaptive spacing and opposite entries.
- Optimizable per pair: parameters can be tuned and optimized for each instrument.
- Works with any chart: any symbol, any timeframe.
Who it is for: traders who size and space their trades around real market volatility.
Risk warning: trading involves substantial risk of loss. Always test on a demo account first and use risk settings you are comfortable with. Past performance does not guarantee future results.


Very good!