PZ Turtle Trading MT5
- インディケータ
- バージョン: 2.1
- アップデート済み: 17 2月 2022

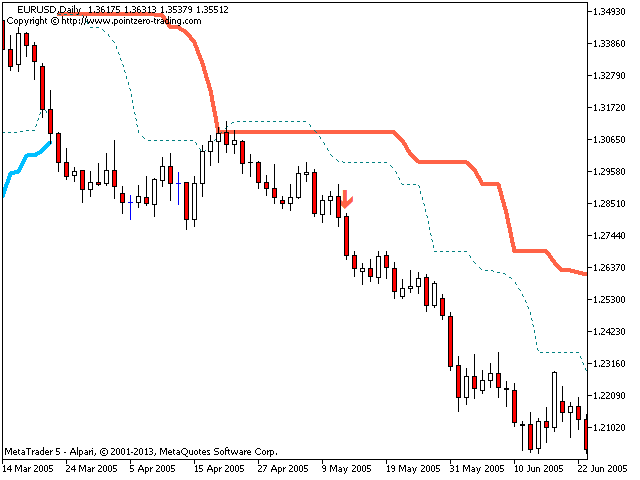
The Turtle Trading Indicator implements the original Dennis Richards and Bill Eckhart trading system, commonly known as The Turtle Trader. This trend following system relies on breakouts of historical highs and lows to take and close trades: it is the complete opposite to the "buy low and sell high" approach. The main rule is "Trade an N-day breakout and take profits when an M-day high or low is breached (N must me above M)".
[ Installation Guide | Update Guide | Troubleshooting | FAQ | All Products | 👉 Get Help ]
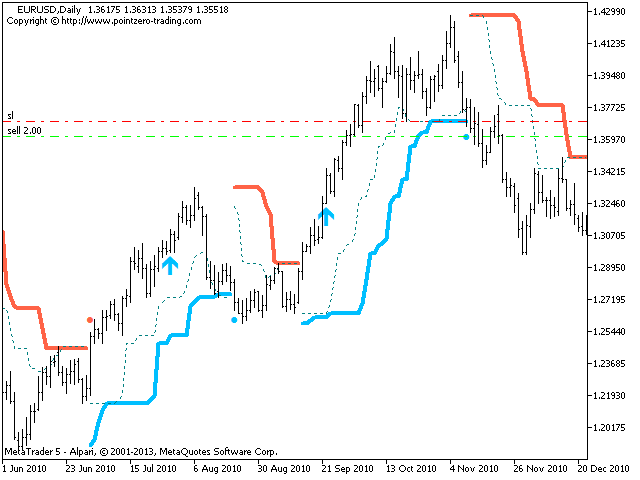
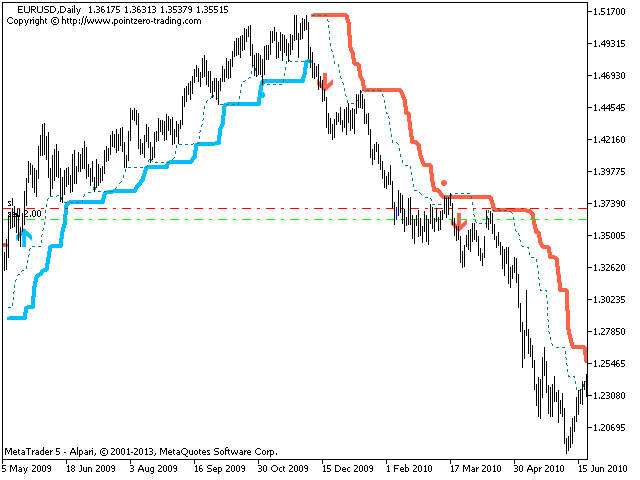
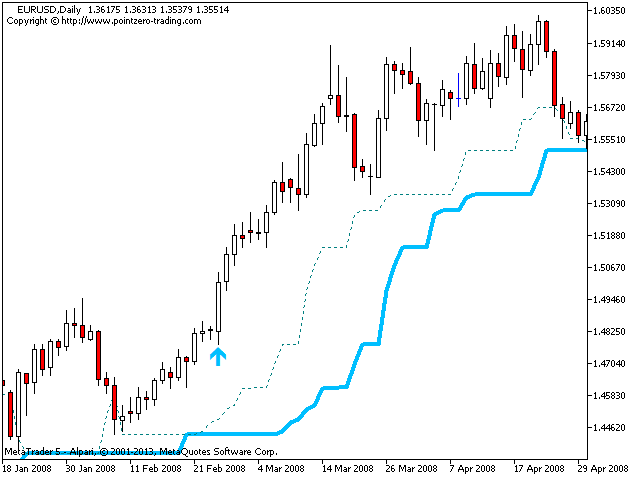
The Entry Strategy
The Turtles learned two breakout variants or "systems". System One (S1) used a 20-day price breakout for entry. However, the entry was filtered by a rule that was designed to increase the odds of catching a big trend, which states that a trading signal should be ignored if the last signal was profitable.
But this filter rule had a built-in problem. What if the Turtles skipped the entry breakout and that skipped breakout was the beginning of a huge and profitable trend that roared up or down? Not good to be on the sidelines with a market taking off!
If the Turtles skipped a System One 20-day breakout and the market kept trending, they could and would get back in at the System Two (S2) 55-day breakout. This fail-safe System Two breakout was how the Turtles kept from missing big trends that were filtered out.
The entry strategy using System Two is as follows:
- Buy a 55-day breakout if we are not in the market;
- Short a 55-day breakout if we are not in the market.
The entry strategy using System One is as follows:
- Buy a 20-day breakouts if last S1 signal was a loss;
- Short a 20-day breakouts if last S1 signal was a loss.
The Turtles calculated the stop-loss for all trades using the Average True Range of the last 30 days, a value which they called N. Initial stop-loss was always ATR(30) * 2, or in their words, two volatility units. Additionally, the Turtles would pile profits back into winning trades to maximize their winnings, commonly known as pyramiding. They could pyramid a maximum of 4 trades separated from each other by 1/2 volatility unit.
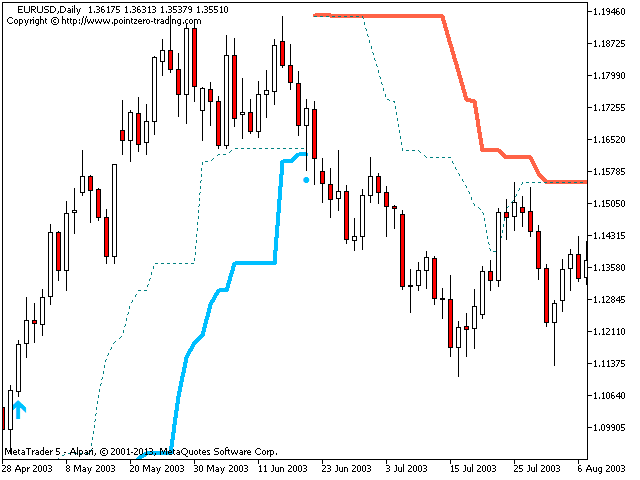
The Exit Strategy
The Turtles learned to exit their trades using breakouts in the opposite direction, which allowed them to ride very long trends.
The exit strategy using System Two is as follows:
- Exit long positions if/when the price touches a 20-day low
- Close shorts positions if/when the price touches a 20-day high
The exit strategy using System One is as follows:
- Close long positions if/when the price touches 10-day low
- Close short positions if/when the price touches a 10-day high
Input Parameters
- S1 Trade Period: Donchian breakout period to trade (system #1)
- S1 Stop Period: Donchian breakout period to exit trades (system #1)
- S2 Trade Period: Donchian breakout period to trade (system #2)
- S2 Stop Period: Donchian breakout period to exit trades (system #2)
- Drawing Settings: Customize colors and sizes for arrows.
- Alerts: This parameter block controls the indicator alerts.
Author
Arturo López Pérez, private investor and speculator, software engineer and founder of Point Zero Trading Solutions.


Great indicator, no issues with using, great developer and contributor aces!