Candle Absorption Demo
- インディケータ
- バージョン: 1.10
- アップデート済み: 10 5月 2021

This is a demo version of the Candle Absorption Full indicator. It has limitations on operation.
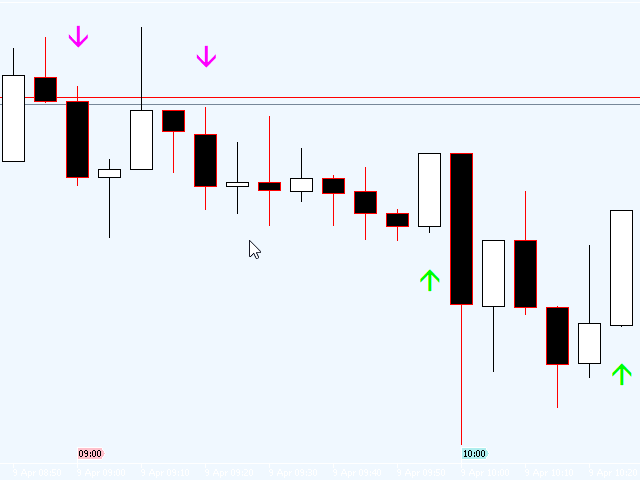
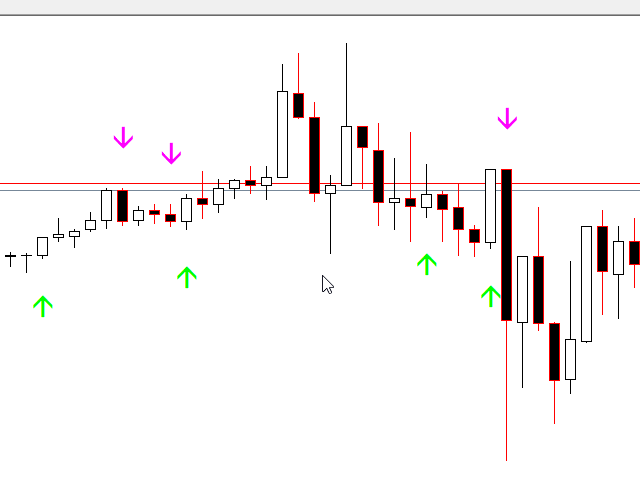
This indicator detects the Engulfing candlestick pattern and draws the corresponding market entry signal.
Features
- It works only with EURUSD on timeframes M1 and M5.
- The indicator analyzes a combination of 2 or 3 candlesticks depending on settings.
- The number of pre-calculated bars (signals) is configurable.
- The indicator can send an alert to notify of a found signal.
- Signal can be filtered by setting the number of candlesticks of the same color (trend) preceding the pattern formation.
- The indicator has an SMA based filter.
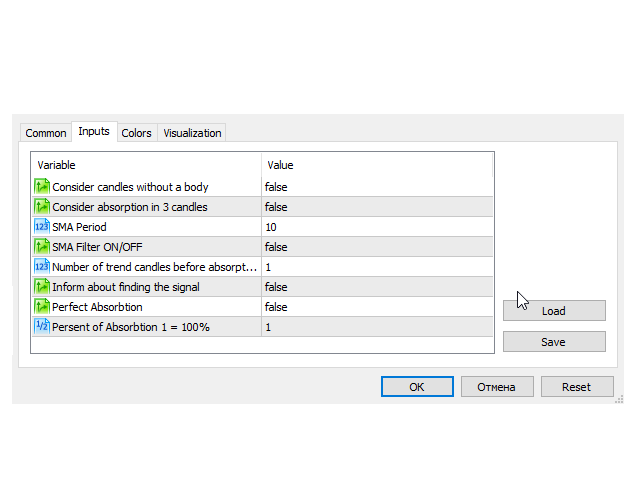
Input parameters
- Consider candles without a body - take the doji candlesticks (without the body) into account. The default is no.
- Consider absorption in 3 candles - take into account the engulfing of the second candlestick instead of the first one as is usually done. The default is no.
- SMA Period - moving average period
- SMA Filter ON/OFF - enable/disable the SMA filter
- Number of trend candles before absorption - additional filter. The number of candlesticks of the same color preceding the engulfing pattern. Default - 1.
- Inform about finding the signal - notification (Alert) of the found signal. The default is no.
- Perfect Absorption - enable/disable perfect absorption (when the body of the first candlestick is fully absorbed by the second candlestick)
- Persent of Absorption 1 = 100% - the minimum percent by which the second candlestick should be larger than the first one.

ユーザーは評価に対して何もコメントを残しませんでした