Stochastic RainBow 5
- インディケータ
-
Kourosh Hossein Davallou
 I have been programming in MetaTrade since 2005
 - バージョン: 1.0
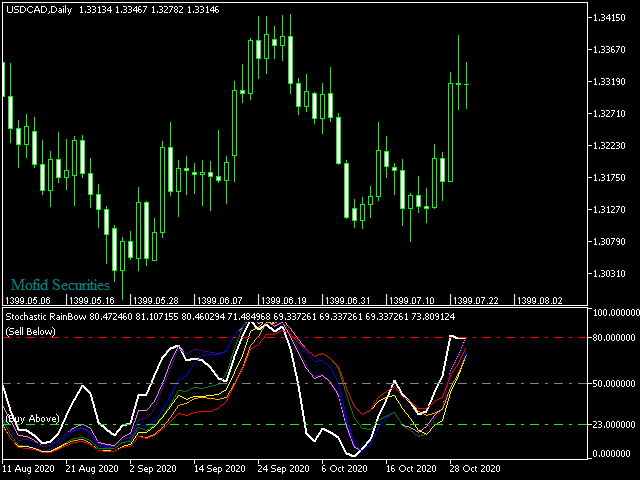
A stochastic oscillator is a momentum indicator comparing a particular closing price of a security to a range of its prices over a certain period of time. The sensitivity of the oscillator to market movements is reducible by adjusting that time period or by taking a moving average of the result. It is used to generate overbought and oversold trading signals, utilizing a 0-100 bounded range of values.
This indicator show 8 stochastic on one chart.


Интересно и , поэтому , надо протестить