Breakout trade
- インディケータ
-
Kourosh Hossein Davallou
 I have been programming in MetaTrade since 2005
 - バージョン: 2.2
- アップデート済み: 11 12月 2018
- アクティベーション: 5
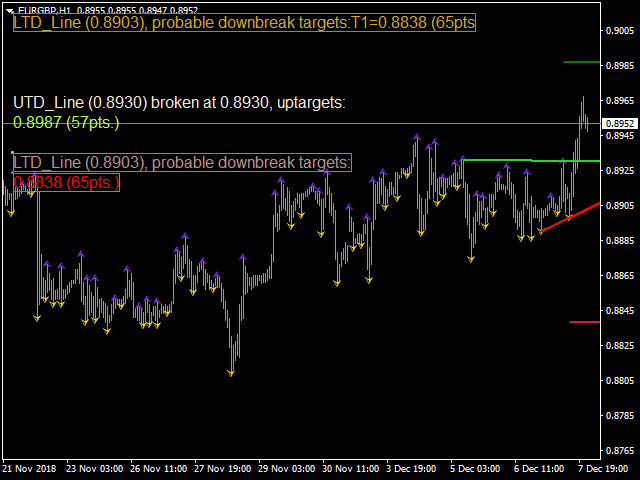
Breakout System
This indicator is based on the trend line and breakthrough.
Pair: EURUSD, GBPUSD. Timeframe: M15 Or H1.
Input Parameters
- AlertsOn - alert on or off.
- TrendLine - show trend line.
- TrendLineStyle - style of trend line.
- UpTrendColor - color of up trend.
- DownTrendColor - color of down trend.
- ShowTakeprofit - show take profits.
- ShowTakeprofitStyle - style of take profit.
- UpperTakeprofitColor - color of up take profit.
- LowerTakeprofitColor - color of down take profit.

ユーザーは評価に対して何もコメントを残しませんでした