Daily GBPUSD trade
- インディケータ
- バージョン: 1.33
- アップデート済み: 26 7月 2019
- アクティベーション: 5
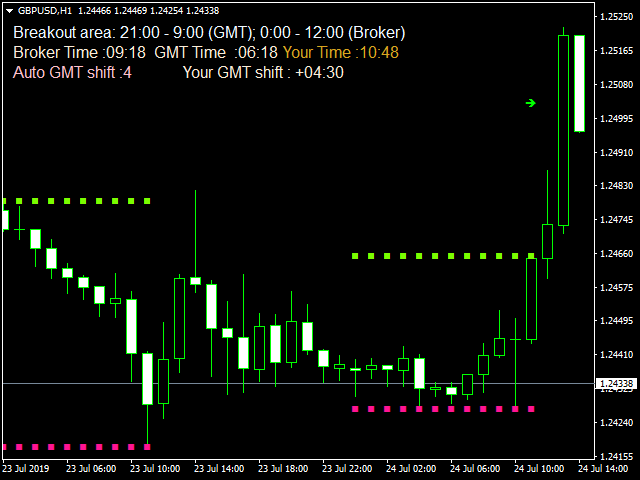
Our strategy relies on a choppy movement on most Forex pairs during the Asian session. Most traders in London sleep when the Sun shines over the Pacific and this results to a very slow movement of GBPUSD pair between 9:00 PM GMT and 7:00 AM GMT.
Buy order:
- Place a buy-stop order just five pip above the upper band.
- Place a stop loss just one pip below the lower band.
- Place a profit target at the upper LawnGreen Arrow.
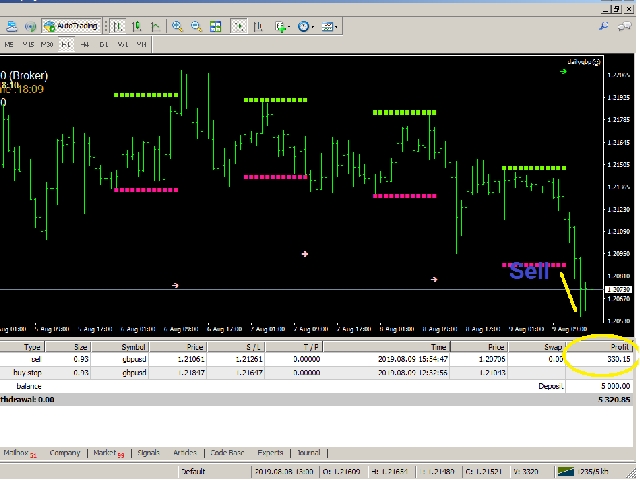
Sell order:
- Place a sell-stop order just five pip below the lower band.
- Place a stop loss just one pip above the upper band.
- Place a profit target at the lower Pink arrow.
Input Parameters:
- Auto Shift - false for setting the shift offset clock manually.
- Broker_GMT_Shift - for example, if it is GMT+1 (Central Europe), set Broker_GMT_Shift to 1.
- London_Night - 21:00 GBPUSD.
- London_Open - London session opens.
- Currency_Auto_Setup - you can trade other currency pairs. The appropriate times are set automatically.


ユーザーは評価に対して何もコメントを残しませんでした