Forex Tools X

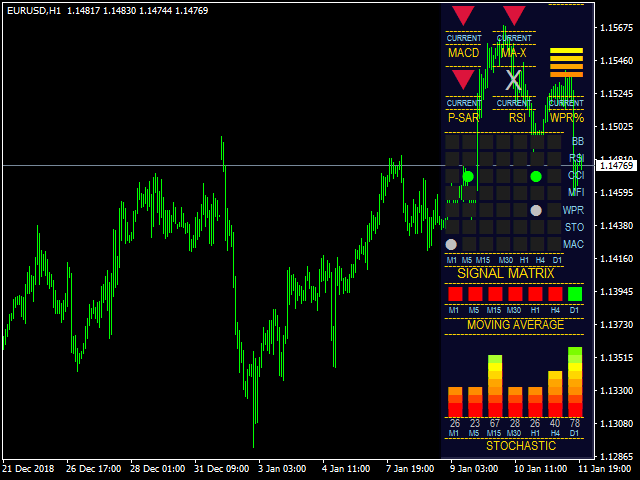
The indicator is based on several useful indicators in the multi time frames that help us chart and table and alert.


The various parameters used in this indicator and the default ones are as follows.

·    Moving Average Mode:    LMMA

·        Moving Average Period One:     4

·        Moving Average Period Two:     8

·        Moving Average Period Three:  15

·        Moving Average Period Four:    30

·        Moving Average Period Five:     80

·        Moving Average Period Six:      150

·        Moving Average Period Seven: 250

·        Included Parabolic SAR :           true

·        Included MA Xover:                    true

·        Included MACD:                         true

·        Included Moving Average:         true

·        Included Stochastic Oscillators: true

·        Included William's % Range:     true

·        Included Price Direction:            true

·        Included Moving Average M1:   false

·        Included Moving Average M5:   false

·        Included Moving Average M15: false

·        Included Moving Average M30: false

·        William's % Range BUY Level:  -80

·        William's % Range  Sell Level:  -20

·        Money Flow Index BUY Level:   20

·        Money Flow Index SELL Level: 80

·        CCI BUY Level:                          -100

·        CCI SELL  Level:                       100

·        RSI BUY Level                           30

·        RSI SELL Level                          70

·        Stochastic BUY level                  20

·        Stochastic SELL level                80

·        Bollinger Band Period:               20

·        Bollinger Band Deviation:          2

·        Stochastic K:                             14

·        Stochastic D:                             3

·        Stochastic Slowing:                   3

·        Parabolic SAR Step:                 0.02

·        Parabolic SAR Max:                  0.2

·        Trend Bar MA Method:              SMMA 

·        Trend Bar MA Period:               14

·        MACD Period one:                    14

·        MACD Period two:                     30

·        MACD Period three:                  10

·        Fast Moving Average:                3

·        FAST Moving Average Method LWMA

·        Slow Moving Average:               5

·        Moving Average Method:          SMMA


おすすめのプロダクト
Owl smart levels
Sergey Ermolov
4.24 (37)
MT5版  |   FAQ Owl Smart Levels Indicator   は、 Bill Williams   の高度なフラクタル、市場の正しい波構造を構築する Valable ZigZag、エントリの正確なレベルをマークする Fibonacci レベルなどの一般的な市場分析ツールを含む 1 つのインジケーター内の完全な取引システムです。 利益を得るために市場と場所に。 戦略の詳細な説明 インジケータを操作するための指示 顧問-取引助手 プライベートユーザーチャット ->購入後に私に書いて、私はプライベートチャットにあなたを追加し、あなたはそこにすべてのボーナスをダウンロードすることができます 力はシンプルさにあります! Owl Smart Levels   取引システムは非常に使いやすいので、専門家にも、市場を勉強し始めて自分で取引戦略を選択し始めたばかりの人にも適しています。 戦略と指標に秘密の数式や計算方法が隠されているわけではなく、すべての戦略指標は公開されています。 Owl Smart Levels を使用すると、取引を開始するためのシグナルをすばやく確認し、注
Crypto_Forex MT4 用インジケーター「モーニング スター パターン」 - インジケーター「モーニング スター パターン」は、プライス アクション トレーディングに非常に強力なインジケーターです。再描画なし、遅延なし。 - インジケーターは、チャート上で強気のモーニング スター パターンを検出します。チャート上の青い矢印信号 (画像を参照)。 - PC、モバイル、および電子メール アラート付き。 - また、その兄弟である弱気の「イブニング スター パターン」インジケーターも利用できます (以下のリンクに従ってください)。 - インジケーター「モーニング スター パターン」は、サポート/レジスタンス レベルと組み合わせるのに最適です。 高品質のトレーディングロボットとインジケーターをご覧になるにはここをクリックしてください! これは、この MQL5 Web サイトでのみ提供されるオリジナル製品です。
We present you the indicator "Candle closing counter", which will become your indispensable assistant in the world of trading. That’s why knowing when the candle will close can help: If you like to trade using candle patterns, you will know when the candle will be closed. This indicator will allow you to check if a known pattern has formed and if there is a possibility of trading. The indicator will help you to prepare for market opening and market closure. You can set a timer to create a pre
Super Reversal Pattern Indicator Unlock the power of advanced pattern recognition with our Super Reversal Pattern Indicator. Designed for traders seeking precision and reliability, this indicator identifies one of the most effective reversal patterns in technical analysis, offering a significant edge in your trading strategy. Key Features: Non-Repainting Accuracy: Enjoy the confidence of non-repainting technology. Once a Super Reversal Pattern is detected, it remains static, providing consiste
This is a trend indicator without redrawing Developed instead of the binary options strategy (by the color of the Martingale candlestick) Also works well in forex trading When to open trades (binary options) A signal will appear in the place with a candle signaling the current candle It is recommended to open a deal for one candle of the current timeframe M1 and M5 When a blue dot appears, open a deal up When a red dot appears, open a trade down. How to open trades on Forex. When a signal is rec
An indicator of pattern #31 ("Long Island") from Encyclopedia of Chart Patterns by Thomas N. Bulkowski. The second gap is in the opposite direction. Parameters: Alerts - show alert when an arrow appears   Push - send a push notification when an arrow appears (requires configuration in the terminal) GapSize - minimum gap size in points ArrowType - a symbol from 1 to 17 ArrowVShift - vertical shift of arrows in points   ShowLevels - show levels ColUp - color of an upward line ColDn - color of a
SMC Venom Model BPR インジケーターは、スマート マネー (SMC) コンセプトで取引するトレーダー向けのプロフェッショナル ツールです。価格チャート上の 2 つの主要なパターンを自動的に識別します。 FVG   (フェアバリューギャップ) は、3 本のローソク足の組み合わせで、最初のローソク足と 3 番目のローソク足の間にギャップがあります。ボリュームサポートのないレベル間のゾーンを形成し、価格修正につながることがよくあります。 BPR   (バランス価格範囲) は、2 つの FVG パターンの組み合わせで、「ブリッジ」を形成します。これは、価格がボリュームアクティビティの少ない動きで動くときに、ブレイクアウトしてレベルに戻るゾーンで、ローソク足の間にギャップを作成します。 これらのパターンは、大規模な市場プレーヤーと一般参加者の相互作用が発生するチャート上のボリュームと価格動向の分析に基づいて、トレーダーが主要なサポート/レジスタンス レベル、ブレイクアウト ゾーン、エントリ ポイントを識別するのに役立ちます。 インジケーターは、長方形と矢印の形でパターンを視
Noize Absorption Index - is the manual trading system that measures the difference of pressure between bears forces and bulls forces. Green line - is a noize free index that showing curent situation. Zero value of index shows totally choppy/flat market.Values above zero level shows how powerfull bullish wave is and values below zero measures bearish forces.Up arrow appears on bearish market when it's ready to reverse, dn arrow appears on weak bullish market, as a result of reverse expectation. S
これは、キャンドルの終値を予測する指標です。 このインジケータは、主にD1チャートでの使用を目的としていますが. この指標は、従来の外国為替取引とバイナリオプション取引の両方に適しています。 インジケーターは、スタンドアロンのトレーディングシステムとして使用することも、既存のトレーディングシステムへの追加として機能させることもできます。 このインジケーターは、現在のキャンドルを分析し、キャンドル自体の内部の特定の強度係数と、前のキャンドルのパラメーターを計算します。 したがって、この指標は、市場の動きのさらなる方向性と現在のキャンドルの終値を予測します。 この方法のおかげで、この指標は、短期の日中取引だけでなく、中期および長期の取引にも適しています。 インジケーターを使用すると、市場の状況の分析中にインジケーターが生成する潜在的な信号の数を設定できます。 インジケーターの設定には、このための特別なパラメーターがあります。 また、インジケーターは、チャート上のメッセージの形式で、電子メールで、およびPUSH通知の形式で、新しい信号について通知することができます。 購入後は必ず私に書いて
Wave WOLD MT4外国為替インジケータは、Wolf waveを検索し、取引端末の現在のウィンドウに表示するように設計されています。 取引でオオカミの波を使用するトレーダーのための優れた指標。 取引戦略への適用は、効率と収益性を大幅に向上させます。 指標に関する情報 他のWolf wave指標とは異なり、Wave WOLD MT4外国為替指標は、その有効性を大幅に高める多くの機能を備えています: 最初のものは開いているWindows5Pointパラメータ(真の値)情報サポートを提供します。つまり、Wolf waveが登場したチャートのウィンドウを展開します。 たとえば、EURUSD、AUDUSD、GBPUSDチャートが開いていて、それぞれにWave WOLD MT4インジケーターがインストールされている場合、ユーロモデルが検出されると、対応するチャートが自動的に他のチャートの上に前景に表示され、多数の商品を取引するときに非常に便利になります。  2番目の機能は、ユーザーが自分で選択できるパラメータ(デフォルト設定(12,26,9))であるmacd上の組み込みの発散分析です。
「Auto FIBO Pro」Crypto_Forex インジケーターは、取引の補助ツールとして最適です。 - インジケーターは、フィボナッチ レベルとローカル トレンド ライン (赤色) を自動的に計算してチャート上に配置します。 - フィボナッチ レベルは、価格が反転する可能性のある重要な領域を示します。 - 最も重要なレベルは、23.6%、38.2%、50%、61.8% です。 - リバーサル スキャルピングやゾーン グリッド取引に使用できます。 - Auto FIBO Pro インジケーターを使用して、現在のシステムを改善する機会も多数あります。 - Info Spread Swap Display があり、接続されている外国為替ペアの現在のスプレッドとスワップを表示します。 - ディスプレイには、アカウントの残高、エクイティ、マージンも表示されます。 - Info Spread Swap Display は、チャートのどのコーナーにも配置できます。 0 - 左上コーナー、1 - 右上、2 - 左下、3 - 右下。 高品質のトレーディングロボットとインジケーターをご覧にな
TWO PAIRS SQUARE HEDGE METER INDICATOR Try this brilliant 2 pairs square indicator It draws a square wave of the relation between your two inputs symbols when square wave indicates -1 then it is very great opportunity to SELL pair1 and BUY Pair2 when square wave indicates +1 then it is very great opportunity to BUY pair1 and SELL Pair2 the inputs are : 2 pairs of symbols         then index value : i use 20 for M30 charts ( you can try other values : 40/50 for M15 , : 30 for M30 , : 10 for H1 ,
Trade with Gann on your side!! MASTER CIRCLE 360 CIRCLE CHART, originally created by Gann admitted that this is “The Mother of all charts”. It is one of the last studies that this great trader left for us. The numeric tab le is apparently quite simple like all the tables and is based on square numbers, the SQUARE OF 12 and is by evolution, one of the most important square numbers. Here we can find CYCLE, PRICE AND TIME thanks to angles and grades, to show past and future support and resistance.
The Th3Eng PipFinite indicator is based on a very excellent analysis of the right trend direction with perfect custom algorithms. It show the true direction and the best point to start trading. With StopLoss point and Three Take Profit points. Also it show the right pivot of the price and small points to order to replace the dynamic support and resistance channel, Which surrounds the price. And Finally it draws a very helpful Box on the left side on the chart includes (take profits and Stop loss
"The trend is your friend" is one of the best known sayings in investing, because capturing large trendy price movements can be extremely profitable. However, trading with the trend is often easier said than done, because many indicators are based on price reversals not trends. These aren't very effective at identifying trendy periods, or predicting whether trends will continue. We developed the Trendiness Index to help address this problem by indicating the strength and direction of price trend
Heiken Ashi candle chart is an improved version of The Japanese candle chart, which can effectively filter the market "noise" of the Japanese candle chart. It is favored by many traders for its simplicity and intuition. For trend traders, the HA candle chart is a magic tool. Unlike the traditional Japanese candle chart, Heikenashi does not reflect the opening price, high price, low price and closing price of the market. Instead, Heikenashi calculates the value of a single K line in the dominant
Title : Market Bias Indicator - Oscillator-Based Trading Tool Introduction : Discover the potential of the "Market Bias Indicator," a revolutionary oscillator-based trading tool designed for precise market analysis. If you're in search of a robust alternative to traditional bias indicators, your quest ends here. Market Bias Indicator offers unparalleled accuracy in identifying market sentiment and is your gateway to confident trading decisions. Recommended Trading Pairs : Market Bias Indicator i
これはほぼ間違いなく、MetaTraderプラットフォームで見つけることができる最も完全な調和価格形成自動認識インジケーターです。 19種類のパターンを検出し、フィボナッチプロジェクションをあなたと同じように真剣に受け止め、潜在的逆転ゾーン(PRZ)を表示し、適切なストップロスとテイクプロフィットレベルを見つけます。 [ インストールガイド | 更新ガイド | トラブルシューティング | よくある質問 | すべての製品 ] 19の異なる調和価格形成を検出します プライマリ、派生および補完フィボナッチ投影(PRZ)をプロットします 過去の価格行動を評価し、過去のすべてのパターンを表示します この指標は、独自の品質とパフォーマンスを分析します 適切なストップロスとテイクプロフィットのレベルを表示します ブレイクアウトを使用して適切な取引を通知します すべてのパターン比をグラフにプロットします 電子メール/音声/視覚アラートを実装します スコット・M・カーニーの本に着想を得て、この指標は最も純粋で急を要するトレーダーのニーズを満たすように設計されています。ただし、トレードを容易にする
Trend indicator with calculation of dynamic levels and signaling their intersection. Description of input parameters: StepTF = true; - Calculation of the indicator by closing the bar (true) or by each tick (false) BarsCount = 300; - Number of settlement bars Price = PRICE_CLOSE; - Type of price used TimeFrame = PERIOD_CURRENT; - Estimated timeframe TrendPeriod = 9; - Trend calculation period TrendDeviations = 4.9; - coefficient of deviation PeriodTrendSmooth = 1; - Trend smoothing perio
The indicator displays the data of the Stochastic oscillator from a higher timeframe on the chart. The main and signal lines are displayed in a separate window. The stepped response is not smoothed. The indicator is useful for practicing "manual" forex trading strategies, which use the data from several screens with different timeframes of a single symbol. The indicator uses the settings that are identical to the standard ones, and a drop-down list for selecting the timeframe. Indicator Paramet
What are Heiken Ashi Candles? Heiken Ashi, derived from the Japanese term 'Heikin Ashi,' translates to average price bars. It's an indicator depicting price bars on a chart. Formula for Heiken Ashi candles: - Heiken Ashi opening price: (previous candle's opening + closing price) / 2 - Closing price Heiken Ashi: (opening + high + low + closing) / 4 - Heiken Ashi peak: Max of high, opening, or closing price - Heiken Ashi bottom price: Min of low, opening, or closing price How to Read Heiken A
トレンドオシレーターは、高度なカスタム Crypto_Forex インジケーター、効率的な取引ツールです! - 高度な新しい計算方法を使用 - パラメーター「計算価格」のオプションは 20 種類。 - これまで開発された中で最もスムーズなオシレーター。 - 上昇トレンドの場合は緑色、下降トレンドの場合は赤色。 - 売られすぎの値: 5 未満、買われすぎの値: 95 以上。 - このインジケーターを使用すると、標準戦略をアップグレードする機会が十分にあります。 - PC およびモバイルアラート付き。 高品質のトレーディングロボットとインジケーターをご覧になるにはここをクリックしてください! これは、この MQL5 Web サイトでのみ提供されるオリジナル製品です。
Crypto_Forex インジケーター   PINBAR パターン MT4用。リペイントなし、遅延なし。 - インジケーター「PINBARパターン」は、プライスアクション取引に非常に強力なインジケーターです。 - インジケーターはチャート上のピンバーを検出します。 - 強気のピンバー - チャート上に青い矢印シグナルを表示します(画像参照)。 - 弱気のピンバー - チャート上に赤い矢印シグナルを表示します(画像参照)。 - PC、モバイル、メールアラート機能付き。 - インジケーター「PINBARパターン」は、サポート/レジスタンスレベルと組み合わせるのに最適です。 高品質のトレーディングロボットとインジケーターをご覧になるにはここをクリックしてください! これは、このMQL5ウェブサイトでのみ提供されるオリジナル製品です。
The Sextet Scalper Pro  is an MT4 indicator that gives signals when new waves are starting in a trend. The trends are calculated using the original " The Sextet " indicator method. You get a free EA to trade with The Sextet Scalper Pro: Free EA . Default settings were optimized on GBPUSD H1 from 2017. EA could be tested on free demo version of The Sextet Scalper Pro, before purchase. Key Features: Uses The Sextet Trend Detection Method which is already a good strategy in itself for detecting lo
This unique multi-currency strategy simultaneously determines the strength of trends and market entry points, visualizing this using histograms on the chart. The indicator is optimally adapted for trading on the timeframes М5, М15, М30, Н1. For the convenience of users, the indicator renders the entry point (in the form of an arrow), recommended take profit levels (TP1, TP2 with text labels) and the recommended Stop Loss level. The take profit levels (TP1, TP2) are automatically calculated for
フィボナッチリトレースと拡張ラインツール DiNapoliポイント取引方法とゴールデンセクション取引を使用するトレーダーにとって理想的なMT4プラットフォームのフィボナッチリトレースと拡張ラインツール 主な特長: あなたはフィボナッチリトレースメントの複数のセットを直接描くことができ、重要なリターンポイント間の関係は一目瞭然です。 2.フィボナッチ拡張を描画することができます。 3.フィボナッチフォールドバックとラインの延長は、簡単な観察と数値表示のために左右に動かすことができます。 4.チャートは非常に爽やかな 5.数字キーでサイクルを切り替えることができます。 ファンクションキー: 1。 [戻るを押す、要求に応じて描画する、最大8つのグループにする 2。拡張]を描くには[押す] 3。 \を押すと、現在のサイクルの下にあるすべての拡張機能と折り畳みが削除されます 4。フォールドバックを移動して削除して展開する (1)最初のフォールドバックセットのF5行をクリックします。 一度クリックすると(黄色に変わります)、キーボードのDeleteキーを押すと、フォーカ
The Stepping Trend Indicator     The Steppi ng Trend indicator uses the  average true range  (ATR indicator) in its calculation. This gives you control to set your own average true range period, I set the Default as 10.   Indicator Details. Green Arrow Up: This means you are at the starting point of a new bullish trend, it’s time to buy.   Red  Arrow  Down : This means you are at the starting point of a new  bearish  trend, it’ s time to sell .   What if you miss the Arrow Signal?   No prob
Break Moment
Svyatoslav Kucher
5 (2)
Break Moment is a unique proprietary indicator with extensive capabilities and a variety of settings. It can be used as a signal generator or as an auxiliary tool. For the calculations, the price channel is determined. When it is broken, if all conditions of the additional filter are met, it displays a signal in the form of a histogram. Break Moment can be used to determine the main trend, as it has 2 filters for determining it in addition to everything else. If these filters are activated, the
数列の一つに「森林火災数列」があります。これは、最も美しい新しいシーケンスの 1 つとして認識されています。その主な特徴は、このシーケンスが線形トレンドを回避することです。最短のものであってもです。この指標の基礎を形成したのはこのプロパティです。 財務時系列を分析する場合、この指標は可能なすべての傾向オプションを拒否しようとします。そして失敗した場合にのみ、トレンドの存在を認識し、適切なシグナルを発します。このアプローチにより、新しいトレンドの始まりの瞬間を正しく判断できます。ただし、偽陽性の可能性もあります。それらの数を減らすために、このインジケーターに追加のフィルターが追加されました。新しいバーが開くとシグナルが生成されます。いずれの場合も再描画は発生しません。 指標パラメータ: Applied Price - 適用価格定数; Period Main - インディケータのメイン期間、その有効な値は 5 ~ 60 です。 Period Additional - 追加の期間。このパラメーターの有効な値は 5 ~ 40 です。 Signal Filter - 追加の信号フィルター、有効
Signal trend indicator. Detects the direction of the trend and is coloured accordingly.  Has built in audible and visual alerts when trends change. Can send notifications to your phone or email. Allows Trend and Counter-Trend trading. Works on all timeframes, all currency pairs, metals, indices and cryptocurrencies. Can be used with binary options. Distinctive features No re-drawing; Simple and clear settings; Four types of alerts; Works on all timeframes and all trading tools; Suitable
このプロダクトを購入した人は以下も購入しています
Gann Made Easy は、ミスター・ギャンの理論を使用した取引の最良の原則に基づいた、プロフェッショナルで使いやすい外国為替取引システムです。 W・D・ガン。このインジケーターは、ストップロスとテイクプロフィットレベルを含む正確な買いと売りのシグナルを提供します。 PUSH通知を利用して外出先でも取引可能です。 購入後に私に連絡して、取引のヒント、ボーナス、および「GANN MADE EASY」EA アシスタントを無料で入手してください。 おそらく、ギャンの取引手法についてはすでに何度も聞いたことがあるでしょう。通常、ギャンの理論は初心者のトレーダーだけでなく、すでにある程度の取引経験がある人にとっても非常に複雑なものです。なぜなら、ギャンの取引手法は理論的にはそれほど簡単に適用できるものではないからです。私はその知識を磨き、最良の原則を私の外国為替インジケーターに組み込むために数年を費やしました。 このインジケーターは非常に簡単に適用できます。必要なのは、それをチャートに添付し、簡単な取引推奨事項に従うだけです。このインジケーターは常に市場分析の仕事を行い、取引の機会を探しま
NEW YEAR 2026 SALE OFFER PRICE AT JUST 99 DOLLARS FEW COPIES ONLY AT This price From 10th Jan -20th Jan MIDNIGHT Final offer GRAB YOUR COPY ON THIS New Year EVE Prices will be increased to 150 after the offer period ends Full Fledged EA and Alert plus for alerts will also be provided in this offer along with the purchase of Indicator. Limited copies only at this price and Ea too. Grab your copy soon Alert plus for indicator with set file is kept in comment section with the image  SMC Blast Signa
An exclusive indicator that utilizes an innovative algorithm to swiftly and accurately determine the market trend. The indicator automatically calculates opening, closing, and profit levels, providing detailed trading statistics. With these features, you can choose the most appropriate trading instrument for the current market conditions. Additionally, you can easily integrate your own arrow indicators into Scalper Inside Pro to quickly evaluate their statistics and profitability. Scalper Inside
現在20%OFF! 初心者やエキスパートトレーダーのためのベストソリューション! このダッシュボードソフトウェアは、28の通貨ペアで動作しています。それは私達の主要な指標(高度な通貨の強さ28と高度な通貨インパルス)の2に基づいています。それは全体の外国為替市場の大きい概観を与えます。それは、すべての(9)時間枠で28の外国為替ペアのための高度な通貨の強さの値、通貨の動きの速度と信号を示しています。チャート上で1つのインディケータを使用して市場全体を観察し、トレンドやスキャルピングの機会をピンポイントで見つけることができたら、あなたのトレードがどのように改善されるか想像してみてください。 このインディケータには、強い通貨と弱い通貨の識別、潜在的な取引の識別と確認がより簡単になるような機能が搭載されています。このインディケータは、通貨の強さや弱さが増加しているか減少しているか、また、すべての時間枠でどのように機能しているかをグラフィカルに表示します。 新機能として、現在の市場環境の変化に適応するダイナミックなマーケットフィボナッチレベルが追加され、すでに当社のAdvanced
M1 Sniper
Oleg Rodin
4.89 (18)
M1 SNIPER は使いやすいトレーディングインジケーターシステムです。M1時間足向けに設計された矢印インジケーターです。M1時間足でのスキャルピングのためのスタンドアロンシステムとして、また既存のトレーディングシステムの一部としても使用できます。このトレーディングシステムはM1時間足での取引に特化して設計されていますが、他の時間足でも使用できます。元々、この手法はXAUUSDとBTCUSDの取引用に設計しましたが、他の市場においても役立つと考えています。 インジケーターのシグナルは、トレンドの方向と逆方向に取引できます。インジケーターのシグナルを利用して両方向に取引するのに役立つ特別な取引テクニックをご紹介します。この手法は、特別な動的なサポートとレジスタンスの価格帯を利用することに基づいています。 ご購入後、M1 SNIPER矢印インジケーターをすぐにダウンロードできます。さらに、M1 SNIPERツールのすべてのユーザーに、以下のスクリーンショットに表示されているApollo Dynamic SRインジケーターを無料で提供しています。この2つのインジケーターを組み合わせることで
First 25 copies at $80, after that price becomes $149 (13 copies left) Gold Signal Pro is a powerful MT4 indicator designed to help traders spot strong price reactions in the market. It focuses on clear wick rejections , showing when price strongly rejects a level and often continues in the same direction. Gold Signal Pro is mainly built for scalping gold (XAUUSD) and works best on lower timeframes like M5 and M15 , where timing matters most. That said, it can also be used on any forex pair,
GOLD Impulse with Alert
Bernhard Schweigert
4.64 (11)
このインディケータは、当社の2つの製品 Advanced Currency IMPULSE with ALERT  +   Currency Strength Exotics . のスーパーコンビネーションです。 このインジケーターは全ての時間枠で作動し、8つの主要通貨と1つのシンボルの強弱のインパルスをグラフで表示します。 このインジケータは、金、エキゾチックペア、商品、インデックス、先物など、あらゆるシンボルの通貨強度の加速度を表示することに特化されています。金、銀、原油、DAX、US30、MXN、TRY、CNHなどの通貨強度の加速度(インパルスまたは速度)を表示するために、任意のシンボルを9行目に追加できる、この種の最初のものです。 新しいアルゴリズムに基づいて構築され、潜在的な取引の特定と確認がさらに容易になりました。これは、通貨の強さや弱さが加速しているかどうかをグラフィカルに表示し、その加速の速度を測定するためです。加速すると物事は明らかに速く進みますが、これはFX市場でも同じです。つまり、反対方向に加速している通貨をペアリングすれば、潜在的に利益を生む取引を特定
Volatility Trend System - a trading system that gives signals for entries. The volatility system gives linear and point signals in the direction of the trend, as well as signals to exit it, without redrawing and delays. The trend indicator monitors the direction of the medium-term trend, shows the direction and its change. The signal indicator is based on changes in volatility and shows market entries. The indicator is equipped with several types of alerts. Can be applied to various trading ins
Trend indicator AI
Ramil Minniakhmetov
4.95 (76)
Trend Ai indicatorは、トレンドの識別と実用的なエントリポイントと反転アラートを組み合わせることで、トレーダーの市場分析を強化する優れたツールです。 この指標は、ユーザーが自信と正確さで外国為替市場の複雑さをナビゲートすることを可能にします トレンドAiインジケーターは、主要なシグナル以外にも、プルバックやリトレースメント中に発生するセカンダリエントリポイントを識別し、トレーダーが確立されたトレンド内の価格修正を活用できるようにします。 重要な利点: *MT4およびMT5の仕事 *明確な買いまたは売りシグナル *再描画しません ·すべての資産で動作します 私はeaやセットをtelegram it詐欺で販売しないように注意してください。 すべての設定はここでブログで無料です。  重要! 指示とボーナスを得るために購入後すぐに私に連絡してください! 私の他のプロダクトと同様、実質操作の監視はここに見つけることができます: https://www.mql5.com/en/users/mechanic/seller&nbsp ; 設定および入力: すべての
FX Volume
Daniel Stein
4.63 (38)
FX Volume:ブローカー視点で捉える本物の市場センチメント クイック概要 トレード手法をさらに高めたいとお考えですか? FX Volume は、リテールトレーダーやブローカーのポジション状況をリアルタイムで提供します。これは、COTのような遅延レポートよりもはるかに早く知ることができます。安定した利益を目指す方も、さらなる優位性を求める方も、 FX Volume は大きな不均衡を見極め、ブレイクアウトを確認し、リスク管理を洗練させるのに役立ちます。今すぐ始めて、実際の出来高データがどのように意思決定を変革するかを体感してください! 1. FX Volume がトレーダーにとって非常に有益な理由 高精度の早期警戒シグナル • 各通貨ペアを売買しているトレーダー数を、他者よりも早く、ほぼリアルタイムで把握できます。 • FX Volume は、複数のリテールブローカーから得られる本物の出来高データを収集し、分かりやすい形式で提供する 唯一 のツールです。 強力なリスク管理 • ロングやショートの大きな偏り(インバランス)を特定し、潜在的なトレンド転換を見逃しません。ストップ
Miraculous Indicator – ガン・スクエア・オブ・ナインに基づく100%非リペイントのFXおよびバイナリーツール この動画では、FXおよびバイナリーオプションのトレーダー向けに特別に開発された、非常に正確で強力な取引ツールである Miraculous Indicator を紹介しています。このインジケーターがユニークなのは、伝説的な ガン・スクエア・オブ・ナイン と ガンの振動の法則 に基づいている点で、現代の取引で利用できる最も正確な予測ツールの一つとなっています。 Miraculous Indicatorは 完全に非リペイント であり、ローソク足が確定した後にシグナルが変化したり消えたりすることはありません。つまり、見たものがそのまま利用できます。これにより、トレーダーは自信を持ってエントリーおよびエグジットを行うための信頼性と一貫性のある根拠を得ることができます。 主な特徴: ガン・スクエア・オブ・ナインとガン理論に基づいて構築 100%非リペイントのシグナルシステム すべての時間枠(M1、M5、H1、H4、日足、週足)で機能 FXおよびバイナリーオプション取引
Trend Screener
STE S.S.COMPANY
4.79 (95)
トレンドインジケーター、1つのツールに組み込まれたすべての重要なトレンド機能を備えたトレンドトレーディングとフィルタリングのための画期的なユニークなソリューション! これは、すべてのシンボル/商品(外国為替、商品、暗号通貨、インデックス、株式)で使用できる100%再描画されていないマルチタイムフレームおよびマルチ通貨インジケーターです。 期間限定オファー: サポートおよびレジスタンス スクリーナー インジケーターは、たった 50 ドルで永久的にご利用いただけます。(元の価格 250 ドル) (オファー延長) トレンドスクリーナーは、チャート内のドットで矢印トレンドシグナルを提供するインジケーターに続く効率的なインジケーターです。 トレンド分析インジケーターで使用できる機能: 1.トレンドスキャナー。 2.最大利益分析を備えたトレンドライン。 3.トレンド通貨強度メーター。 4.アラート付きのトレンド反転ドット。 5.アラート付きの強いトレンドドット。 6.トレンド矢印 毎日の分析例、毎日のシグナルパフォーマンス...など、トレンドスクリーナーインジケーターを使用して、ここで見つけること
まず第一に、この取引インジケーターは再描画されず、再描画されず、遅延しないことを強調する価値があります。これにより、手動取引とロボット取引の両方に理想的なものになります。 ユーザーマニュアル:設定、入力、戦略。 アトミックアナリストは、価格の強さとモメンタムを利用して市場でより良いエッジを見つけるためのPA価格アクションインジケーターです。ノイズや誤ったシグナルを除去し、取引ポテンシャルを高めるための高度なフィルターを備えています。複雑なインジケーターの複数のレイヤーを使用して、アトミックアナリストはチャートをスキャンし、複雑な数学的計算をシンプルなシグナルと色に変換します。これにより、どのような初心者トレーダーでも理解して使用し、一貫した取引の決定を行うことができます。 「アトミックアナリスト」は、新規および経験豊富なトレーダー向けにカスタマイズされた包括的な取引ソリューションです。プレミアムインジケーターとトップノッチの機能を1つの取引戦略に組み合わせ、すべてのタイプのトレーダーにとって汎用性のある選択肢にします。 デイリートレーディングとスキャルピング戦略:高速で正確な
Apollo SR Master は、サポート/レジスタンスゾーンを利用した取引をより容易かつ確実にする特別な機能を備えたサポート/レジスタンスインジケーターです。このインジケーターは、ローカル価格の高値と安値を検出することで、タイムラグなしでリアルタイムにサポート/レジスタンスゾーンを計算します。そして、新たに形成されたSRゾーンを確認するために、インジケーターは特別なシグナルを表示します。このシグナルは、SRゾーンを実際の売りまたは買いシグナルとして考慮して使用できることを示します。この場合、SRゾーンの強度が高まり、SRエリアからの取引が成功する確率も高まります。これがこのインジケーターの基本的な考え方です。 SRゾーンは、ストップロスとテイクプロフィットの設定を容易にします。シグナルの方向に応じて、SRゾーンの上または下のスペースをストップロスとして設定できます。さらに、反対側のSRゾーンは、潜在的なテイクプロフィットエリアとして設定できます。 また、Apollo SRマスターインジケーターをご利用のすべてのユーザーには、「Apollo Price Action System」
現在20%OFF! 初心者やエキスパートトレーダーに最適なソリューションです。 このインディケータは、エキゾチックペア・コモディティ・インデックス・先物など、あらゆるシンボルの通貨の強さを表示することに特化したインディケータです。金、銀、原油、DAX、US30、MXN、TRY、CNHなどの通貨の強さを表示するために、9行目にどのシンボルでも追加することができます。独自の機能を多数搭載し、新しい計算式を採用したため、ユニークで高品質、かつ手頃な価格のトレーディングツールとなっています。新しいトレンドやスキャルピングチャンスのトリガーポイントを正確に把握することができるため、あなたのトレードがどのように改善されるか想像してみてください。 ユーザーマニュアル:ここをクリック   https://www.mql5.com/en/blogs/post/708876 すべての時間枠に対応します。あなたはすぐにトレンドを見ることができるようになります! 新しいアルゴリズムに基づいて設計されているため、潜在的な取引の特定と確認がより簡単になります。これは、8つの主要通貨と1つのシンボルの強弱
Slayer Scalping
Abdulkarim Karazon
5 (2)
この指標は2つの利益確定レベルと非常に厳しいストップロスに焦点を当てており、m15以降の高時間枠で市場をスカルプすることを目指しています。これらの時間枠はスプレッドやブローカーの手数料の影響をあまり受けません。価格ダイバージェンス戦略に基づく買い/売りシグナルを提示し、強気のダイバージェンス条件が完全に満たされた際に買い矢印とtp/slレベルをプロットします。売り矢印も同様で、矢印はローソク足の終値に印刷され、ライブで再塗装されず、一部のシグナルはやや遅れて現れ、インジケーターに無視されてアラートを出しません。これは特定の市場状況(高いボラティリティやニュースの影響)におけるダイバージェンスの性質だからです。 なぜそれが機能するのか? .各信号の背後に良い戦略があります 。ライブで塗り直す必要はありません。 .どのペアでも使えます。 .安定したパフォーマンスを提供 おすすめ : 。より長い期間の使用 。インジケーターの主な周期を変えると信号の品質が変わります。入力は1つなので、各ペアの最適な周期を探してください 。高スプレッドの取引は避けてください。生のスプレッドアカウントを
Dynamic Forex28 Navigator - 次世代の Forex 取引ツール。 現在 49% オフ。 Dynamic Forex28 Navigator は、長年人気のインジケーターを進化させたもので、3 つの機能を 1 つにまとめています。 Advanced Currency Strength28 インジケーター (レビュー 695 件)  + Advanced Currency IMPULSE with ALERT (レビュー 520 件) + CS28 コンボ シグナル (ボーナス)。 インジケーターの詳細 https://www.mql5.com/en/blogs/post/758844 次世代の Strength インジケーターが提供するもの  オリジナルで気に入っていたすべての機能が、新機能と精度の向上によって強化されました。 主な機能: 独自の通貨強度計算式。 すべての時間枠でスムーズかつ正確な強度ライン。 トレンドの特定と正確なエントリーに最適です。 ダイナミックマーケットフィボナッチレベル (マーケットフィボナッチ)。 このインジケーターに固有
FX Power: 通貨の強弱を分析して、より賢い取引を実現 概要 FX Power は主要通貨と金の実際の強弱をあらゆる市場状況で理解するための必須ツールです。強い通貨を買い、弱い通貨を売ることで、 FX Power は取引の意思決定を簡素化し、高い確率の取引機会を見出します。トレンドを追従する場合でも、極端なデルタ値を使用して反転を予測する場合でも、このツールはあなたの取引スタイルに完全に適応します。ただ取引するだけではなく、 FX Power で賢く取引をしましょう。 1. なぜ FX Power がトレーダーにとって非常に有益なのか 通貨と金のリアルタイム強弱分析 • FX Power は主要通貨と金の相対的な強弱を計算し、マーケットダイナミクスに関する明確な洞察を提供します。 • どの資産がリードしているか、または後れを取っているかを監視して、取引するペアを賢く選びましょう。 マルチタイムフレームの包括的なビュー • 短期、中期、長期のタイムフレームで通貨と金の強弱を追跡し、マーケットトレンドに基づいて取引戦略を調整できます。 • スキャルピングからスイングトレード
トレンドラインプロ   市場の真の方向転換点を理解するのに役立ちます。この指標は、真のトレンド反転と主要プレーヤーが再び参入するポイントを示します。 分かりますか     BOSライン   複雑な設定や不要なノイズなしに、より長い時間足でのトレンドの変化と重要なレベルを把握できます。シグナルは再描画されず、バーが閉じた後もチャート上に残ります。 インジケーターが示す内容: 本当の変化   トレンド(BOSライン) 一度シグナルが現れたら、それは有効です!これは、リペイント機能を持つインジケーターとの重要な違いです。リペイント機能を持つインジケーターは、シグナルを発した後、それを変更し、資金の損失につながる可能性があります。これにより、より高い確率と精度で市場に参入できます。また、矢印が現れた後、目標値(利益確定)に達するか、反転シグナルが現れるまで、ローソク足の色を変更する機能もあります。 繰り返しエントリ       主要プレーヤーの補充 エントリーポイントを探す際の視覚的な明瞭性を向上させるため、最適な市場エントリーポイントが検索されるBUY/SELLゾーンを最初に表示するモジュ
現在20%OFF! このダッシュボードは、複数のシンボルと最大9つのタイムフレームで動作するソフトウェアの非常に強力な部分です。 このソフトは、弊社のメインインジケーター(ベストレビュー:Advanced Supply Demand)をベースにしています。    Advanced Supply Demand ダッシュボードは、素晴らしい概要を提供します。それは示しています。  ゾーン強度評価を含むフィルタリングされた需給値。 ゾーン内/ゾーンへのPips距離。 ネストされたゾーンがハイライトされます。 選択されたシンボルの4種類のアラートを全ての(9)時間枠で提供します。 それはあなたの個人的なニーズに合わせて高度に設定可能です。 あなたの利益! すべてのトレーダーにとって最も重要な質問です。 市場に参入するのに最適なレベルはどこか? 成功のチャンスとリスク/リターンを得るために、強力な供給/需要ゾーン内またはその近くで取引を開始します。 損切りの最適な位置はどこですか? 最も安全なのは、強力な供給/需要ゾーンの下/上にストップを置くことです。 最適な利益
Slayer Binary
Abdulkarim Karazon
5 (1)
スレイヤーバイナリーは、1キャンドルストライク矢印インジケーターのバイナリーオプションです。この指標は、聖杯を求める人向けではなく、一般的な取引に対して非現実的なアプローチです。この指標は一定のヒット率を示し、資金管理と日々の目標と組み合わせて使えば、さらに信頼性が高まります。インジケーターには以下に記載される多くの機能が備わっています: 特徴 再塗装なし:インジケーターは矢印をライブで再塗装しません。一度矢印が出ると、価格が逆方向に動いても矢印はその位置に留まります。 統計パネル:総合勝率%や最大損失勝ちシグナルなどの指標パフォーマンス統計を表示するパネル ダイバージェンスに基づく実証済み論理:この指標はダイバージェンス戦略を用いて売買矢印を決定します。 6つ以上の追加フィルター:インジケーターには勝率を上げ、無限のコンボを試せるための多数の追加フィルターがあります。 どうやってトレードするの? 単純に上向き矢印が出たときにコール/買いを開き、その期間の次のローソク足で取引を閉じればいいだけです...売却/プットシグナルも逆です。 日々の目標、例えば3勝者を挙げてから取引を停止す
市場の2つの基本原則に基づく日中戦略。 このアルゴリズムは、追加のフィルターを使用したボリュームと価格の波の分析に基づいています。インディケータのインテリジェントアルゴリズムは、2つの市場要因が1つに結合した場合にのみシグナルを出します。インディケータは、より高い時間枠のデータを使用して、M1チャート上の特定の範囲の波を計算します。そして波を確認するために、インジケーターはボリュームによる分析を使用します。 このインディケータはレディトレーディングシステムです。トレーダーが必要とするのは、信号に従うことだけです。また、インジケーターはあなた自身の取引システムの基礎になることができます。取引はミニッツチャートでのみ行われます。 インジケーターがMTFの原則を使用しているという事実にもかかわらず、インジケーターのアルゴリズムは可能な限り安定しています。 購入後、必ず私に書いてください!私の取引設定と推奨事項をあなたと共有します!
MT5版はこちらから: https://www.mql5.com/en/market/product/50538 Telegramチャンネル&グループ: https://t.me/bluedigitsfx VIPグループアクセス: 有料製品の購入証明を当方の受信箱にお送りください 推奨ブローカー: https://bit.ly/BlueDigitsFxStarTrader BlueDigitsFx OBV Divergence — MT4向けの強力なインジケーター、OBVのダイバージェンスを検出し市場の反転を予測 BlueDigitsFx OBV Divergenceインジケーターは、価格とオンバランスボリューム(OBV)を分析し、強気および弱気のダイバージェンスを自動検出します。これにより、トレンドの反転または継続の早期シグナルを提供します。価格の動きと出来高のパターンのダイバージェンスを強調することで、高確率のエントリーおよびエグジットポイントを見つけるのに役立ちます。 主な機能 強気および弱気のOBVダイバージェンスを自動検出 全ての時間足および通貨ペアに対応 ポップア
SMC Easy Signal
Mohamed Hassan
4.73 (15)
3 copies left at $65, next price is $120 SMC Easy Signal was built to remove the confusion around the smart money concept by turning structural shifts like BOS (Break of Structure) and CHoCH (Change of Character) into simple buy and sell trading signals. It simplifies market structure trading by automatically identifying breakouts and reversals as they happen, allowing traders to focus on execution rather than analysis. Whether the market is continuing its trend or preparing to reverse, the i
F-16 Plane Indicatorをご紹介します。これは、取引体験を革新するために設計された最先端のMT4ツールです。F-16戦闘機の無類のスピードと精度に触発され、このインジケーターは高度なアルゴリズムと最新技術を組み合わせ、金融市場で比類のないパフォーマンスを提供します。 F-16 Plane Indicatorを使用すると、リアルタイムの分析と高精度な取引シグナルの生成が可能で、競争相手を圧倒します。ダイナミックな機能により、さまざまな資産クラスで利益を見つけることができ、自信を持って的確な決定を行うことができます。 使いやすいインターフェースを備えたF-16 Plane Indicatorは、人気のあるMetaTrader 4プラットフォームとシームレスに統合され、スムーズで効率的な取引プロセスを実現します。初心者のトレーダーでも経験豊富なプロフェッショナルでも、このインジケーターは独自の取引スタイルと好みに合わせて簡単にカスタマイズすることができます。 F-16 Plane Indicatorのパワーを体感し、市場のトレンドを精密かつ敏捷にナビゲートします。高度なチャー
Friends, we present to your attention our new Forex Gump Laser indicator. Since there are no designers in our team, but mainly mathematicians, financiers, programmers and traders, we did not make any special changes in the indicator design. In appearance, it resembles the usual Forex Gump. On the other hand, Forex Gump has become not just the name of an indicator, it is a brand. And we try to preserve the corporate identity in all its varieties. The whole essence of the indicator in its operatio
KATANA Scalper for MT4  製品概要 KATANA Scalper for MT4 は、MetaTrader 4プラットフォーム向けに最適化された高度なテクニカル分析インジケーターです。本製品は、短期取引(スキャルピング・デイトレード)において最も課題となる「価格ノイズ」と「反応の遅延」を同時に解決することを目的に設計されました。 独自の信号処理アルゴリズムにより、相場の表層的な乱高下を排除し、統計的に優位性の高い「モメンタムの芯」を抽出します。複雑な相場をシンプルに構造化し、トレーダーが客観的なデータに基づいて精密な判断を下すための視覚的インターフェースを提供します。 導入による5つの技術的メリット 1. 非線形アルゴリズムによるノイズ除去と低ラグの実現 従来の移動平均線やオシレーターは、平滑化を行うほど反応が遅れる(ラグが発生する)という数学的課題がありました。本ツールは独自の非線形ロジックを用いることで、価格の急変に即座に追従しながら、トレンドに影響しない微細なノイズのみを効果的にフィルタリングします。 2. 適応型ボラティリティフィルターによる環境
Scalper Vault は、スキャルピングを成功させるために必要なすべてを提供するプロフェッショナルなスキャルピング システムです。このインジケーターは、外国為替およびバイナリー オプションのトレーダーが使用できる完全な取引システムです。推奨される時間枠は M5 です。 システムは、トレンドの方向に正確な矢印シグナルを提供します。また、トップとボトムのシグナルとギャン マーケット レベルも提供します。 インジケーターは、プッシュ通知を含むすべてのタイプのアラートを提供します。 インジケータの購入後にご連絡ください。私の個人的な取引の推奨事項と素晴らしいボーナス指標を無料で共有します! 幸せで有益な取引をお祈りします!
MT5バージョンはこちらからご利用いただけます: https://www.mql5.com/en/market/product/50048 Telegramチャンネル&グループ: https://t.me/bluedigitsfx V.I.Pグループアクセス: 有料商品の購入証明を当方の受信箱へ送信してください 推奨ブローカー: https://bit.ly/BlueDigitsFxStarTrader BlueDigitsFx Easy 123 System — MT4用の強力な反転およびブレイクアウト検出システム 初心者から上級者まで使いやすい、マーケット構造の変化、ブレイクアウト、トレンド反転を視覚的に捉えるオールインワンのノンリペイントインジケーターです。 本インジケーターは「123」パターンに従って動作します: ステップ1: 新しい高値または安値をビッグアローで表示し、エキゾーストポイント(勢いの弱まり)を示します ステップ2: 構造のブレイクを知らせ、トレンド反転の可能性を示唆します ステップ3: リトルアローとサポート/レジスタンスドットでエントリーを確定します
PRO Renko Systemは、特別にRENKOチャートを取引するために設計された高精度の取引システムです。 これは、様々な取引商品に適用することができる普遍的なシステムです。 システムは効果的に正確な逆転信号へのアクセスを与えるいわゆる市場の騒音を中和する。 表示器は非常に使いやすく、信号の生成に責任がある1つの変数だけがあります。 あなたは簡単にお好みの任意の取引ツールとレンコバーのサイズにツールを適応させることができます。 私はいつもあなたが私のソフトウェアで収益性の高い取引を支援するために余分なサポートを提供する準備ができています! 私はあなたに幸せで収益性の高い取引をしたいです! ご購入後にご連絡ください! 私はあなたに私のレンコチャートジェネレータを送信します。 私はまた、私の個人的な推奨事項やシステムの他のモジュールを無料で共有します!
作者のその他のプロダクト
DualVWAP
Kourosh Hossein Davallou
Dual Timeframe VWAP Indicator for MT4  Description Professional VWAP indicator that displays both **Daily** and **Weekly** VWAP simultaneously on your chart.   Features: - Dual VWAP Lines: Blue for Daily, Red for Weekly - Configurable Bands: Two deviation bands for each timeframe - Session Control: Customizable trading hours for Daily VWAP - Clean Visuals: Solid lines for main VWAP, dashed for bands - Optimizable: Parameters can be optimized using Genetic Algorithm Key Settings: - Enable/di
Moving Average RAINBOW
Kourosh Hossein Davallou
4 (3)
Moving Average RAINBOW Forex traders use moving averages for different reasons. Some use them as their primary analytical tool, while others simply use them as a confidence builder to back up their investment decisions. In this section, we'll present a few different types of strategies - incorporating them into your trading style is up to you! A technique used in technical analysis to identify changing trends. It is created by placing a large number of moving averages onto the same chart. When a
FREE
RenkoVP
Kourosh Hossein Davallou
Overview RenkoVP is a professional tool for price structure analysis that runs fully online on the main chart. Unlike many other Renko indicators, it requires no offline charts. The indicator combines Renko bricks, volume profile, dynamic Fibonacci levels, and automatic pattern recognition to help traders identify trends, key zones, and precise entry/exit points. Renko Bricks Configuration The indicator offers both manual and automatic brick configuration: No offline chart required - runs direc
Stochastic RainBow 5
Kourosh Hossein Davallou
3 (1)
A   stochastic   oscillator is a momentum indicator comparing a particular closing price of a security to a range of its prices over a certain period of time. The sensitivity of the oscillator to market movements is reducible by adjusting that time period or by taking a moving average of the result. It is used to generate overbought and oversold trading signals, utilizing a 0-100 bounded range of values. This indicator  show 8 stochastic on one chart.
FREE
RenkoPointFigure
Kourosh Hossein Davallou
Advanced Renko & Point & Figure Indicator with Win/Loss Pattern Analysis This powerful indicator combines two proven strategies—Renko and Point & Figure (P&F)—into one comprehensive tool for trend identification, pattern recognition, and risk management. With dynamic Box Size calculation (Fixed or ATR-based), moving average filters, and win/loss pattern detection, traders can make smarter, data-driven decisions. Key Features   Hybrid Renko + P&F System Renko: Noise-free price action with fixed
FREE
StochasticRainBow
Kourosh Hossein Davallou
5 (2)
A stochastic oscillator is a momentum indicator comparing a particular closing price of a security to a range of its prices over a certain period of time. The sensitivity of the oscillator to market movements is reducible by adjusting that time period or by taking a moving average of the result. It is used to generate overbought and oversold trading signals, utilizing a 0-100 bounded range of values. This indicator  show 15 stochastic on one chart.
FREE
Price Ladder
Kourosh Hossein Davallou
This indicator is based on the Channel . Input Parameters channel_One- show trend line One on or off. timeFrame_One - time Frame of channel One . ColorChannel_One - color of  trend line One. channel_Two- show trend line Two on or off. timeFrame_Two - time Frame of channel Two . ColorChannel_Two - color of  trend line Two. channel_Three- show trend line Three on or off. timeFrame_Three - time Frame of channel Three . ColorChannel_Three - color of  trend line three. channel_Four- show trend line F
FREE
MarketSession
Kourosh Hossein Davallou
The 24-hour forex (FX) market offers a considerable advantage for many institutional and individual traders because it guarantees liquidity and the opportunity to trade at any conceivable time. Currencies can be traded anytime but an individual trader can only monitor a position for so long, however. Most traders can't watch the market 24/7 so they're bound to miss opportunities or worse. A jump in volatility can lead to a movement against an established position when the trader isn't around. A
FREE
Iranian stock market
Kourosh Hossein Davallou
5 (1)
Smart money is a powerful currency. This money is available to major investors who can identify, predict or even generate capital movements ahead of others. This money can flow into financial and capital markets and create dramatic price changes in various stocks. Therefore, detecting smart cash flow, which usually enters the market in a coherent manner and confronts the volume and value of transactions in a market with high returns, is one of the methods that some investors use to invest. But h
FREE
This is an indicator that allows displaying three currency pairs in one window. Input Parameters: Symbol1 - first currency pair. symbol1mirrior - mirror display of the first currency pair. s1color - color of the first currency pair. Symbol2 - second currency pair. symbol2mirrior - mirror display of the second currency pair. Symbol3  - third currency pair. symbol3mirrior -  mirror display of the third currency pair. Symbo4  - fourth currency pair. symbol4mirrior - mirror display of the fourth cur
Price Aleart
Kourosh Hossein Davallou
Price Alert indicator plays sound alerts when the price reaches certain levels that are set by the trader. If you use e-mail alert feature, don't forget to set the e-mail settings in your MetaTrader platform options window.   Input parameters: WhenPriceGoesAbovePIP - if the price exceeds the current one by a specified amount of Pips, the alert will be triggered. WhenPriceGoesBelowPIP - if the price goes below the current one by a specified amount of Pips, the alert will be triggered. WhenPriceIs
Wolfe Wave
Kourosh Hossein Davallou
This particular methodology. Please note the odd sequence in counting, as you will see, it is necessary for the inductive analysis. By starting with a top we are assured of beginning our count on a new wave. (The reverse would apply for a bearish wave.) The 2 point is a top. The 3 point is the bottom of the first decline. The 1 point is the bottom prior to point 2 (top), that 3 has surpassed. The 4 point is the top of the rally after point 3. The 5 point is the bottom after point 4 and is likely
Our strategy relies on a choppy movement on most Forex pairs during the Asian session. Most traders in London sleep when the Sun shines over the Pacific and this results to a very slow movement of GBPUSD pair between 9:00 PM GMT and 7:00 AM GMT. Buy order: Place a buy-stop order just five  pip above the upper band. Place a stop loss just one pip below the lower band. Place a profit target at the upper LawnGreen Arrow. Sell order: Place a sell-stop order just five pip below the lower band. Place
Breakout trade
Kourosh Hossein Davallou
Breakout System  This indicator is based on the trend line and breakthrough. Pair: EURUSD, GBPUSD. Timeframe: M15 Or H1. Input Parameters AlertsOn - alert on or off. TrendLine - show trend line. TrendLineStyle - style of trend line. UpTrendColor - color of up trend. DownTrendColor - color of down trend. ShowTakeprofit - show take profits. ShowTakeprofitStyle - style of take profit. UpperTakeprofitColor - color of up take profit. LowerTakeprofitColor - color of down take profit.
Week Pivot
Kourosh Hossein Davallou
Weekly Pivot  There are a lot of advantages when trading with support and resistance lines, and they should be a staple in every trader's arsenal. Another effective method of deriving multiple horizontal based support and resistance lines is using a formula derived from yesterday's High, Low and Close bar. The formula maps out pivot point levels consisting of the pivot, and three levels of support and resistance, and these levels can be traded much the same way as trading with the regular suppor
Only NonFarm Payroll Trade  The employment situation is a set of labor market indicators. The unemployment rate measures the number of unemployed as a percentage of the labor force. Non-farm payroll employment counts the number of paid employees working part-time or full-time in the nation's business and government establishments. The average workweek reflects the number of hours worked in the non-farm sector. Average hourly earnings reveal the basic hourly rate for major industries as indicated
Daily GBP expert
Kourosh Hossein Davallou
Daily GBPUSD trade  Our strategy relies on a choppy movement on most Forex pairs during the Asian session. Most traders in London sleep when the Sun shines over the Pacific and this results to a very slow movement of GBPUSD pair between 9:00 PM GMT and 7:00 AM GMT. Input Parameters: Auto GMT shift extern int Broker_GMT_Shift = 0;//Manual Broker GMT shift extern int London_Night = 21; //London Night extern int London_Open = 7; //London Open
CurrencyMeter
Kourosh Hossein Davallou
Currency Meter   When trading Forex, we trade a pair of currencies at time. For example EUR/USD. If we are long on the EUR/USD it means that we expect the EUR to gain in strength relative to the USD. If we are short on the EUR/USD it means that we expect the EUR to weaken relative to the USD. You should be all familiar with this concept. The key thing about pairs though is that they just indicate the strength of one currency  relative to another. If we see the EUR/USD going up, is it because the
Three Channel
Kourosh Hossein Davallou
5 (1)
The Price Channel pattern trading strategy is one of the smartest ways to make money trading. The Price Channel pattern represents two trend lines positioned above (channel resistance) and below (channel support) the price. The price action is contained between these two parallel trendlines. The separation between the two trendlines needs to be wide enough if you want to trade inside the Price Channel Pattern. If this is the case, you can buy at the channel support level and sell at the channel
Multi Andrew PitchFork
Kourosh Hossein Davallou
5 (1)
ANDREW’S PITCHFORK TRADING STRATEGY       Essentially, Andrew’s Pitchfork is a tool for drawing price channels. While two lines surrounding price are usually enough to draw a channel, the Pitchfork has an extra line. It is the median line or the handle of the Pitchfork.     The median line is central to this trading method. This is why Andrew’s Pitchfork is also known as the Median Line Method. TRADING RULES      There are many ways to trade using Andrew’s Pitchfork but the basic idea is that pr
Price Action translates as "price movement." Proponents of technical analysis believe that the price takes into account everything that happens on the market. Therefore, indicators and advisers are not needed, since they are calculated based on historical price data and can be very late. By the time the indicator signal triggers, the price direction may already have changed. Those indicators that are trying to predict the price direction are often redrawn. All this leads to unnecessary losses.
Visual Trading
Kourosh Hossein Davallou
With this tool you can easily draw lines on the chart and the trade is done easily. The steps are as follows: First: Draw the buy and sell lines on the chart. Second: Draw the profit and loss lines on the chart. Third: Specify the volume of the transaction you want to trade. Fourth: Activate the lines. Warning When moving lines, be careful not to make a wrong trade. Expert easily trades you. 
**Added to the Original Text:**   This indicator (Fair Value Gap - FVG) also **has the capability** to display **multiple timeframes** of your choice **simultaneously on a single chart**. This feature allows you to identify **stronger and more accurate signals**, as you can analyze price discrepancies (Gaps) across higher or lower timeframes, helping you make smarter trading decisions.   For example, if you spot a bullish FVG on the **1-hour timeframe** and it is also confirmed on the **4-hour
Multi OrderBlock
Kourosh Hossein Davallou
5 (1)
Order blocks are essential structures in trading that indicate areas where large institutional traders, like banks and hedge funds, have placed their orders. These blocks represent significant price levels where substantial buying or selling activity has occurred, providing clues about potential market movements. So, why should you, as a trader, care about order blocks? Well, knowing where these big orders are placed can give you a huge advantage. It’s like having a map showing where the treasur
Pattern Searching: Smart, Precise, & Customizable for MT4!  Are you looking for a powerful tool to quickly and accurately identify trading patterns in Forex? This advanced indicator for MetaTrader 4 (MT4) is exactly what you need!  Key Features That Will Amaze You:  Automatic Classic Pattern Detection: This indicator automatically finds the closest classic Forex patterns for you. Whether you're looking for Smart Money Concepts (SMC) or NDS strategies, this tool covers it all!   * Popular patt
Harmonic Price Patterns Indicator This indicator has the capability to manually display the closest harmonic pattern to you. It allows you to easily adjust its parameters and create your own custom harmonic pattern, while also displaying the price distance between each point. Key Features of the Manual Harmonic Pattern Indicator Harmonic Pattern Identification Detects popular harmonic patterns such as ABCD, Gartley, Bat, Butterfly, Crab, and Shark. Displays patterns automatically or semi-automat
MasterVolume Pro
Kourosh Hossein Davallou
Description: Elevate your chart analysis with this advanced indicator that seamlessly integrates Zigzag structures, Fibonacci retracements, and Volume Profile insights. Designed for traders who seek clarity and precision, this tool visually identifies high-probability price patterns and market turning points. Whether you're tracking CHOCH shifts, pinpointing POIs, or analyzing TRIPLE tops and FLAG formations, this indicator offers the depth and flexibility to adapt to any trading strategy.   C
On Click Trade
Kourosh Hossein Davallou
This is an Expert Advisor that allows opening and modifying positions and orders via mouse (with Stop Loss, Take Profit). Working with this Expert Advisor requires setting lot size, take profit and stop loss for positions. For pending orders you need to set lot size, take profit, stop loss and distance (pip). This Expert Advisor has only one input parameter - background color.
Three Channel 5
Kourosh Hossein Davallou
The Price Channel pattern trading strategy is one of the smartest ways to make money trading. The Price Channel pattern represents two trend lines positioned above (channel resistance) and below (channel support) the price. The price action is contained between these two parallel trendlines. The separation between the two trendlines needs to be wide enough if you want to trade inside the Price Channel Pattern. If this is the case, you can buy at the channel support level and sell at the channel
Multi Andrew PitchFork  ANDREW’S PITCHFORK TRADING STRATEGY       Essentially, Andrew’s Pitchfork is a tool for drawing price channels. While two lines surrounding price are usually enough to draw a channel, the Pitchfork has an extra line. It is the median line or the handle of the Pitchfork.     The median line is central to this trading method. This is why Andrew’s Pitchfork is also known as the Median Line Method. TRADING RULES      There are many ways to trade using Andrew’s Pitchfork but t
フィルタ:
レビューなし
レビューに返信