Main purpose: "Pin Bars" is designed to automatically detect pin bars on financial market charts. A pin bar is a candle with a characteristic body and a long tail, which can signal a trend reversal or correction.
How it works: The indicator analyzes each candle on the chart, determining the size of the body, tail and nose of the candle. When a pin bar corresponding to predefined parameters is detected, the indicator marks it on the chart with an up or down arrow, depending on the directi
Proton Candle Time MT5
OVERVIEW Proton Candle Time MT5 is an indicator for MetaTrader 5 that displays a real-time countdown timer showing the number of seconds remaining in the current candle. The indicator updates continuously as the candle develops and resets when a new candle opens. This tool is designed for traders who need precise timing information while analyzing price action.
PRIMARY FUNCTION The indicator displays the active candle countdown timer directly on the chart. The timer show
This indicator emulates volume delta (buy trades vs sell trades) based on per candle volume and candle shape (direction, size of body and wicks). Artificially separated buy and sell volumes then accumulated for specified number of bars. The indicator shows a histogram of volume delta per bar, as well as a sum of the delta for the given period. What is more important, the indicator allows you to combine current symbol quotes/volumes with quotes/volumes of other related symbols (futures, indices,
The Rayol Code Hour Interval Lines indicator was designed to assist your trading experience. It draws the range of hours chosen by the user directly on the chart, so that it enables traders to visualize price movements during their preferred trading hours, providing traders a more comprehensive view of price movements and market dynamics. This indicator allows the user to choose not only the Broker's time, but also the Local time. This way, the user no longer needs to calculate local time in
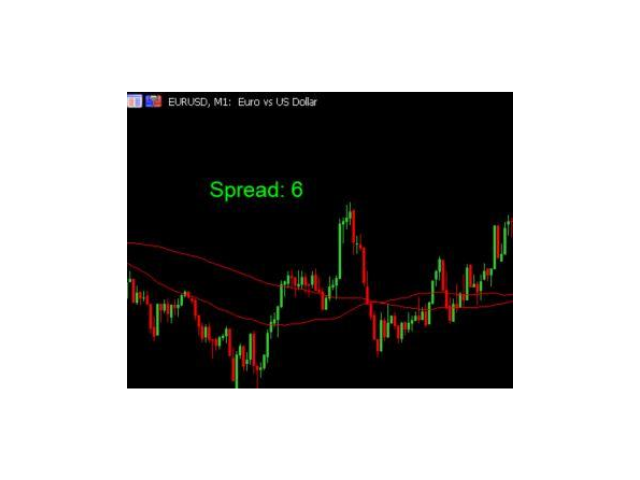
This spread indicator displays the actual spread of each candle. It highlights the maximum spread and the minimum spread of the chosen symbol. This indicator is very helpful to see in real time the spread evolution helping to avoid taking a trade when the spread is too high.
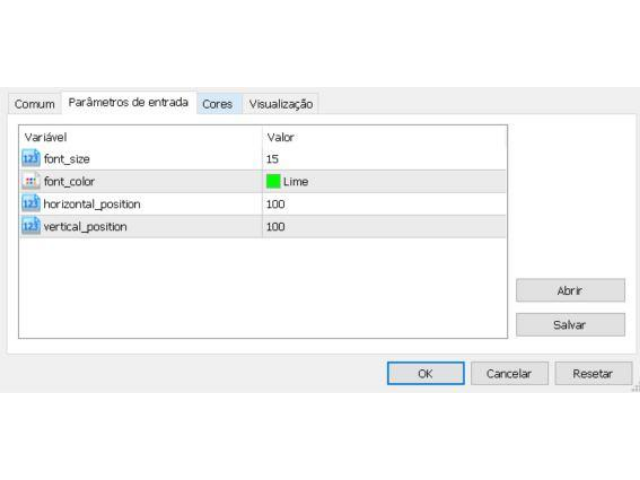
Inputs:
Print value in Points: if true displays the spread as a whole number
D isplay minimum and maximum spread of the past N days: select the number of days to consider the maximum and minimum spread
Automatically adj
A Renko Tick chart based on continuously adjusting percentage.
Live Renko bricks formed by tick data
Adjustable brick width expert for indicator attached Scalp with a Renko, get weird.
The settings can and will break the script if you turn them up too high. Turning off outline mode will not look as nice, but can potentially allow for a larger number of bricks.
This Mt5 Indicator Signals when there is two opposite direction bars engulfed by current bar. has a recent Exponential Moving Average Cross and past bar was oversold/bought Expert Advisor Available in Comments Free Version Here : https://www.mql5.com/en/market/product/110114?source=Site  ; Full Alerts for mt5 terminal , phone , email, print to file, print to journal Buy Signal ( blue line ) Past ema cross ( set at 30 bars back ) Past bar rsi is oversold ( level 40 ) Engulfing bar closes
Double Correlation indicator (free) plots two windowed correlations in a separate window. the size of window is taken as input before the two symbols to correlate to. Two symbols are taken as an input parameters as well as period length. and the two correlations are computed with the currently shown symbol ex: input GBPJPY and AUDNZD. current symbol EURUSD then the following will be computed corr(EURUSD,GBPJPY) and corr(EURUSD,AUDNZD) The indicator can be useful to run a multi-symbol pair trad
This indicator show the candle remaining time on the chart and/or in the corner of the window. It also display notificaton (popup and push) when a new candle is formed (optional). You configure the timer on candles and at chart corner. I don't need to explain the functions because are very simple. MT4 version: https://www.mql5.com/en/market/product/38677 Any doubt or suggestion please contact us. Enjoy!
This is a free indicator, but it took hours to develop. If you want to pay me a coffee, I a
ForexFanclub(FFC) : For detailed instructions and our official website, please visit my profile ! BreakLine - Advanced Breakout Alert Tool BreakLine is a powerful and intuitive indicator designed to elevate your technical analysis. It automates the process of identifying key market levels and instantly notifies you when the price breaks through them, ensuring you never miss a critical trading opportunity. Key Features Automatic Line Drawing: Instantly detects swing highs and lows to plot obj
主要城市的时间。北京时间、东京时间、悉尼时间、惠灵顿时间、纽约时间、法兰克福时间、伦敦时间、迪拜时间。 城市时间可选择开启或者关闭。 点差变色提醒。设置点差提醒点数,例如,设置100点,点差大于100点,文字会变红色。 Time in major cities. Beijing time, Tokyo time, Sydney time, Wellington time, New York time, Frankfurt time, London time, Dubai time. City time can be turned on or off. Dot difference color change reminder. Set the point difference reminder points. For example, set 100 points. If the point difference is greater than 100 points, the text will turn red.
The idea of a Value Chart indicator was presented in the very good book I read back in 2020 , " Dynamic Trading Indicators: Winning with Value Charts and Price Action Profile ", from the authors Mark Helweg and David Stendahl. The idea is simple and the result is pure genius: Present candlestick Price analysis in a detrended way!
HOW TO READ THIS INDICATOR
Look for Overbought and Oversold levels. Of course, you will need to test the settings a lot to find the "correct" one for your approach. It
TradeInfo is a utility indicator which displays the most important information of the current account and position.
Displayed information: Information about the current account (Balance, Equity, Free Margin). Current spread, current drawdown (DD), planned profit, expected losses, etc. Number of open position(s), volume (LOT), profit. Today’s and yesterday’s range. Remaining time to the next candle. Last day profit information. MagicNumber filter. Comment filter.
Indicator parameters: ShowPro
A small utility displays the time in five time zones. You can customize the display of one to five time zones. For each time it is configured: show or not; name; time offset from GMT; color; In general settings, you can change: date / time format ("hh: mi", "hh: mi: ss", "yyyy.mm.dd hh: mi", "yyyy.mm.dd hh: mi: ss") font name; font size; offset from the left edge of the chart; offset from the top edge of the chart;
This indicator will mirror the assets in use in another metatrader, being able to choose the timeframe and a template. This is the Metatrader 5 Client, it needs the Metatrader 4 or 5 Server versions: Metatrader 4 Mirror Chart Server: https://www.mql5.com/en/market/product/88644
Metatrader 5 Mirror Chart Server: https://www.mql5.com/en/market/product/88652 Details of how it works in the video.
AZ ATR indicator (with volume correlation bonus)
Standard ATR indicator, you can enable ignoring abnormally large candles. It is possible to change the location of the displayed text in 4 corners of the chart. You can change the calculation period (days ago). Bonus - the indicator has a correlation with volumes. Can be enabled to display a possible priority at the current moment in the market.
What do the values mean: Positive correlation (0.3 - 1.0): 0.3-0.7 - moderate connection
SMC Price Action Patterns - MT5 Indicator Product Description MetaTrader 5 custom indicator SMC Price Action Patterns A chart overlay indicator for traders who want a structured view of Smart Money Concepts, market structure shifts, order block patterns, fair value gaps, equal highs and lows, and key multi-timeframe price levels directly inside MetaTrader 5. BOS and CHoCH Internal and Swing Structure Order Block Finder Input-Controlled FVG Colors EQH and EQL Premium and Discount Zones Product Ov
Zaxti Trend Levels [SORSAWO]: Where Algorithmic Precision Meets Visual Elegance Step into a new era of technical analysis. Zaxti Trend Levels is not just another charting tool; it is a comprehensive trend-visualization engine crafted for the discerning trader. By seamlessly blending the mathematical rigor of advanced adaptive filtering with intuitive visual mapping, this indicator transforms chaotic price action into a clear, actionable roadmap. Designed to eliminate noise and highlight what tru
The Indicator show Daily Pivot Points. It is possible to specify the number of days to display. For forex it doesn't consider the sunday session data. It is possibile to modify the color, style and width for every level. It is better to use this indicator with timeframe not higher than Н1. 4 Levels of support and resistance with also Intermediate Levels that is possible to hide.
Smart Grid MT5 automatically recognizes any symbol, period and scale of the chart and marks it up accordingly. It is possible to mark up the chart by trading sessions. The grid consists of the two main line types.
Vertical lines There are two visualization methods: Standard - the lines are divided into three types, separating: Small time period. Medium time period. Large time period. Trading Session - the lines are divided into groups (a total of ten). Each group has two lines: the first is res
The "MultiTF Moving Average Panel" indicator is more of a helping tool than an indicator, it serves to help know the trend direction for the current currency pair of all timeframes in one place. It is best used with other indicators and signals, to help filter the signals according the trend based on multiple timeframes.
Indicator inputs : - Moving Average period : Default is set to 34. - Moving Average method : The method of calculation of the Moving Average. Default is set to Exponent
Candle Timer and Spread and Session in a smart way displays the remaining time before the current bar closes and a new bar forms and also the Current Session in place. It can be used for time management and at the same time you keep an eye on Spread changes and Session Change.
Real-Time Edge in Your Trading: Candle Timer & Spread Overlay – FREE for a Limited Time! Smart Display of Candle Timer and Spread and Session in a single place Lightning-Fast Candle Countdown Timer Instant Spread Monito
Core Purpose A permanent crosshair indicator designed exclusively for MetaTrader 5 (MT5). It addresses key limitations of MT5's default crosshair, including the need for manual activation, automatic disappearance on click, and solid lines obscuring price bars. This indicator optimizes chart analysis by delivering a smooth, professional-grade crosshair experience on MT5. Key Features Automatic activation: Enabled immediately after loading, replacing the default Ctrl+F function. The crossha
Time Candle with Sound Alert
This indicator will be display the time left candle Features : 1. Multi Time Frames, Multi Pairs 2. Time Left 2. Position dynamic with Bid Price or Edge of Chart Screen 3. Font Size and Color 4. Display Current Spread, Maximum Spread and Minimum Spread
Note: Maximum and Minimum Spread will be reset when you change TF Tested On MT5 Version 5 Build 5200
If you want the source code, just PM me
The indicator My Big Bars can show bars (candles) of a higher timeframe. If you open an H1 (1 hour) chart, the indicator puts underneath a chart of H3, H4, H6 and so on. The following higher timeframes can be applied: M3, M5, M10, M15, M30, H1, H3, H4, H6, H8, H12, D1, W1 and MN. The indicator chooses only those higher timeframes which are multiple of the current timeframe. If you open an M2 chart (2 minutes), the higher timeframes exclude M3, M5 and M15. There are 2 handy buttons in the lower r
SuperScalp Pro – プロフェッショナル多層コンフルエンス・スキャルピングシステム SuperScalp Pro は、複数のコンフルエンスを組み合わせたプロフェッショナル向けスキャルピングシステムです。より高い確率のトレードチャンスを見つけられるよう設計されており、明確なエントリー確認、ATRに基づくStop LossとTake Profit、さらにXAUUSD、BTCUSD、主要なFX通貨ペアに対応した柔軟なシグナルフィルター機能を提供します。
完全なドキュメントは製品ブログにあります: [User Guide]
SuperScalp Pro Auto Trader EA による自動売買が利用可能です: [Auto Trader]
SuperScalp Pro のトレードロジックを基に開発されたゴールド自動スキャルピングEA: [SuperScalp Gold]
SuperScalp Pro は、Supertrend、VWAP、EMA、RSI、ADX、出来高分析、ボリンジャーバンド、MACDダイバージェンスを組み合わせ、低品質なトレードセットアップをフィルタリングし
Neuro Poseidon is a new indicator by Daria Rezueva. It combines precise trading signals with adaptive TP/SL levels - creating best possible trades as a result!
Message me and get Neuro Poseidon Assistant as a gift to automize your trading process!
What makes it stand out?
1. Proven profitability on all assets and timeframes
2. Only confirmed BUY and SELL signals present on the chart
3. Adaptive TP & SL levels generated by the software for each trade
4. Easy to understand - suitable for al
Welcome to ENTRY IN THE ZONE AND SMC MULTI TIMEFRAME Entry In The Zone and SMC Multi Timeframe is a professional trading indicator built on Smart Money Concepts (SMC) , combining market structure analysis with a No Repaint BUY / SELL signal system in a single indicator. It helps traders understand market structure more clearly, identify key price zones, and focus on higher-quality trading opportunities. By combining Multi-Timeframe Analysis , Points of Interest (POIs) , and real-time signals, th
Crystal Heikin Ashi Signals - Professional Trend & Signal Detection Indicator Advanced Heikin Ashi Visualization with Intelligent Signal System for Manual & Automated Trading
Final Price: $149 ---------> Price goes up $10 after every 10 sales .
Limited slots available — act fast .
Overview Crystal Heikin Ashi Signals is a professional-grade MetaTrader 5 indicator that combines pure Heikin Ashi candle visualization with an advanced momentum-shift detection system. Designed for both manual traders
ARIPoint is a powerful trading companion designed to generate high-probability entry signals with dynamic TP/SL/DP levels based on volatility. Built-in performance tracking shows win/loss stats, PP1/PP2 hits, and success rates all updated live. Key Features: Buy/Sell signals with adaptive volatility bands Real-time TP/SL/DP levels based on ATR Built-in MA Filter with optional ATR/StdDev volatility Performance stats panel (Success, Profit/Loss, PP1/PP2) Alerts via popup, sound, push, or email Cu
IX Power: 指数、商品、暗号資産、外国為替市場の洞察を発見 概要
IX Power は、指数、商品、暗号資産、外国為替市場の強弱を分析するための多用途ツールです。 FX Power が全ての利用可能な通貨ペアデータを活用して外為ペアで最高の精度を提供する一方、 IX Power は基礎資産の市場データにのみ焦点を当てています。この特性により、 IX Power は非外為市場に最適であり、単純な外為分析にも信頼性の高いツールです。どのチャートでもスムーズに機能し、取引判断を向上させるための明確で実行可能な洞察を提供します。
1. IX Power がトレーダーにとって価値がある理由 複数市場での強弱分析
• IX Power は指数、商品、暗号資産、外為シンボルの強弱を計算し、それぞれの市場に合わせた洞察を提供します。
• US30、WTI、ゴールド、ビットコイン、または通貨ペアなどの資産を監視して取引機会を発見できます。 幅広い市場に適応
• 外為取引では、 FX Power が関連する全ての通貨ペアを分析することで比類のない精度を提供します。
• IX Power
Kono robotto wa idō heikin no kōsa de dōsa shimasu. Idō heikin wa kihontekini torendo o tsuiseki suru tame ni shiyō sa remasu. Idō heikin o kōsa sa seru senryaku wa, ōkina tsuyoki oyobi yowaki no ugoki o riyō suru koto o omona mokuteki to shite imasu. Subete no paramēta wa henshū kanōde tsukai yasuku, koreha jikken-tekina purojekutodesu. Kono robotto o shiyō shite chōsa o jisshi shi, mitsuketa sairyō no jōhō o watashitachi to kyōyū shite kudasai Aurélio Machado.
New candlestick alert, the alert appears according to the timeframe it is placed on. The indicator works on any asset, the alert can be silenced at any time, without the need to remove the indicator from the graph. It's great for those who can't keep an eye on the chart all the time. You can use this tool at work, college or anywhere else. It is also possible to receive signals directly on your cell phone by connecting to the metatrader. Aurélio Machado.
Injikētā wa, kaku chāto jikan no muttsu no shingō nimotozuite, onaji shisan no itsutsu no kotonaru chāto jikan no torendo o tsuiseki shimasu. Shihyō no omona mokuteki wa, sore ga oka reta kin'yū shisan no dai tasū no keikō o shimesu kotodesu. Shisutemu wa sū-kai no gurafikku jikan de keikō no jōhō o sōshin shimasu. Kore ni yori, yūzā wa shisan no ugoki no hiroi shiya o motsu koto ga dekimasu. Kono taipu no tsūru wa, operētā ga chūmon o jikkō suru no o shien suru koto de, yūzā no hitto-ritsu o ta
RSI Robot Easy kono kanzen ni kōsei kanōna robotto wa, RSI injikētā o bēsu to shite shiyō shite chūmon o jikkō suru koto o mokuteki to shite imasu. Kawa re sugi no ryōiki ni hairu toki, oyobi/ matawa ura re sugi no ryōiki o hanareru toki ni, entori ga hassei suru ka dō ka o sentaku suru koto ga kanōdesu. Ichido ni sutoppurosu to teikupurofitto, oyobi saidai chūmon-sū o settei suru koto ga kanōdesu.

como lo puedo instarla en mt5 para Mac, gracias