BeST Fisher Oscillator Strategies

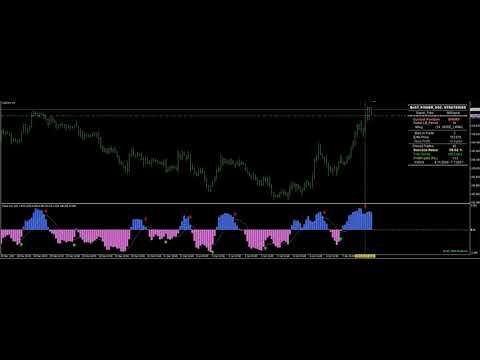
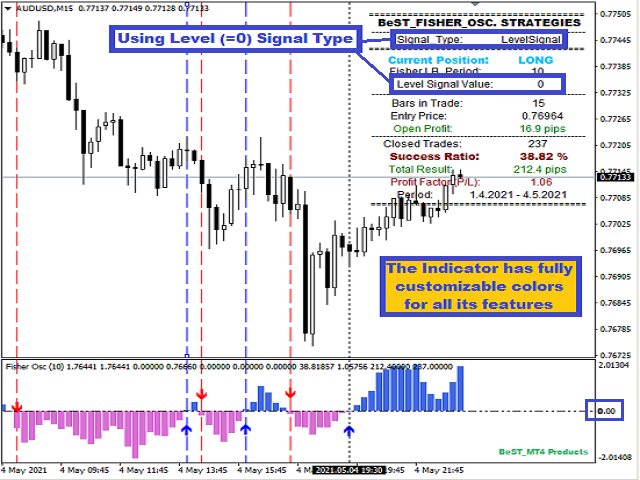
BeST_Fisher Oscillator Strategies is an MT4 Indicator that is based on the popular Fisher Indicator and it is mainly used to identify trend reversals with a high accuracy
It is a great forex trading indicator for scalping, day trading and swing trading purposes. The indicator comes with 2 corresponding Strategies of Reversed Entries each one of which can be used either as a standalone Trading System or as an add-on to any Trading System for finding or confirming the most appropriate Entry or Exit points.
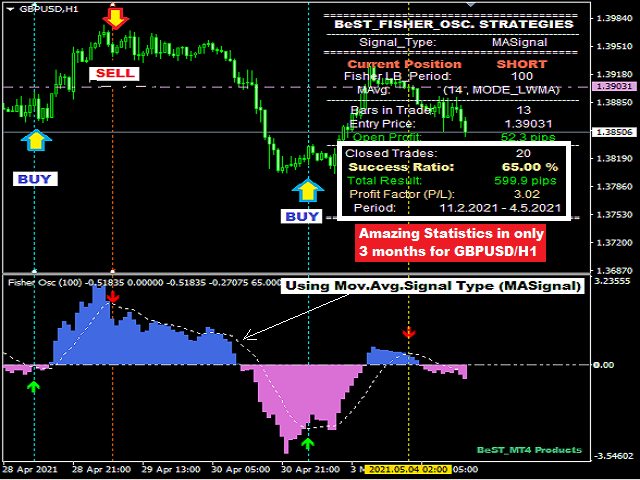
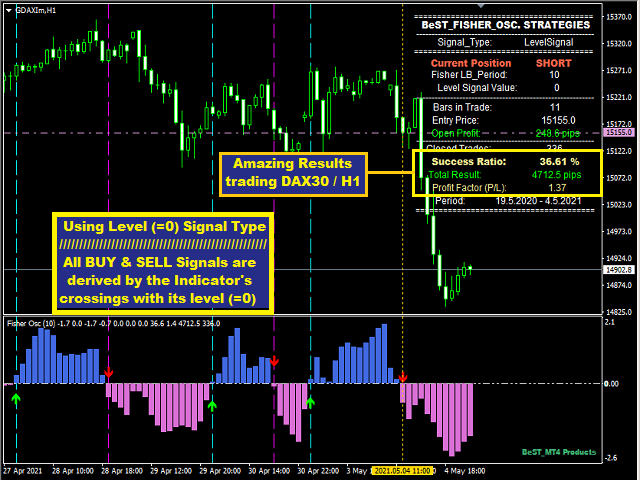
All Buy and Sell Signals are derived by the indicators crossings either with its level (1st Strategy) or with a moving average of its own (2nd Strategy). The choice of MA length and method is purely arbitrary and we can try other LB Periods or MA Methods depending the FX pair and mainly the timeframe used. The same applies to the reference level of the indicator we can use.
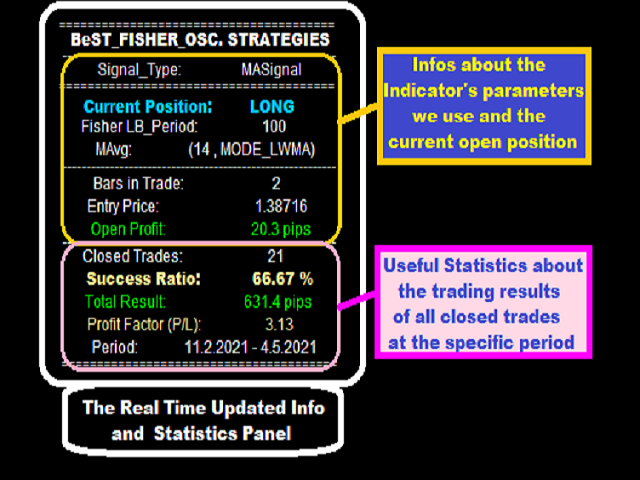
The Indicator comes with a new enhanced Real Time Updated Info and Statistics Panel that can improve its overall performance.

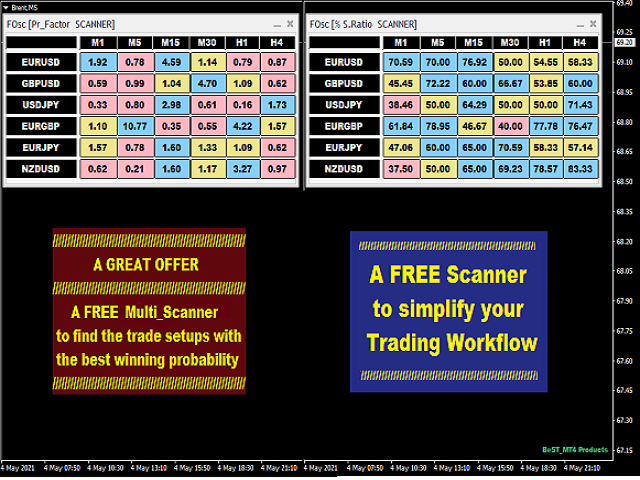
You can Maximize its potentiality by using our FREE OFFER for everyone who purchased the product that is a very useful Multi-Scanner Indicator displaying % Success Ratio and Profit Factor (P/L) in order to find the most promising trading setups (Symbols and Timeframes). After purchasing the product just send me a message and I will send you the Free Scanner a.s.a.p.

BeST_Fisher Oscillator Strategies Indicator
  • Draws definite Buy and Sell Arrows after each valid cross of of the Buy or Sell Levels
  • Draws always only after the bar closing and so is non-repainting and non-backpainting
  • Displays a real-time updated Info and Statistics Panel
  • Has fully customizable colors, sizes & distances of all Chart objects
  • Comes up with MT4 sound alert, email and push notification
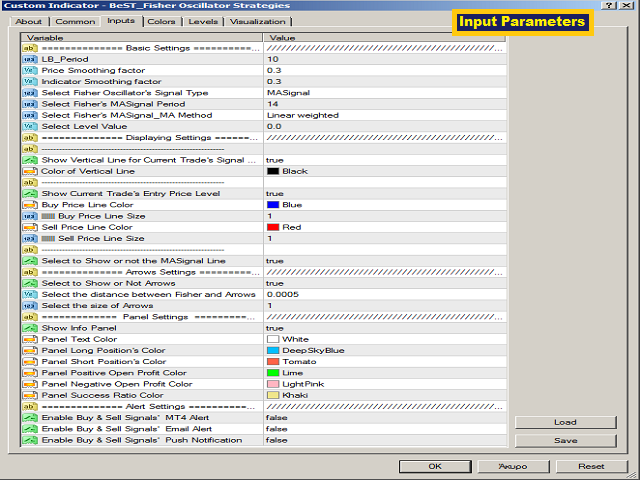
Inputs


Basic Settings
  • LB_Period
  • Price Smoothing factor
  • Indicator Smoothing factor
  • Fisher Oscillator's Signal Type - for selecting the method of producing the Entry Signals (Arrows)
  • Select Fisher's MASignal Period
  • Select Fisher's MASignal_MA Method
  • Select Level Value
Displaying Settings - for selecting which chart objects and features to show/activate and for selecting the color, size and distances of drawn objects

Arrows Settings – for  controlling  Entry arrows’ features

Panel Settings - for  controlling Info and Statistics Panel colors

Alert Settings - for controlling the use of Entry points MT4 alerts


For EA Developers

  • Buy Arrows:    Buffer = 5
  • Sell Arrows:    Buffer = 6


おすすめのプロダクト
We present you the indicator "Candle closing counter", which will become your indispensable assistant in the world of trading. That’s why knowing when the candle will close can help: If you like to trade using candle patterns, you will know when the candle will be closed. This indicator will allow you to check if a known pattern has formed and if there is a possibility of trading. The indicator will help you to prepare for market opening and market closure. You can set a timer to create a pre
Super Reversal Pattern Indicator Unlock the power of advanced pattern recognition with our Super Reversal Pattern Indicator. Designed for traders seeking precision and reliability, this indicator identifies one of the most effective reversal patterns in technical analysis, offering a significant edge in your trading strategy. Key Features: Non-Repainting Accuracy: Enjoy the confidence of non-repainting technology. Once a Super Reversal Pattern is detected, it remains static, providing consiste
Quantum Balance is a modern arrow indicator that identifies key price reversal points in the market with high accuracy. It is based on a combination of WPR (Williams %R) and RSI (Relative Strength Index), which allows you to identify overbought/oversold moments and enter trades at points of maximum potential. The indicator analyzes price dynamics and market conditions, generating signals only when several confirming factors coincide. This reduces the number of false signals and increases tradin
これは、キャンドルの終値を予測する指標です。 このインジケータは、主にD1チャートでの使用を目的としていますが. この指標は、従来の外国為替取引とバイナリオプション取引の両方に適しています。 インジケーターは、スタンドアロンのトレーディングシステムとして使用することも、既存のトレーディングシステムへの追加として機能させることもできます。 このインジケーターは、現在のキャンドルを分析し、キャンドル自体の内部の特定の強度係数と、前のキャンドルのパラメーターを計算します。 したがって、この指標は、市場の動きのさらなる方向性と現在のキャンドルの終値を予測します。 この方法のおかげで、この指標は、短期の日中取引だけでなく、中期および長期の取引にも適しています。 インジケーターを使用すると、市場の状況の分析中にインジケーターが生成する潜在的な信号の数を設定できます。 インジケーターの設定には、このための特別なパラメーターがあります。 また、インジケーターは、チャート上のメッセージの形式で、電子メールで、およびPUSH通知の形式で、新しい信号について通知することができます。 購入後は必ず私に書いて
「ダイナミック・スキャルピング・オシレーター」は、MT4向けの高度なカスタムCrypto_Forexインジケーターです。効率的な取引ツールです! - 新世代のオシレーター - 使い方は画像をご覧ください。 - ダイナミック・スキャルピング・オシレーターは、適応型の売られ過ぎ/買われ過ぎゾーンを備えています。 - オシレーターは、動的な売られ過ぎ/買われ過ぎエリアから正確なエントリーポイントを見つけるための補助ツールです。 - 売られ過ぎ値:グリーンラインより下、買われ過ぎ値:オレンジラインより上。 - このインジケーターは、プライスアクションパターンと組み合わせるのに最適です。 - 標準的なオシレーターよりもはるかに正確です。対応時間枠:M30、H1、H4、D1、W1。 - PCとモバイルの両方でアラート機能付き。 高品質のトレーディングロボットとインジケーターをご覧になるにはここをクリックしてください! これは、このMQL5ウェブサイトでのみ提供されるオリジナル製品です。
The RTrends indicator does two things: first, it automatically draws the layout of the price chart by plotting trend lines and, secondly, it produces bearish and bullish signals. The layout reflects the fractal nature of the market. Trends from different time horizons are applied simultaneously on the chart. Thus, from a single chart a trader can see trend lines of higher timeframes. The lines, depending on the horizon, differ in color and width: the older the horizon, the thicker the line is. T
Noize Absorption Index - is the manual trading system that measures the difference of pressure between bears forces and bulls forces. Green line - is a noize free index that showing curent situation. Zero value of index shows totally choppy/flat market.Values above zero level shows how powerfull bullish wave is and values below zero measures bearish forces.Up arrow appears on bearish market when it's ready to reverse, dn arrow appears on weak bullish market, as a result of reverse expectation. S
フィボナッチリトレースと拡張ラインツール DiNapoliポイント取引方法とゴールデンセクション取引を使用するトレーダーにとって理想的なMT4プラットフォームのフィボナッチリトレースと拡張ラインツール 主な特長: あなたはフィボナッチリトレースメントの複数のセットを直接描くことができ、重要なリターンポイント間の関係は一目瞭然です。 2.フィボナッチ拡張を描画することができます。 3.フィボナッチフォールドバックとラインの延長は、簡単な観察と数値表示のために左右に動かすことができます。 4.チャートは非常に爽やかな 5.数字キーでサイクルを切り替えることができます。 ファンクションキー: 1。 [戻るを押す、要求に応じて描画する、最大8つのグループにする 2。拡張]を描くには[押す] 3。 \を押すと、現在のサイクルの下にあるすべての拡張機能と折り畳みが削除されます 4。フォールドバックを移動して削除して展開する (1)最初のフォールドバックセットのF5行をクリックします。 一度クリックすると(黄色に変わります)、キーボードのDeleteキーを押すと、フォーカ
Magical Arrow
Ranguni Abdulsamir Abdulmajid
Magical Arrow Indicator – Clear & Reliable Signals The Magical Arrow Indicator is a non-repainting, trend-following tool that gives you crystal-clear Buy and Sell signals . It  high-probability reversals and entries . No more guesswork – just follow the arrows on your chart! The Magical Arrow Indicator is a powerful, easy-to-use trading tool that helps you catch the most profitable Buy and Sell opportunities in the Forex market. It is designed for beginners and professional traders , giving y
The Th3Eng PipFinite indicator is based on a very excellent analysis of the right trend direction with perfect custom algorithms. It show the true direction and the best point to start trading. With StopLoss point and Three Take Profit points. Also it show the right pivot of the price and small points to order to replace the dynamic support and resistance channel, Which surrounds the price. And Finally it draws a very helpful Box on the left side on the chart includes (take profits and Stop loss
This is a trend indicator without redrawing Developed instead of the binary options strategy (by the color of the Martingale candlestick) Also works well in forex trading When to open trades (binary options) A signal will appear in the place with a candle signaling the current candle It is recommended to open a deal for one candle of the current timeframe M1 and M5 When a blue dot appears, open a deal up When a red dot appears, open a trade down. How to open trades on Forex. When a signal is rec
EZZ Elite Zig Zag is an indicator for the MetaTrader 4 terminal. This indicator traces the peak of the trend based on the market reversal, thus showing various opportunities in the financial market. EZZ Elite Zig Zag is a visual tool, intuitive, and easy to understand and use.  Test it Yourself by Downloading it for Free. Author Paulo Rocha all rights reserved
Forex Gump
Andrey Kozak
2.4 (5)
Forex Gump is a fully finished semi-automatic trading system. In the form of arrows, signals are displayed on the screen for opening and closing deals. All you need is to follow the instructions of the indicator. When the indicator shows a blue arrow, you need to open a buy order. When the indicator shows a red arrow, you need to open a sell order. Close orders when the indicator draws a yellow cross. In order to get the most effective result, we recommend using the timeframes H1, H4, D1. There
Color Stochastic Enhanced Stochastic Oscillator with Cross Detection and Visual Signal Support Overview Color Stochastic is a customized version of the classic Stochastic Oscillator designed for momentum analysis and crossover visualization. The indicator provides color-based signal marking and configurable crossover detection at user-defined overbought and oversold levels. It can be used as part of: Momentum analysis Mean reversion workflows DCA-based strategies Multi-indicator confirmation sys
SMC Venom Model BPR インジケーターは、スマート マネー (SMC) コンセプトで取引するトレーダー向けのプロフェッショナル ツールです。価格チャート上の 2 つの主要なパターンを自動的に識別します。 FVG   (フェアバリューギャップ) は、3 本のローソク足の組み合わせで、最初のローソク足と 3 番目のローソク足の間にギャップがあります。ボリュームサポートのないレベル間のゾーンを形成し、価格修正につながることがよくあります。 BPR   (バランス価格範囲) は、2 つの FVG パターンの組み合わせで、「ブリッジ」を形成します。これは、価格がボリュームアクティビティの少ない動きで動くときに、ブレイクアウトしてレベルに戻るゾーンで、ローソク足の間にギャップを作成します。 これらのパターンは、大規模な市場プレーヤーと一般参加者の相互作用が発生するチャート上のボリュームと価格動向の分析に基づいて、トレーダーが主要なサポート/レジスタンス レベル、ブレイクアウト ゾーン、エントリ ポイントを識別するのに役立ちます。 インジケーターは、長方形と矢印の形でパターンを視
The Super Arrow Indicator provides non-repainting buy and sell signals with exceptional accuracy. Key Features No repainting – confirmed signals remain fixed Clear visual arrows: green for buy, red for sell Real-time alerts via pop-up, sound, and optional email Clean chart view with no unnecessary clutter Works on all markets: Forex, gold, oil, indices, crypto Adjustable Parameters TimeFrame Default: "current time frame" Function: Sets the time frame for indicator calculation Options: Can be set
Crypto_Forex MT4 用インジケーター「モーニング スター パターン」 - インジケーター「モーニング スター パターン」は、プライス アクション トレーディングに非常に強力なインジケーターです。再描画なし、遅延なし。 - インジケーターは、チャート上で強気のモーニング スター パターンを検出します。チャート上の青い矢印信号 (画像を参照)。 - PC、モバイル、および電子メール アラート付き。 - また、その兄弟である弱気の「イブニング スター パターン」インジケーターも利用できます (以下のリンクに従ってください)。 - インジケーター「モーニング スター パターン」は、サポート/レジスタンス レベルと組み合わせるのに最適です。 高品質のトレーディングロボットとインジケーターをご覧になるにはここをクリックしてください! これは、この MQL5 Web サイトでのみ提供されるオリジナル製品です。
Basic Support and Resistance インジケータは、テクニカル分析を強化するために必要なソリューションです。このインジケータを使用すると、チャートにサポートレベルとレジスタンスレベルを投影できます/ mt5バージョン 機能 フィボナッチレベルの統合: サポートと抵抗レベルとともにフィボナッチレベルを表示するオプションを使用すると、私たちの指標は市場行動と逆転領域の可能性についてさらに深い洞察を提供します。 パフォーマンスの最適化: 各バーの開口部のみで拡張ラインを更新するオプションを使用すると、インジケータは、サポートレベルと抵抗レベルの精度を犠牲にすることなく最適なパフォーマンスを保証します。 入力 メイン設定 Timeframe:  この入力を通じて、より高い時間枠のサポートラインとレジスタンスラインをチャート上に表示することを選択できます。 Support/Resistance Strength [Number of Bars]:  この入力を使用して、サポートと抵抗の強度を決定できます。数が高いほど、サポート/抵抗がより強くなります。 Price m
これはほぼ間違いなく、MetaTraderプラットフォームで見つけることができる最も完全な調和価格形成自動認識インジケーターです。 19種類のパターンを検出し、フィボナッチプロジェクションをあなたと同じように真剣に受け止め、潜在的逆転ゾーン(PRZ)を表示し、適切なストップロスとテイクプロフィットレベルを見つけます。 [ インストールガイド | 更新ガイド | トラブルシューティング | よくある質問 | すべての製品 ] 19の異なる調和価格形成を検出します プライマリ、派生および補完フィボナッチ投影(PRZ)をプロットします 過去の価格行動を評価し、過去のすべてのパターンを表示します この指標は、独自の品質とパフォーマンスを分析します 適切なストップロスとテイクプロフィットのレベルを表示します ブレイクアウトを使用して適切な取引を通知します すべてのパターン比をグラフにプロットします 電子メール/音声/視覚アラートを実装します スコット・M・カーニーの本に着想を得て、この指標は最も純粋で急を要するトレーダーのニーズを満たすように設計されています。ただし、トレードを容易にする
Sniper Trend Fusion This indicator is a powerful all-in-one trading tool designed to simplify chart analysis and improve decision-making. It combines multiple proven techniques into a single system, helping traders identify trend direction, volatility, key price levels, and market structure without clutter. Instead of switching between multiple indicators, everything you need is integrated into one smooth and efficient interface. Key Advantages All-in-One System Combines trend, volatility, sup
FREE
[ZhiBiCCI]インディケータは全てのサイクル使用に適しており、そして全ての市場品種にも適しています。 [ZhiBiCCI]緑色の実線は強気の発散の逆転です。緑色の点線は古典的な強気の発散です。 [ZhiBiCCI]赤への実線は逆弱気の発散である。赤い点線は古典的な弱気の発散です。 [ZhiBiCCI]はパラメータ(アラート、メール送信、通知送信)で設定でき、(true)に設定するとインスタント信号をアラームウィンドウに送信し、Eメール、インスタントメッセージを送信できます。 パラメータ設定の説明 [displayAlert]:これはアラームスイッチで、trueに設定され、矢印が表示されればプロンプトに自動的に警告され、falseに設定されれば警告されません。 [sendmail_NO_OFF]:これはメールを送信するためのスイッチで、trueに設定します。矢印が表示されていればMT4で設定したメールボックスにメールを送信し、falseに設定されていればメールを送信しません。 [sendnotification_NO_OFF]:これはインスタントメッセージを送信するた
Chart Patterns Detect 15 patterns (Ascending Triangle, Descending Triangle, Rising Wedge, Falling Wedge, Bullish Flag, Bearish Flag, Bullish Rectangle, Bearish Rectangle Symmetrical triangle, Head and Shoulders, Inverted Head and Shoulders, Triple top, Triple Bottom, Double Top, Double Bottom) Use historical data to calculate the probability of each pattern to succeed (possibility to filter notification according to the chance of success) gives graphic indication about the invalidation level and
This unique multi-currency strategy simultaneously determines the strength of trends and market entry points, visualizing this using histograms on the chart. The indicator is optimally adapted for trading on the timeframes М5, М15, М30, Н1. For the convenience of users, the indicator renders the entry point (in the form of an arrow), recommended take profit levels (TP1, TP2 with text labels) and the recommended Stop Loss level. The take profit levels (TP1, TP2) are automatically calculated for
プロトレーダーおよび評価型アカウント(Prop)向けリスク管理・制限監視インジケーター 本ツールは、リスク管理と各種リミットに関する情報をチャート上に表示するのみで、より集中した意思決定をサポートします。インジケーターはポジションの新規/決済/変更を行わず、エキスパートアドバイザー(EA)と干渉しません. 機能 日次および累計ドローダウンの監視 残高(Balance)または有効証拠金(Equity)を基準に日次/累計DDを計算・表示(設定可能)。 設定したリミットまでの残り割合を表示。 チャート上のクリーンでプロフェッショナルなパネル サマリー表:Balance、Equity、現在のP/L、日次/累計DD、アラート閾値。 判断に集中できる読みやすいUI。 リスクに基づくポジションサイズ パーセンテージ/固定金額のリスクと設定したストップロスに基づき概算ロットを算出。 R:R(リスクリワード)比とエントリー、SL、TPをチャートに表示。 アラートと通知 日次/累計DDの閾値に近づいた際にアラート(閾値は設定可能)。 価格がSL/TPに到達、またはその他の定義済みイベント発生時に通知。
"Impulses and Corrections 4" is created to help traders navigate the market situation. The indicator shows multi-time frame upward and downward "Impulses" of price movements. These impulses are the basis for determining the "Base" , which is composed of zones of corrections of price movements, as well as "Potential" zones for possible scenarios of price movement. Up and down impulses are determined based on a modified formula of Bill Williams' "Fractals" indicator. The last impulse is always "U
まず第一に、この取引ツールはノンリペイント、ノンリドロー、ノンラグの指標であり、プロの取引に理想的ですことを強調する価値があります。 オンラインコース、ユーザーマニュアル、デモ。 スマートプライスアクションコンセプトインジケーターは、新米から経験豊富なトレーダーまで、非常 に強力なツールです。Inner Circle Trader AnalysisやSmart Money Concepts Trading Strategiesなど、20以上の有用な指標を1つに組み合わせています。このインジケーターはスマートマネーコンセプトに焦点を当て、大手機関の取引方法を提供し、彼らの動きを予測するのに役立ちます。 特に、流動性分析に優れており、機関がどのように取引しているかを理解しやすくしています。市場のトレンドを予測し、価格の動きを慎重に分析するのに優れています。機関の戦略とトレードを合わせることで、市場の動向についてより正確な予測ができます。このインジケーターは多目的であり、市場構造を分析し、重要な注文ブロックを特定し、さまざまなパターンを認識するのに優れています。 このインジケーターは
インジケーターは、可能な限り最小のラグで 再描画せず にチャートに高調波パターンを表示します。インディケータトップの検索は、価格分析の波動原理に基づいています。 詳細設定では、取引スタイルのパラメータを選択できます。ろうそく(バー)のオープニングで、新しいパターンが形成されると、価格変動の可能性のある方向の矢印が固定され、変更されません。 インジケーターは、次のパターンとその種類を認識します:ABCD、Gartley(Butterfly、Crab、Bat)、3Drives、5-0、Batman、SHS、One2One、Camel、Triangles、WXY、Fibo、Vibrations。デフォルトでは、ABCDとGartleyの数字のみが設定に表示されます。多くの追加の構成可能なパラメーター。 主なパラメータ: ShowUpDnArrows-予想される方向矢印を表示/非表示 ArrowUpCode-上矢印コード ArrowDnCode-下矢印コード Show old history patterns-古いパターンの表示を有効/無効にします Enable alert messages,
Shark Deal Book
Philip Pankaj Suthagar
4 (3)
Term  "shark"  in the business world denotes a high volume investor who just made a good investment in a highly Potential business deal.So, sharks are the ones who make the market move. In our case, if an American shark bought a Japanese company, he/she has to convert American dollars into Japanese yen to make the deal. So, the demand for the Japanese yen will increase sharply. Thus USD/JPY will go short rapidly if the deal was from the shark. Another example, In the case of forex, if fed increa
TWO PAIRS SQUARE HEDGE METER INDICATOR Try this brilliant 2 pairs square indicator It draws a square wave of the relation between your two inputs symbols when square wave indicates -1 then it is very great opportunity to SELL pair1 and BUY Pair2 when square wave indicates +1 then it is very great opportunity to BUY pair1 and SELL Pair2 the inputs are : 2 pairs of symbols         then index value : i use 20 for M30 charts ( you can try other values : 40/50 for M15 , : 30 for M30 , : 10 for H1 ,
Crypto_Forex MT4用インジケーター「 RSI SPEED 」は、優れた予測ツールで、リペイント機能はありません。 - このインジケーターの計算は物理学の方程式に基づいています。RSI SPEEDはRSI自体の1次導関数です。 - RSI SPEEDは、主要トレンドの方向にスキャルピングエントリーするのに適しています。 - 適切なトレンドインジケーター(例えばHTF MA(画像参照)など)と組み合わせて使用​​してください。 - RSI SPEEDインジケーターは、R​​SI自体がどれだけ速く方向転換するかを示します。非常に敏感です。 - モメンタムトレード戦略にはRSI SPEEDインジケーターの使用をお勧めします。RSI SPEEDインジケーターの値が0未満の場合は価格モメンタムが下降し、RSI SPEEDインジケーターの値が0を超える場合は価格モメンタムが上昇します。 - インジケーターにはモバイルとPCのアラートが組み込まれています。 高品質のトレーディングロボットとインジケーターをご覧になるにはここをクリックしてください! これは、このMQL5ウェブサイトで
このプロダクトを購入した人は以下も購入しています
Gann Made Easy は、ミスター・ギャンの理論を使用した取引の最良の原則に基づいた、プロフェッショナルで使いやすい外国為替取引システムです。 W・D・ガン。このインジケーターは、ストップロスとテイクプロフィットレベルを含む正確な買いと売りのシグナルを提供します。 PUSH通知を利用して外出先でも取引可能です。 ご購入後、取引方法の説明と優れた追加インジケーターを無料で入手するには、私にご連絡ください! おそらく、ギャンの取引手法についてはすでに何度も聞いたことがあるでしょう。通常、ギャンの理論は初心者のトレーダーだけでなく、すでにある程度の取引経験がある人にとっても非常に複雑なものです。なぜなら、ギャンの取引手法は理論的にはそれほど簡単に適用できるものではないからです。私はその知識を磨き、最良の原則を私の外国為替インジケーターに組み込むために数年を費やしました。 このインジケーターは非常に簡単に適用できます。必要なのは、それをチャートに添付し、簡単な取引推奨事項に従うだけです。このインジケーターは常に市場分析の仕事を行い、取引の機会を探します。適切なエントリーポイントを検出す
M1 SNIPER は使いやすいトレーディングインジケーターシステムです。M1時間足向けに設計された矢印インジケーターです。M1時間足でのスキャルピングのためのスタンドアロンシステムとして、また既存のトレーディングシステムの一部としても使用できます。このトレーディングシステムはM1時間足での取引に特化して設計されていますが、他の時間足でも使用できます。元々、この手法はXAUUSDとBTCUSDの取引用に設計しましたが、他の市場においても役立つと考えています。 インジケーターのシグナルは、トレンドの方向と逆方向に取引できます。インジケーターのシグナルを利用して両方向に取引するのに役立つ特別な取引テクニックをご紹介します。この手法は、特別な動的なサポートとレジスタンスの価格帯を利用することに基づいています。 ご購入後、M1 SNIPER矢印インジケーターをすぐにダウンロードできます。さらに、M1 SNIPERツールのすべてのユーザーに、以下のスクリーンショットに表示されているApollo Dynamic SRインジケーターを無料で提供しています。この2つのインジケーターを組み合わせることで
Scalper Inside PRO – Since 2020. An exclusive indicator that utilizes an innovative algorithm to swiftly and accurately determine the market trend. The indicator automatically calculates opening, closing, and profit levels, providing detailed trading statistics. With these features, you can choose the most appropriate trading instrument for the current market conditions. Additionally, you can easily integrate your own arrow indicators into Scalper Inside Pro to quickly evaluate their statistics
PRO Renko Systemは、特別にRENKOチャートを取引するために設計された高精度の取引システムです。 これは、様々な取引商品に適用することができる普遍的なシステムです。 システムは効果的に正確な逆転信号へのアクセスを与えるいわゆる市場の騒音を中和する。 表示器は非常に使いやすく、信号の生成に責任がある1つの変数だけがあります。 あなたは簡単にお好みの任意の取引ツールとレンコバーのサイズにツールを適応させることができます。 私はいつもあなたが私のソフトウェアで収益性の高い取引を支援するために余分なサポートを提供する準備ができています! 私はあなたに幸せで収益性の高い取引をしたいです! ご購入後にご連絡ください! 私はあなたに私のレンコチャートジェネレータを送信します。 私はまた、私の個人的な推奨事項やシステムの他のモジュールを無料で共有します!
Auto Optimized Parabolic RSI: 高度な3Dモメンタムエンジン ほとんどのリテール向けインジケーターは、市場のボラティリティが変化した瞬間に破綻する静的な入力値に依存しているため、失敗に終わります。Auto Optimized Parabolic RSIは、自らの数学的優位性を継続的に再計算することで「インジケーターの陳腐化」問題を解決し、機関投資家レベルの定量的適応力をMT5ターミナルに直接もたらします。 最大の強み: カスタムインメモリ3D最適化   標準的な自動最適化ツールは、インジケーターの呼び出しで端末に過負荷をかけるため、頻繁にMT5プラットフォームをフリーズさせます。本ツールは、このボトルネックを完全に回避しています。RAMベースのカスタムネイティブ計算機を内蔵した内部エンジンは、チャートを読み込んだりタイムフレームを変更したりするたびに、超高速の3Dグリッド探索を実行します。RSI期間(頻度)、SARステップ(加速度)、SAR最大値(制限速度)を同時にスイープし、プラットフォームを遅延させることなく、数万通りものパラメーターの組み合わせを絶対的
ご紹介     Quantum Breakout PRO は 、ブレイクアウト ゾーンの取引方法を変革する画期的な MQL5 インジケーターです。 13年以上の取引経験を持つ経験豊富なトレーダーのチームによって開発された Quantum Breakout PROは 、革新的でダイナミックなブレイクアウトゾーン戦略により、あなたの取引の旅を新たな高みに押し上げるように設計されています。 クォンタム ブレイクアウト インジケーターは、5 つの利益ターゲット ゾーンを備えたブレイクアウト ゾーン上のシグナル矢印と、ブレイクアウト ボックスに基づいたストップロスの提案を提供します。 初心者トレーダーにもプロのトレーダーにも適しています。 量子EAチャネル:       ここをクリック MT5バージョン:   ここをクリック 重要!購入後、インストールマニュアルを受け取るためにプライベートメッセージを送ってください。 推奨事項: 時間枠: M15 通貨ペア: GBPJPY、EURJPY、USDJPY、NZDUSD、XAUUSD アカウントの種類: ECN、Raw、またはスプレッドが非
After purchase, contact me privately to receive 1 month of free testing with EA Forex Proton! This advanced MT4 trading robot automatically executes signals from any MT4 indicator, including Market Makers. The latest version also includes AI integration, allowing each trade signal to be analyzed using Artificial Intelligence. Live Signal with EA Forex Proton: Click here Market Makers is a powerful price action trading system designed to identify high-probability Buy and Sell opportunities based
Apex Edge No Repaint MT4対応、プロ仕様のリペイントしないトレーディングインジケーター Apex Edge No Repaintは、リペイントする矢印の煩わしさから解放され、明確なシグナルを求める真剣なFXおよび仮想通貨トレーダー向けに設計された、高品質でクリーンかつ信頼性の高いトレーディングツールです。 主な機能: 100% リペイントなし – チャートに表示されたシグナルは固定されたままです デュアルシグナルシステム:早期のチャンスを提供するRAWシグナルと、高確率で確定したエントリーを提供するCONFシグナル シンプルなワンクリック切り替えボタン:RAW ON/OFFとCONF ON/OFF トレンド、強度パーセンテージ、シグナルステータスを表示するプロフェッショナルなリアルタイムダッシュボード インスタントアラート:ポップアップ、サウンド、メール通知 すべてのCONFシグナルにTP1、TP2、ストップロスレベルを自動描画 視覚的に分かりやすい、色分けされた矢印: ライムグリーン → CONF買い 赤 → CONF売り ドジャーブルー → RAW買
このインジケーターを購入すると、プロ仕様のトレードマネージャーを無料で差し上げます。 まず第一に、このトレーディングシステムがノンリペイント、ノンリドロー、ノンラグのインジケーターであることを強調する価値がある。これにより、手動取引とロボット取引の両方に理想的なものになっています。 オンラインコース、マニュアル、プリセットのダウンロード。 「スマートトレンドトレーディングシステム MT5」は、新規および経験豊富なトレーダー向けにカスタマイズされた包括的なトレーディングソリューションです。10以上のプレミアムインジケーターを組み合わせ、7つ以上の堅実なトレーディング戦略を備えており、多様な市場状況に対応する多目的な選択肢となっています。 トレンドフォロー戦略:トレンドを効果的に乗り越えるための正確なエントリーとストップロス管理を提供します。 リバーサル戦略:潜在的なトレンドの反転を特定し、トレーダーがレンジ相場を活用できるようにします。 スキャルピング戦略:高速で正確なデイトレードおよび短期取引のために設計されています。 安定性:すべてのインジケーターはノンリペイント、ノンリドロー、ノ
このインジケーターは、エリオット波動理論と組み合わせて作動し、2つの方法で使用されます: 自動モード: このモードでは、インジケーターがチャート上の全ての5つのモーティブ波を自動的に検出し、予測とポテンシャルな逆転ゾーンを提供します。また、アラートやプッシュメッセージを生成する能力も備えています。この自動機能により、エリオット波動パターンの識別と分析のプロセスが効率化されます。 手動モード: このオプションは、エリオット波動理論を手動で扱いたいトレーダー向けです。9つの段階を使用して波を描画することができます。各段階は、表示された後に描画されたラインを調整して個別に定義できます。この機能により、手動で波を描画するプロセスがより効率的になります。重要な点として、すべての描画データが将来の参照のためにプラットフォームのデータフォルダに保存されることに注意してください。 パラメータ: Name: インジケーターの名前。 Use_System_Visuals: インジケーターのテーマを有効または無効にして、取引プラットフォーム全体の外観に合わせます。 Explain_Comment: 波の番号
Please send me Direct message on MQL5 CHAT after purchasing the Indicator for Training and Installation Support There are some additional files that is important to use with the Indicator . So be sure to contact me after purchasing the Indicator So that I can add you for training and support . If you find any difficulty with installation then send me Direct message here So that I can connect with you via Anydesk or Teamview for the product installation. " Smart Order Block Indicator " to find m
ゴールドラッシュ・トレンド・アロー・シグナル ゴールドラッシュ・トレンド・アロー・シグナル 指標は、XAU/USDにおける高速・短期スキャルパー向けに最適化された、正確でリアルタイムのトレンド分析を提供します。 1分足専用に設計されたこのツールは、明確なエントリーポイントを示す方向矢印を表示し、スキャルパーが変動の激しい市場状況でも自信を持って取引できるよう支援します。 この指標は、PRIMARY(主要)とSECONDARY(補助)のアラート矢印で構成されています。PRIMARYシグナルは、トレンドの方向転換を示す白と黒の方向矢印であり、SECONDARYシグナルは、PRIMARY矢印が示す方向を確認し、潜在的なエントリーポイントを示す青と赤の矢印です。 注意:トレンド方向の変化後にPRIMARYアラート矢印が1つだけ表示される場合、複数のSECONDARY青/赤矢印が表示される点に注意が必要です。SECONDARYシグナルは、シグナル基準を満たす任意のローソク足後に表示されます。したがって、長期的なトレンド移動の場合、画面に多くのSECONDARY矢印が表示されます(添付の
「 Dynamic Scalper System 」インジケーターは、トレンド波の中でスキャルピング取引を行う手法のために設計されています。 主要通貨ペアと金でテスト済みで、他の取引商品との互換性があります。 トレンドに沿った短期的なポジションオープンのシグナルを提供し、追加の価格変動サポートも提供します。 インジケーターの原理 大きな矢印はトレンドの方向を決定します。 トレンド波の中では、小さな矢印の形でスキャルピングシグナルを生成するアルゴリズムが機能します。 赤い矢印は強気方向、青い矢印は弱気方向です。 トレンドの方向には敏感な価格変動ラインが描かれ、小さな矢印のシグナルと連動します。 シグナルは次のように機能します。適切なタイミングでラインが現れるとエントリーシグナルが形成され、ラインが開いている間はポジションが保持され、完了すると取引が終了します。 推奨される動作時間枠はM1~H4です。 矢印は現在のローソク足に形成され、次のローソク足が開いている場合は、前のローソク足の矢印は再描画されません。 入力パラメータ Trend Wave Period - トレンド方向
トレンドトレーディング は、タイミングのプルバックとブレイクアウトにより、市場で起こっているトレンドから可能な限り利益を得るように設計された指標です。確立されたトレンドの中で価格が何をしているかを分析することにより、取引の機会を見つけます。 [ インストールガイド | 更新ガイド | トラブルシューティング | よくある質問 | すべての製品 ] 自信を持って効率的に金融市場を取引する むち打ちにならずに確立されたトレンドから利益を得る 収益性の高いプルバック、ブレイクアウト、早期の逆転を認識する この指標は、独自の品質とパフォーマンスを分析します 複数時間枠のダッシュボードを実装します インジケーターは再描画されていません 電子メール/音声/視覚アラートを実装します 確立されたトレンドは多くの取引機会を提供しますが、ほとんどのトレンド指標はそれらを完全に無視しています。インジケーターの解釈はかなり簡単です: (1) トレンドの変化 (2) トレンドの方向への後退 (3) トレンドの方向へのブレイクアウト 赤いダッシュ は下降トレンド中の修正です 青いダッシュ は上昇トレンド中
GOLD Impulse with Alert
Bernhard Schweigert
4.67 (12)
このインディケータは、当社の2つの製品 Advanced Currency IMPULSE with ALERT  +   Currency Strength Exotics . のスーパーコンビネーションです。 このインジケーターは全ての時間枠で作動し、8つの主要通貨と1つのシンボルの強弱のインパルスをグラフで表示します。 このインジケータは、金、エキゾチックペア、商品、インデックス、先物など、あらゆるシンボルの通貨強度の加速度を表示することに特化されています。金、銀、原油、DAX、US30、MXN、TRY、CNHなどの通貨強度の加速度(インパルスまたは速度)を表示するために、任意のシンボルを9行目に追加できる、この種の最初のものです。 新しいアルゴリズムに基づいて構築され、潜在的な取引の特定と確認がさらに容易になりました。これは、通貨の強さや弱さが加速しているかどうかをグラフィカルに表示し、その加速の速度を測定するためです。加速すると物事は明らかに速く進みますが、これはFX市場でも同じです。つまり、反対方向に加速している通貨をペアリングすれば、潜在的に利益を生む取引を特定
Advanced Supply Demand
Bernhard Schweigert
4.91 (300)
現在40%オフ 初心者にもエキスパートトレーダーにも最適なソリューション このインジケーターは独自の機能と新しい公式を多数内蔵しており、ユニークで高品質かつ手頃な取引ツールです。このアップデートでは、2つの時間枠ゾーンを表示できるようになります。より長いTFだけでなく、チャートTFとより長いTF(ネストゾーンを表示)の両方を表示できます。すべてのSupply Demandトレーダーの皆さんのお気に召すはずです。:) 重要情報の公開 Advanced Supply Demandの可能性を最大化するには、 https://www.mql5.com/ja/blogs/post/720245 にアクセスしてください。   エントリーまたはターゲットの正確なトリガーポイントを正確に特定できれば取引がどのように改善されるか想像してみてください。新しい基盤となるアルゴリズムに基づいて構築されているため、買い手と売り手の間の潜在的な不均衡をさらに簡単に特定できます。これは、最も強い需要と供給のゾーンと、過去のパフォーマンス(古いゾーンを表示)がグラフィカルに表現されるためです。これらの機能は、最適な
Gold Scalper Super is an easy-to-use trading system. The indicator can be used as a standalone scalping system on the M1 time frame, as well as part of your existing trading system. Bonus: when purchasing an indicator, Trend Arrow Super is provided free of charge, write to us after purchase. The indicator 100% does not repaint!!! If a signal appears, it does not disappear! Unlike indicators with redrawing, which lead to the loss of a deposit, because they can show a signal and then remove it.
CRT Candle Range Theory HTF MT4.   Ultimate CRT Indicator: Advanced ICT Concepts and Malaysian SnR Trading System Discounted   Price   $50  !!     Secure your lifetime access   now   before it switches to   subscription-only ! Master the Market Maker's Footprints with the Most Advanced Candle Range Theory Indicator Unlock the true power of   Smart Money Concepts (SMC)   and trade precisely like the institutions with the   Ultimate CRT Indicator . Built exclusively for serious traders, this indic
このインディケータは、異なる期間のフラクタルの価格構造を調べて、市場で起こり得る反転ポイントを決定し、すでに基本的または技術的な評価モデルを持っているポジショントレーダーにタイミングを提供します。弟の リバーサルフラクタル とは異なり、このインジケーターは選択された期間のためにリバーサルを逃すことはなく、ジグザグ形式でリバーサルフラクタルを見つけます。 [ インストールガイド | 更新ガイド | トラブルシューティング | よくある質問 | すべての製品 ] ターニングポイントは長いトレンドを開始できます インジケーターは再描画されていません あらゆる種類のアラートを実装します カスタマイズ可能な色とサイズ フラクタルは奇数番目のバーのフォーメーションであり、フォーメーションの最上位または最下位の中間バーであり、フラクタル内のすべてのバーが閉じるとインディケーターが描画されるため、このインジケーターはリアクティブまたは遅れ信号です。ただし、既存の方向バイアスを持つトレーダーは、この指標が非常に有用であり、早期のエントリポイントを取得します。 このインディケーターは、ボイルダウンされた
サポート線と抵抗線のプロットにうんざりしていませんか? サポートレジスタンス は、非常に興味深いひねりを加えてチャート内のサポートとレジスタンスラインを自動検出およびプロットするマルチタイムフレームインジケーターです。価格レベルは時間とともにテストされ、その重要性が高まるにつれて、ラインは太くなり、暗くなります。 [ インストールガイド | 更新ガイド | トラブルシューティング | よくある質問 | すべての製品 ] 一晩でテクニカル分析を強化 チャートを閲覧せずに重要な価格レベルを検出 一目ですべての価格レベルの相対的な強さを認識する すべての取引で最大30時間のプロットラインを節約 インジケーターは、すべての価格レベルの年齢を表示します インジケーターは再描画されていません 過去および現在の価格レベルは近接によって崩壊し、現在の市場行動に合わせて調整されます。動作は、必ずしもピークではない場所に線が引かれます。 価格レベルは、時間とともに拒否されるにつれて、より暗く、より広くなります ノイズを避けるために、重要でない価格レベルは定期的にクリアされます カスタマイズ可能な時間枠の
They say history repeats itself. What if you could prove it in real-time? The Propfolio Ghost Pattern is an advanced algorithmic pattern-matching engine. It empowers you to select any current price action structure on your chart and instantly scan thousands of historical candles to find the exact moment in the past where the market did the exact same thing. Once it finds the highest probability match, it projects the historical outcome into the future as "Ghost Candles"—giving you a highly calcu
現在26%OFF! このインディケータは、当社のメインインディケータ( Advanced Currency Strength 28   &  Advanced Currency IMPULSE with ALERT )の両方のスーパーコンビネーションです。28の外国為替ペアのTICK-UNITSとアラートシグナルの通貨強度の値を示しています。11種類のTick-Unitが使用可能です。1、2、3、4、5、6、10、12、15、20、30秒の11種類です。サブウィンドウのTick-Unitバーは、秒単位のタイマーに1ティック以上含まれる場合に表示され、左側にシフトされます。 たった1枚のチャートで、28のFXペアをスキャルピングできます。スキャルピングのチャンスとなるトリガーポイントを正確に把握することで、スキャルピングが上達することを想像してみてください。 1分足よりも短い期間で動作する市場初の通貨強度インジケーターです! このインジケータは、素早いインとアウトを行い、小さなピップを切り取ることを望む高速スキャルパーのためのものです。 ユーザーマニュアル: ここをクリック h
まず第一に、この取引インジケーターは再描画されず、再描画されず、遅延しないことを強調する価値があります。これにより、手動取引とロボット取引の両方に理想的なものになります。 ユーザーマニュアル:設定、入力、戦略。 アトミックアナリストは、価格の強さとモメンタムを利用して市場でより良いエッジを見つけるためのPA価格アクションインジケーターです。ノイズや誤ったシグナルを除去し、取引ポテンシャルを高めるための高度なフィルターを備えています。複雑なインジケーターの複数のレイヤーを使用して、アトミックアナリストはチャートをスキャンし、複雑な数学的計算をシンプルなシグナルと色に変換します。これにより、どのような初心者トレーダーでも理解して使用し、一貫した取引の決定を行うことができます。 「アトミックアナリスト」は、新規および経験豊富なトレーダー向けにカスタマイズされた包括的な取引ソリューションです。プレミアムインジケーターとトップノッチの機能を1つの取引戦略に組み合わせ、すべてのタイプのトレーダーにとって汎用性のある選択肢にします。 デイリートレーディングとスキャルピング戦略:高速で正確な
購入後、このインジケーターに基づいたボーナスEAを受け取るためにご連絡ください。 Self Optimizing Double MA Strategyは、パラメータ推測の必要性を排除するために設計されたプロフェッショナルグレードの取引ツールです。組み込みの自動最適化エンジンを搭載し、バックグラウンドで何千ものパラメータの組み合わせをシミュレートすることで、変化する市場状況に継続的に適応し、統計的な優位性を維持します。 静的で時代遅れの設定に依存するのではなく、インジケーターは自身のロジックを動的に更新し、現在の時間枠と取引商品にとって最も収益性の高い構成を見つけ出します。 主な機能 組み込みの自動最適化: 選択した更新頻度に基づいて、システムはFast MA、Slow MA、およびRSIの期間を定期的に再計算し、設定が常に現在の市場のリズムと一致するようにします。 MAダイバージェンスフィルター: 移動平均線が明確に乖離している(広がっている)場合にのみシグナルを検証する、トレンド強度のコア指標です。これにより、移動平均線が収束している相場や平坦なレンジ相場での誤ったエントリーを防ぎ
現在40%オフ 初心者やエキスパートトレーダーに最適なソリューション! このインジケーターは、独自の機能と新しい計算式を取り入れた、ユニークで高品質、かつ手頃な価格のトレーディングツールです。たった1枚のチャートで28の為替ペアの通貨強度を読み取ることができます。新しいトレンドやスキャルピングチャンスの引き金となるポイントを正確に特定することができるので、あなたのトレードがどのように改善されるか想像してみてください。 ユーザーマニュアルはこちら  https://www.mql5.com/en/blogs/post/697384 これが最初の1本、オリジナルだ! 価値のないクローンを買わないでください。 特別な サブウィンドウの矢印で強い通貨の勢いを表示 GAPがあなたのトレードを導く! 基準通貨や気配値が売られすぎ・買われすぎのゾーン(外相フィボナッチレベル)にあるとき、個別チャートのメインウィンドウに警告表示。 通貨がレンジの外側から反落した場合、プルバック/リバーサルのアラート。 クロスパターンの特別なアラート 複数の時間枠を選択可能で、トレンドを素早く確認できます
チャートを構成し、周期的な価格変動を識別するテクニカル指標。 どのチャートでも動作します。 いくつかの種類の通知。 グラフ自体に追加の矢印があります。 履歴を再描画せずに、キャンドルのクローズに取り組みます。 M5以上のTFを推奨します。 パラメータの使用と設定が簡単です。 異なるパラメータを持つ 2 つのインジケーターを使用する場合、他のインジケーターなしで使用できます。 入力パラメータは2つあります 周期性と信号持続時間 これら 2 つのパラメータは、チャート構造の処理を扱います。 Cyclicity - 反転サイクルが変化する頻度を調整し、サイクルを滑らかにします。 Signal duration - 最小数では価格変動の衝動を検出し、最大数では長期的なトレンドの動きを検出します。
The indicator is built on a non-standard Zig Zag, it draws accumulations after which if the price leaves this zone and a test of this zone occurs, then a sound signal is given and an arrow appears - after the test candle closes.The indicator does not redraw its signals, it is very easy to use, there are only three settings 1- this is the zig zag parameter 2- this is the minimum price exit from the zone 3- this is the maximum price exit from the zone. The lower the parameter for Zig Zag, the more
デイトレーダーマスターは、デイトレーダーのための完全なトレーディングシステムです。システムは2つのインジケーターで構成されています。 1つの指標は売買する矢印信号です。それはあなたが得る矢印インジケーターです。 2つ目のインジケーターを無料で提供します。 2番目のインジケーターは、これらの矢印と組み合わせて使用​​するために特別に設計されたトレンドインジケーターです。 インジケーターは繰り返さず、遅れないでください! このシステムの使用は非常に簡単です。 2色の線で表示されている現在のトレンドの方向に矢印信号をたどる必要があります。青は買いの傾向です。赤い色は売りの傾向です。青い矢印は買いシグナルです。赤い矢印は売りの合図です。トレンドラインの色と一致するように、矢印の色と信号の方向が必要です。 矢印インジケーターは、主に時間間隔M5とM15での日中取引のために作成されました。ただし、技術的には、システムは他の時間間隔で使用できます。 インジケータには、PUSHメッセージ機能を備えたポップアップアラートが装備されています。 購入後、必ず私に書いてください!私はあなたにシステムとの取引の
Trend Screener
STE S.S.COMPANY
4.79 (95)
トレンドインジケーター、1つのツールに組み込まれたすべての重要なトレンド機能を備えたトレンドトレーディングとフィルタリングのための画期的なユニークなソリューション! これは、すべてのシンボル/商品(外国為替、商品、暗号通貨、インデックス、株式)で使用できる100%再描画されていないマルチタイムフレームおよびマルチ通貨インジケーターです。 期間限定オファー: サポートおよびレジスタンス スクリーナー インジケーターは、たった 65 ドルで永久的にご利用いただけます。(元の価格 250 ドル) (オファー延長) トレンドスクリーナーは、チャート内のドットで矢印トレンドシグナルを提供するインジケーターに続く効率的なインジケーターです。 トレンド分析インジケーターで使用できる機能: 1.トレンドスキャナー。 2.最大利益分析を備えたトレンドライン。 3.トレンド通貨強度メーター。 4.アラート付きのトレンド反転ドット。 5.アラート付きの強いトレンドドット。 6.トレンド矢印 毎日の分析例、毎日のシグナルパフォーマンス...など、トレンドスクリーナーインジケーターを使用して、ここで見つけること
Delta Fusion Pro – 日中取引のための高度なオーダーフロー分析 Delta Fusion Pro は MetaTrader 4 用のプロフェッショナル指標で、アグレッシブな注文フローを明らかにし、機関投資家の圧力の強度と方向をリアルタイムで表示します。従来のボリューム指標とは異なり、Ask と Bid のボリューム差(デルタ)を分析し、反転の予測、トレンドの確認、プロフェッショナルな関心ゾーンの特定を可能にします。 主な特徴 インテリジェント自動調整システム 以下に基づき、すべてのパラメータを自動調整: 銘柄タイプ(FX、暗号資産、指数、コモディティ、株式) 運用タイムフレーム 市場のボラティリティ(ATR) 最近の平均ボリューム 初心者トレーダー向けに手動設定不要 — インジケーターが自動でキャリブレーション! 機能概要 NetDelta と累積デルタ Ask/Bid のアグレッシブボリューム差を計算、カスタマイズ可能な EMA スムージング リアルタイムで方向性圧力を表示 ヒストグラムの色をカスタマイズ(買い/売り) 価格/ボリュームのダイバージェンス 通常お
作者のその他のプロダクト
BeST_Fibonacci Retracement Lines is an MT4 Indicator that by default is based on common  Fibonacci levels but it can also draw any 3 desired levels of Retracement or Support of a trending move. It can be used to identify pullback points but also additionally as a kind of a Trailing Stop . BeST_Fibonacci Retracement Lines indicator: • by default draws 38.2%, 50% and 61.8% Retracement Levels of the current price move defined using the Highest High (HH) and Lowest Low (LL) of a desired Look Back Pe
BeST_IFT of Oscillators Collection is a Composite MT4 Indicator   that is based on the IFT (Inverse Fisher Transformation) applied to RSI , CCI , Stochastic and DeMarker Oscillators in order to find the best Entry and Exit points while using these Oscillators in our trading. The IFT was first used by John Ehlers to help clearly define the trigger points while using for this any common Oscillator ( TASC – May 2004 ). All Buy and Sell Signal s are derived by the Indicator’s crossings of the Buy or
BeST_Oscillators Collection is a Composite MT5 Indicato r including the Chaikin ,  Chande and TRIX Oscillators from which by default Chaikin and TRIX Oscillators but not Chande Momentum Oscillator are contained in MT5 platform. It also provides for each Oscillator the option of displaying or not a Mov. Average as a  Signal Line and the resulting Signals as Arrows in a Normal (all arrows) or in a Reverse Mode (without showing up any resulting successive and of same type arrows). Analytically fo
FREE
BeST_Gann Hi-Lo Strategy is an MT4 indicator that is based on the Gann Hi-Lo Activator the famous trend-following indicator that allow us to to enter a trade quite early while also stay in a trade as longer as we can for taking profit.While it is built of a moving average it helps traders determine the direction of the trends and to produce with-trend trading signals. This indicator is in fact a simple moving average of the highs and lows of the previous period. It follows the trends in the mark
FREE
BeST_Darvas Boxes is a Metatrader Indicator based on the trading method developed in the 50’s by the Hungarian Nicolas Darvas . BeST_Darvas Boxes indicator draws the Top and the Bottom of every Darvas Box that can be confirmed on the current Chart draws Buy and Sell Arrows for every confirmed Upwards or Downwards Breakout of the above levels draws always only after the bar closing and so is non-repainting or backpainting it can be used as a standalone trading system/method Inputs Basic Settin
BeST Oscillators Collection is a Composite MT4 Indicator including the  Chaikin,Chande  and TRIX Oscillators which by default are contained in  MT5  but not in  MT4 platform. It  also provides  the option of displaying or not a Mov. Avg. as a Signal   Line and the resulting Signals as Arrows in a Normal (all arrows) or in a Reverse Mode (without showing up any resulting successive and of same type arrows). Analytically for each one of the specific Oscillators: The Chaikin Oscillator ( CHO )   is
FREE
BeST_Darvas Boxes EA is an MT4  Expert Advisor that is based on the most classic trading method developed  in the 50's by Nicolas Darvas  commonly known as The Darvas Boxes Trading System. The Original Darvas Boxes System can be found in details in his book "How I Made $2,000,000 In The Stock Market"  (Copyright 1960, by Nicolas Darvas). Although the original system was designed to trade only Stocks and to open only Long trades its trading principles can also be applied to many other Markets l
Variable Index Dynamic Average (VIDYA) developed by Tushar Chande  by default is contained in MT5 but not in MT4 platform and it is a dynamic EMA (Exponential Moving Average) that adjusts its Length (LB Period) automatically in response to Market Volatility originally measured through the Chande Momentum Oscillator(CMO). CMO value is used as the ratio to the smoothing factor of EMA ( The New Technical Trader by Tushar Chande and Stanley Kroll, John Wiley and Sons, New York, 1994). The higher th
FREE
BeST_ Classic Pivot Points is an MT4 Indicator that is based on the widely known and definitely classic Pivot Point of a market prices activity. A pivot point is calculated as an average of significant prices (high,low,close) from the performance of a market in the prior trading period. If the market in the following period trades above the pivot point it is usually evaluated as a bullish sentiment, whereas trading below the pivot point is seen as bearish. A pivot point and the associated suppo
FREE
BeST DEMA
Eleni Koulocheri
4.5 (2)
Double Exponential Moving Average ( DEMA ) is a moving  average (MA) that gives the most weight to recent price data.Like exponential moving average (EMA), it is more reactive to all price fluctuations than a simple moving average (SMA) and so DEMA can help traders to spot reversals sooner, because it is faster responding to any changes in market activity. DEMA was developed by Patrick Mulloy in an attempt to reduce the amount of lag time found in traditional MAs. ( TASC_Feb. 1994 ). DEMA can al
FREE
BeST_Chande RAVI (Range Action Verification Index) is an MT4 Indicator that is based on the corresponding indicator developed by Tushar Chande which is mainly based on market momentum while focuses on identifying ranging and trending markets. By default RAVI is defined by the formula:  RAVI = Absolute value (100 x (SMA(7) – SMA(65)). Also by default there is an arbitrary reference level of 3% that means a market is ranging if the RAVI is less than 3%, or trending strongly if it is is greater th
FREE
Triple Exponential Moving Average ( TEMA ) is a  moving   average (MA) that gives the  most weight to recent price data. TEMA is more reactive to  all price fluctuations than  a Simple Moving Average (SMA) or an Exponential Moving Average (EMA) or even a Double Moving Average (DEMA) and surely can help traders to spot reversals sooner because it responds very fast to any changes in market activity.  TEMA was developed by Patrick Mulloy in an attempt to reduce the amount of lag time found in trad
FREE
BeST_Darvas Boxes is an MT4  Indicator based on the trading method developed in the 50’s by the Hungarian Nicolas Darvas . BeST_Darvas Boxes indicator draws the Top and the Bottom of every Darvas Box  that can be confirmed on the current Chart. draws Buy and Sell Arrows  for every confirmed Upwards or Downwards Breakout of the above levels. draws always only after the bar closing and so is non-repainting or backpainting . Note : Every customer who wants to have the older version v_1.75 with th
BeST_Visual MAs Signal Generator  MT4 Indicator is a very  useful Visual Tool that can display in the Chart all ENTRY signals (BUY and SELL) and also any corresponding EXIT signal, based on a total of 12, common but also different trading strategies, in which the Entry and Exit Signals are derived exclusively by using Moving Averages (MAs). The two main groups of MAs Strategies included in this tool are: A) Crossover Signals This group includes 4 different strategies (A1-A4), where Entry and Exi
BeST_Keltner  Channels Variations & Strategies   is an   MT4  Indicator based on the original  Keltner Channels Technical Analysis Indicator and it is a very useful Visual Tool that can display in the Chart all the known Variations of Keltener Channels and also the corresponding 10 totally Strategies   i.e. all ENTRY signals (BUY and SELL) and also any corresponding EXIT signal, in which the Enrty and Exit Signals are derived exclusively by using Keltner Channels Variations. Every variation of K
BeST_Trend  Scanner is an MT4 Indicator that uses a proprietary algorithm   in order to identify the most likely levels and probable moment for an upside  or a downside trending price move. BeST_Trend  Scanner is a very useful tool that defines in advance and with a high statistical percentage of accuracy the subsequent Resistance & Support Levels of the anticipated upside or downside trending move of price and so When used at its Reverse Entries Mode : It generates Buy or Sell arrows at the ver
BeST_Chande TrendScore Indicator  points the start of a trend with high degree of  accuracy and it is amazing for scalping on the 1min timeframe. It is also a   simple way to rate trend strength. It indicates both the direction and strength  of a trend and can be easily combined with various trend-following, swing and scalping strategies. As of a trend’s direction and strength a value of +10 signals a strong uptrend while a value of -10 signals a strong downtrend. Generally a positive score show
All those involved in trading do certainly know that Moving Average Crossovers for being tradable should be reliable and also they need to have minimal lag. BeST_Vervoort Zero Lagging MAs Strategy is a Metatrader Indicator that can help you to achieve it and is based on S.Vervoort's work about Reliable and of Zero Lag MAs Crossovers as described in his TASC_05/2008 article " The Quest For Reliable Crossovers ". It's a Multipotentiality Indicator as it can display of either simply the Zero Laggin
BeST_Trend Exploiter is a Metatrader Indicator  based on a smart proprietary algorithm which can detect the market Median Trend while it filters out the noise providing Buy and Sell Signals and also wherever it is applicable it provides us with TP Levels of High Probability. Additionally as it has Built Inside all the necessary features it can be used as a Complete Strategy of very Impressive Results. Essential Advantages of the Indicator Clear and Easily Understandable trading rules. Real Time
BeST_123 Strategy is clearly based on the 123_Pattern which is a frequent Reversal Chart Pattern of a very high Success Ratio . It occurs at the end of trends and swings and it’s a serious indication of high probability for a change in trend. Theoretically an 123_pattern is valid when the price closes beyond the level of #2 local top/bottom, a moment when the indicator draws an Entry Arrow,  raises an Alert and a corresponding Position can be opened. The BeST 123_Strategy Indicator is non-repai
BeST_Profit Taker Exits is a Metatrader Indicator based on the corresponding vital part of Jim Berg's Trading System.It timely locates the most likely points/bars of significant Profit Taking and can be easily used as an add-on to any Trading System/Method . The Indicator consists of 2 Take Profit lines deriving as (MA ± times the ATR) usually the upper one above the prices (for Long Trades) and the lower one below prices (for Short Trades). When the Close (or High by choice) of a bar is above
BeST_Hull MAs Directional Strategy is a Metatrader Indicator based on the corresponding Hull Moving Average.It timely locates the most likely points for Entering the Market as well as the most suitable Exit points and can be used either as a standalone Trading System or as an add-on to any Trading System for finding/confirming the most appropriate Entry or Exit points. This indicator does use only the directional slope and its turning points of Hull MAs to locate the Entry/Exit points while it a
BeST_Breakout Strategy is a Metatrader Indicator based on a proprietary algorithm implementing a very powerful tool that can exploit every breakout leading to huge market movements. It timely locates the most likely points for Entering the Market as well as the most suitable Exit points and can be used successfully as a standalone Trading System which often results in huge profits accompanied by very impressive statistics like Success Ratio and Profit Factor.  The BeST_Breakout Strategy is a
BeST_ Elliot Wave Oscillator Strategies is an MT4 indicator which by default is the difference of two SMAs displayed as a histogram fluctuating around zero while a Signal Line generates Entry Signals either in a Reverse or in a Normal Mode and it is a very powerful tool that very often exploits huge market movements. Signal Line comes in 2 types: Advanced Get Type – like the corresponding one used in the homonym analysis package Mov. Average Type – as a Moving Average of the Elliot Oscillator I
BeST_Keltner Channels Strategies  EA   is an MT4  Expert Advisor that is based on the method developed by Chester W. Keltner described in book “How To Make Money in Commodities” that  Keltner called it the ten-day moving average trading rule. Originally Keltner Channels uses for Central Line a 10-bars SMA of Typical Price and  the 10-bars Average Range (High - Low) with a multiplication factor of 1 for constructing the Boundary Bands. Later several known traders and authors have published modif
BeST_RevEngEMARSI Strategy is an MT4 Indicator that is based on the indicator RevEngEMARSI by Giorgos Siligardos that was presented in his article " Reverse Engineering RSI (II) " ( TASC_Aug 2003 ) as a new variation of his inverse-RSI indicator and which transforms the Exponential moving average of RSI into a curve in the price graph, simplifying the price projection method and improving its visual representation. BeST_RevEngEMARSI Strategy while implementing the crossings with its Moving Aver
BeST_ADX Scalping Strategy is an MT4 Strategy of an Entry and Exit Signals Indicator based on the ADX values that is an excellent tool for scalpers to scalp the currency market multiple times a day for profit . It is built mainly for scalping purposes although it can also be used as a breakout indicator . Its Signals produce a complete and standalone trading system of impressive results . The indicator comes with a new enhanced Real Time Updated Info and Statistics Panel that can improve its ove
BeST_RMO Indicator Strategies is an MT4 Indicator that is based on the corresponding famous Oscillator created by Rahul Mohindar that detects trends in all markets and it can produce Buy and Sell Signals of high winning probability forming a complete and standalone trading system of impressive results. The indicator uses 2 strategies as a selection: i) Classic : produces Reversed Entry Signals by the crossings of zero (0) line  and ii) MAsSignals : produces Reversed Entry Signals using MAs of RM
BeST_Hull MAvgs Strategies_EA is an MT4 Expert Advisor based on the Market indicator named  BeST_Hull MAs Directional Strategy  and can make trades according to it or using only 1 HMA while it also applies all common Trade and Risk Management features. Generally the Hull Moving Average (HMA - developed by Alan Hull) is a directional trend indicator. It captures the current state of the market and uses recent price action to determine if conditions are bullish or bearish relative to historical da
BeST_Hull Single MA Strategy is an Metatrader Indicator based on the famous indicator Hull Mov.Average . This indicator can display the Single HMA Strategy of just 1 Hull MAvg. It uses added internal filters locating the most likely Entries while it can be used as a standalone system or as an add-on to other ones. Generally the Hull Moving Average (HMA - developed by Alan Hull) is a directional trend indicator . It captures the current state of the market and uses recent price action to determin
フィルタ:
レビューなし
レビューに返信