Fibonacci Moving Average

Fibonacci Moving Average by Quant Atlas

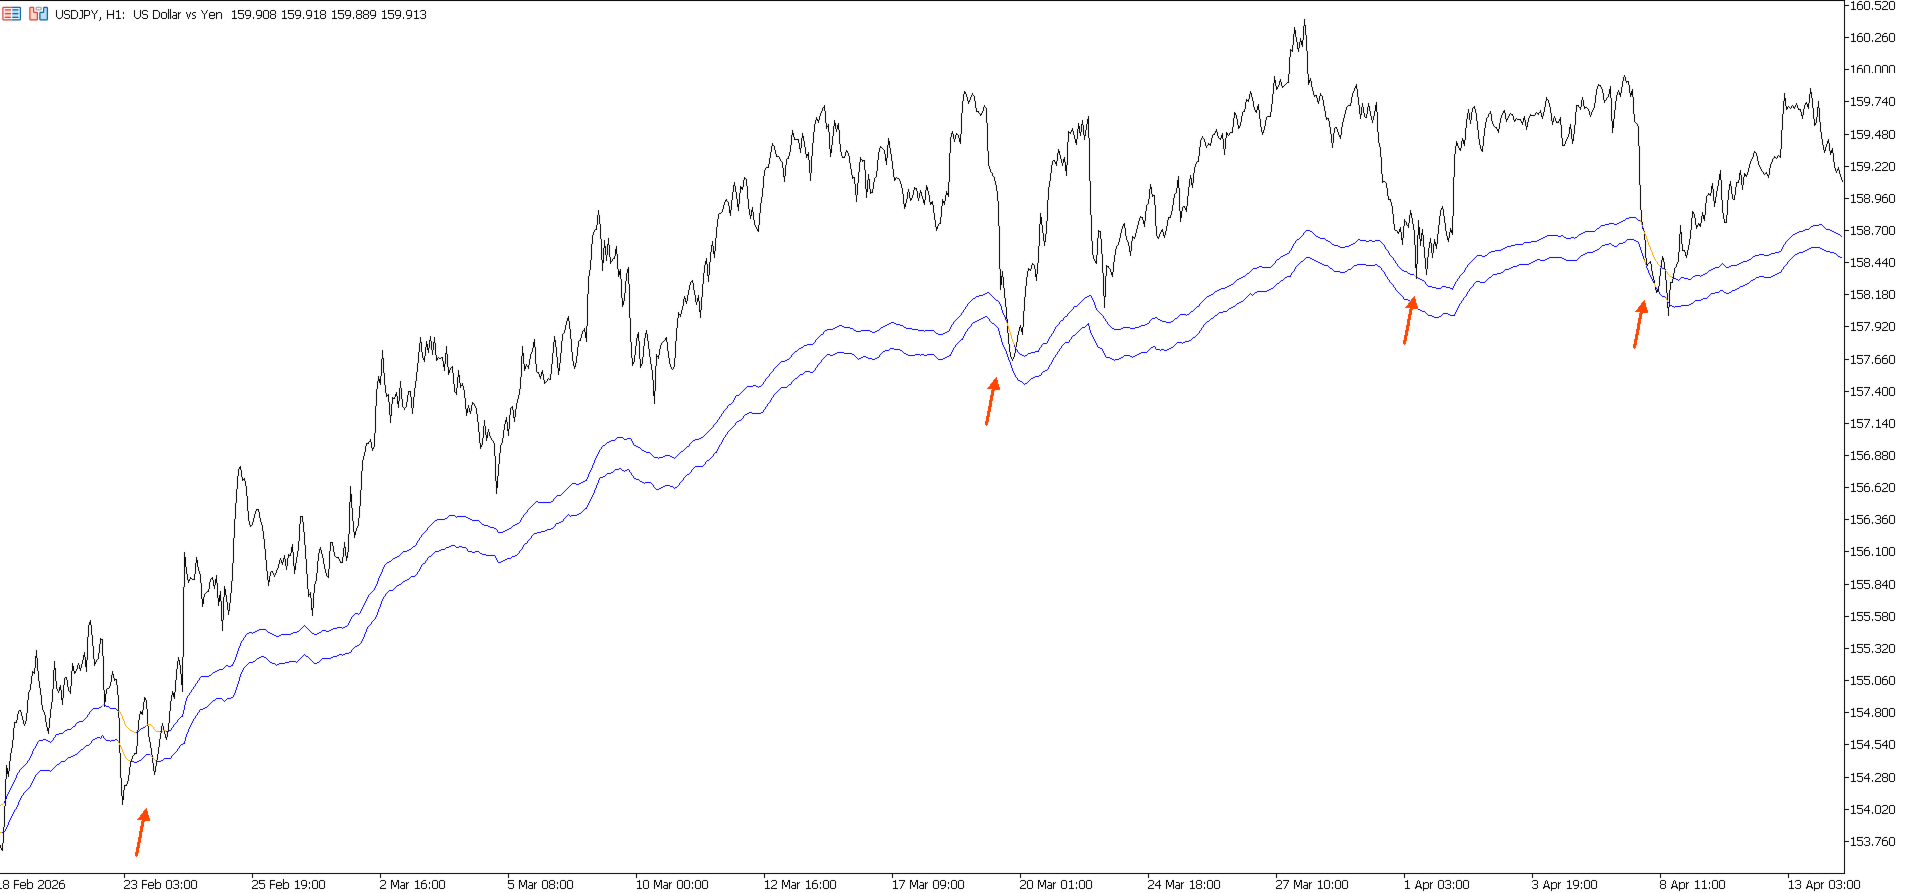
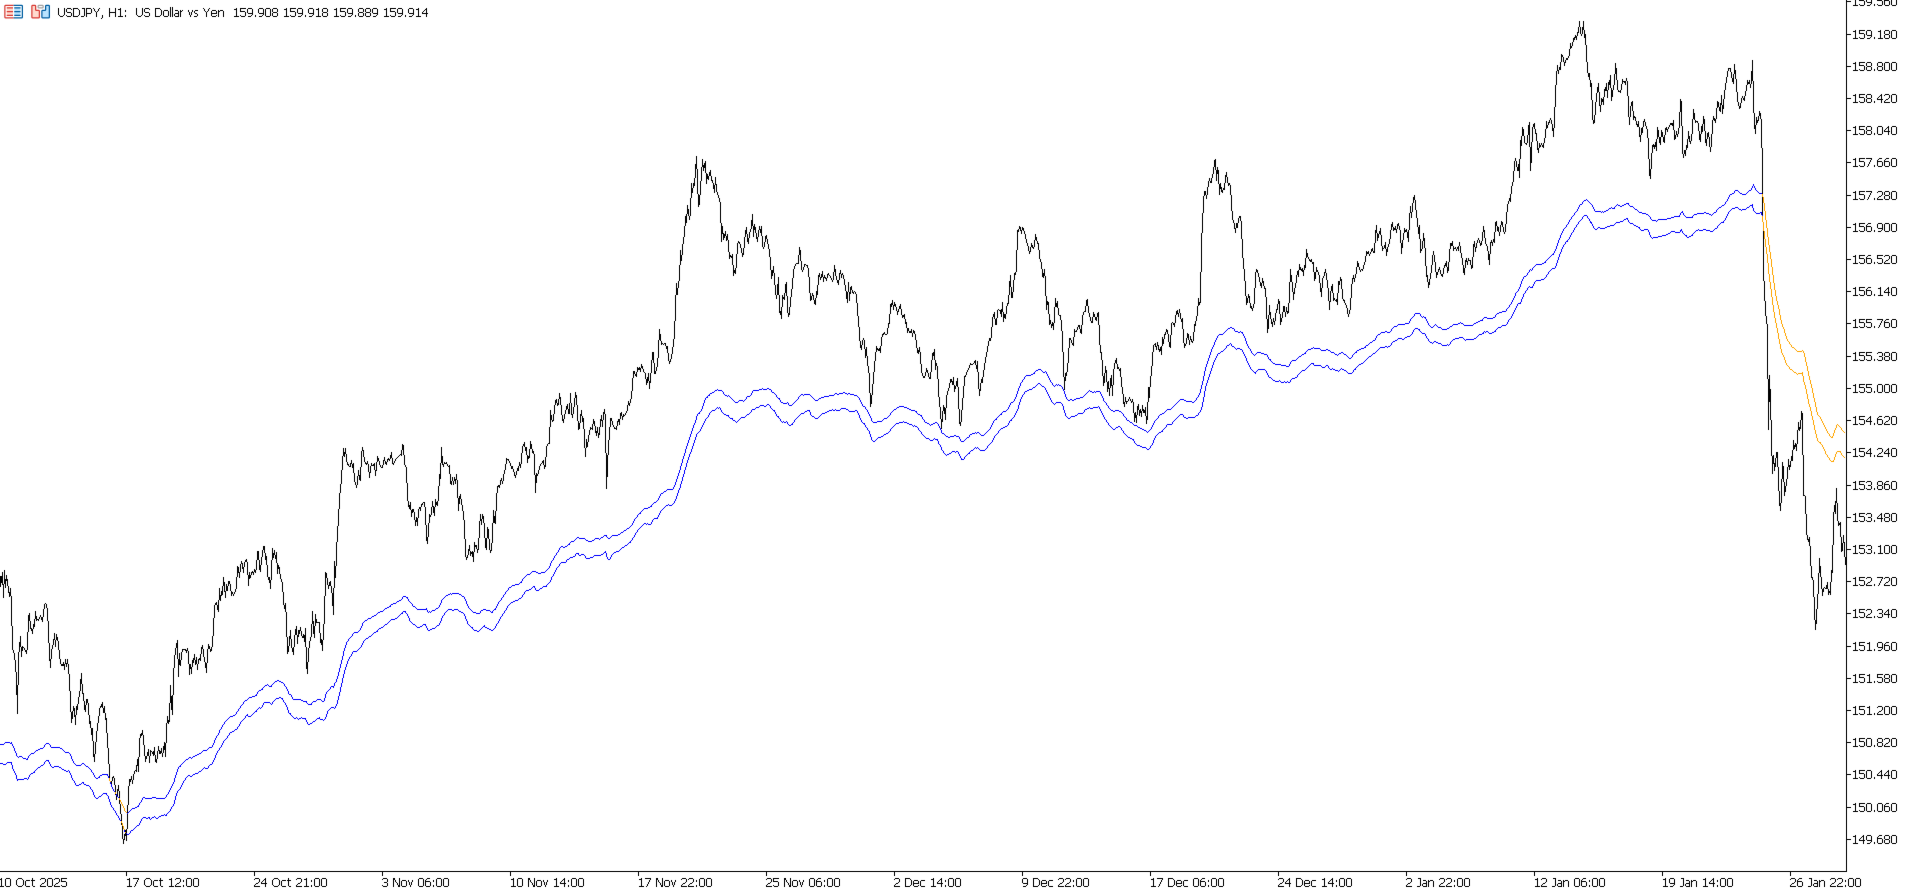
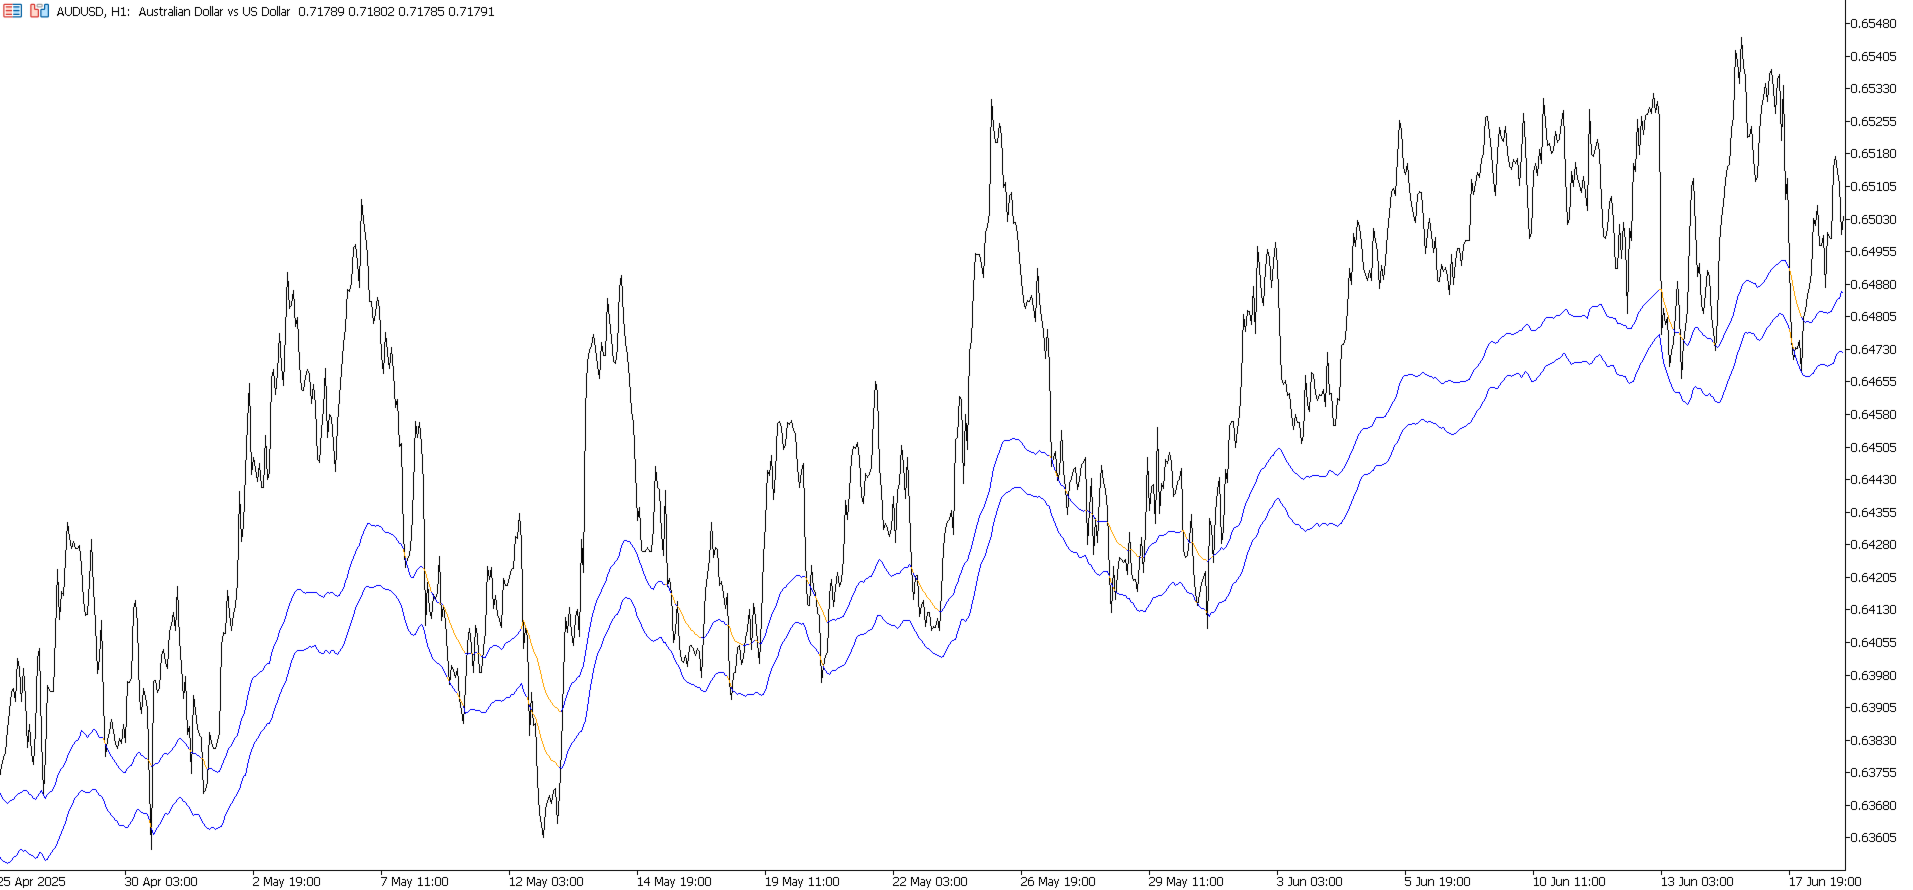
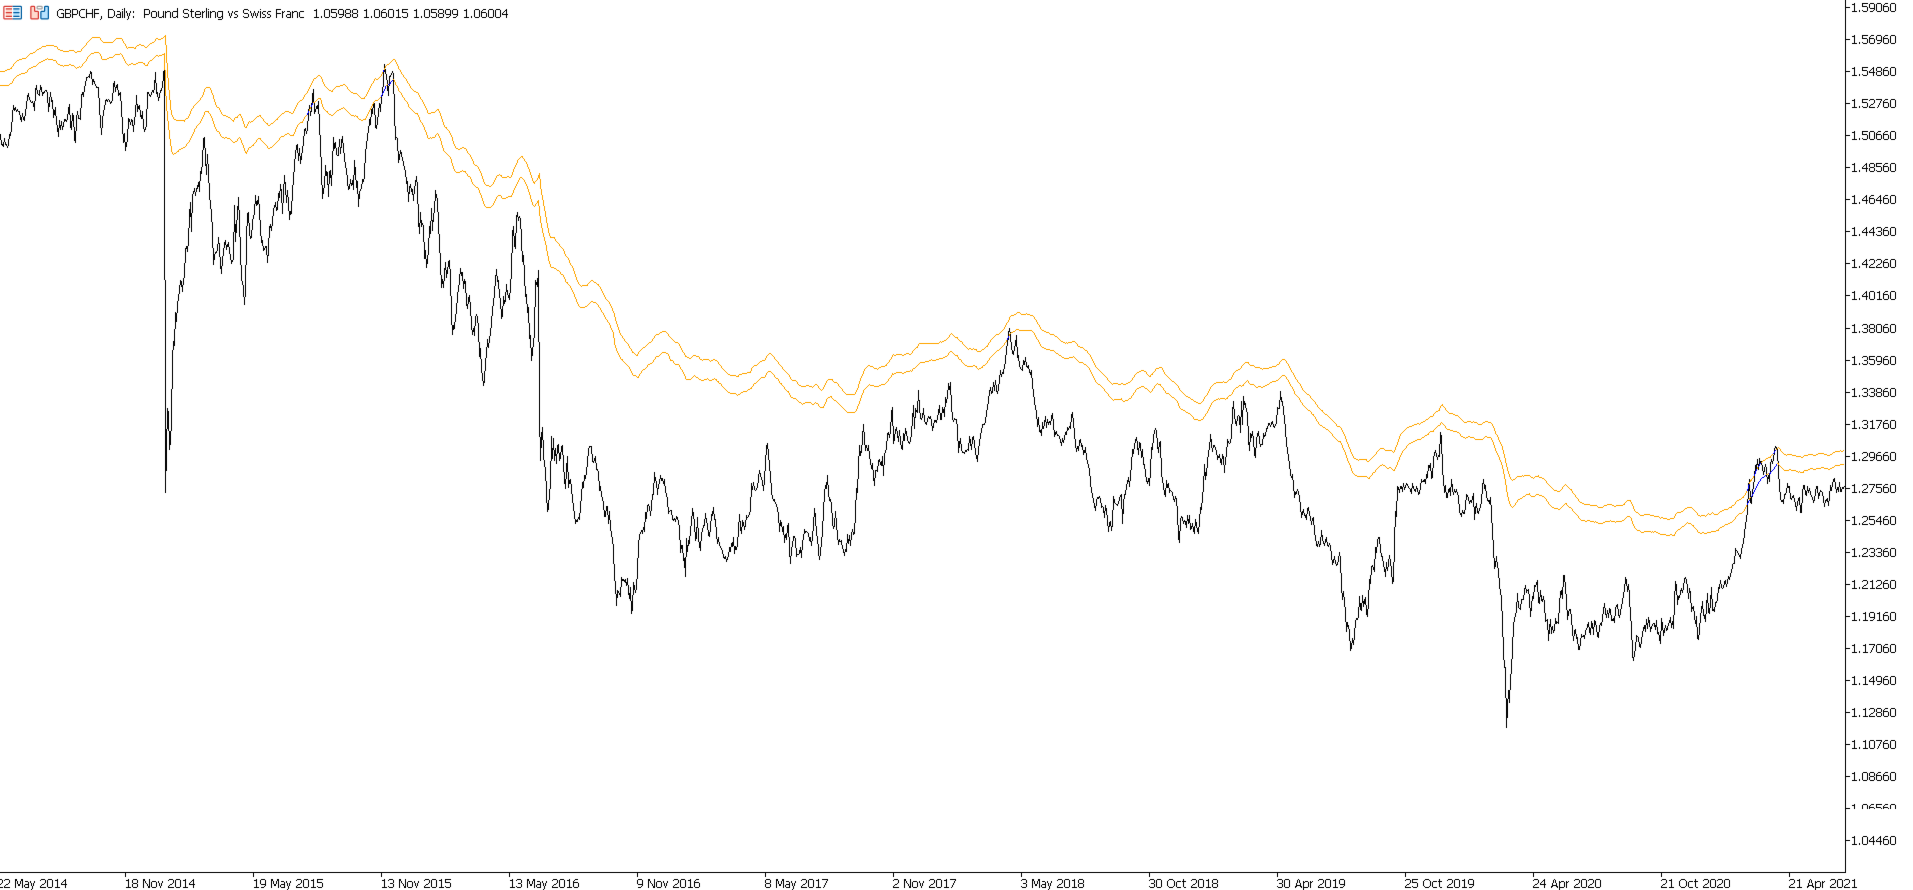
Fibonacci Moving Average is a visual trend structure indicator built around a layered Fibonacci based moving average framework.

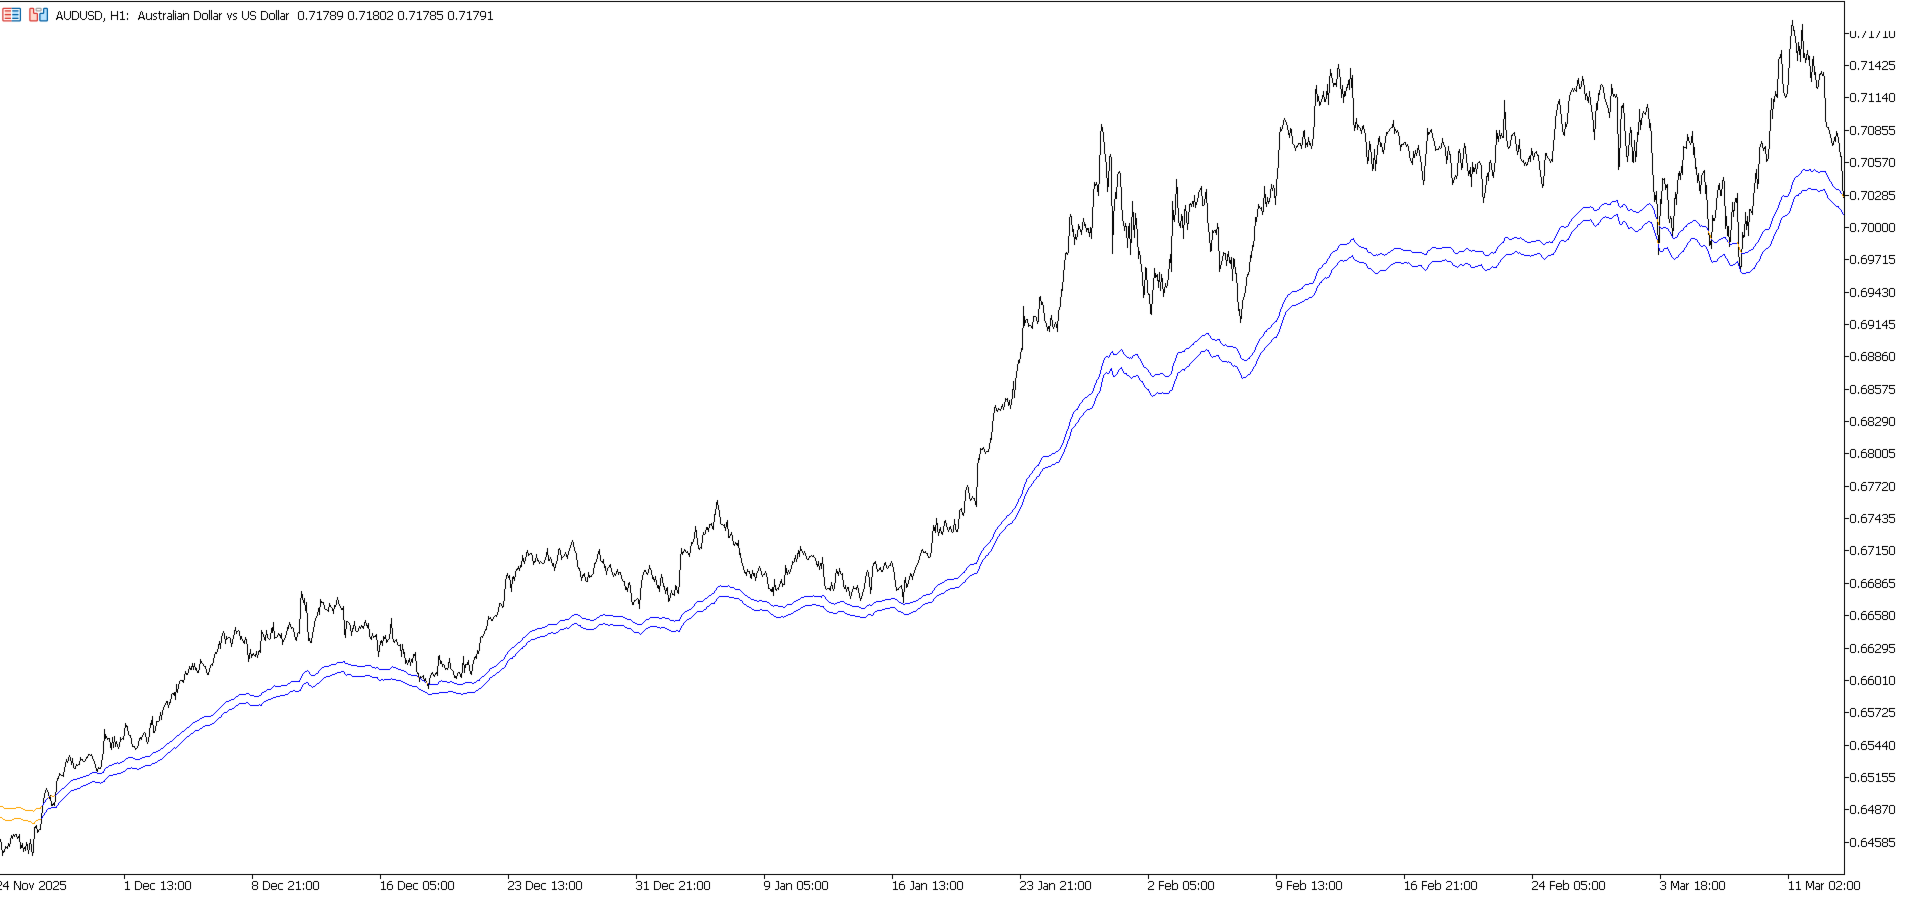
The indicator plots two dynamic average lines directly on the price chart, creating a clean view of how price behaves relative to broader trend structure. The lines automatically change color depending on the position of price, making market direction easier to read at a glance.

Visual Logic

• Blue line state: price is trading above the Fibonacci average
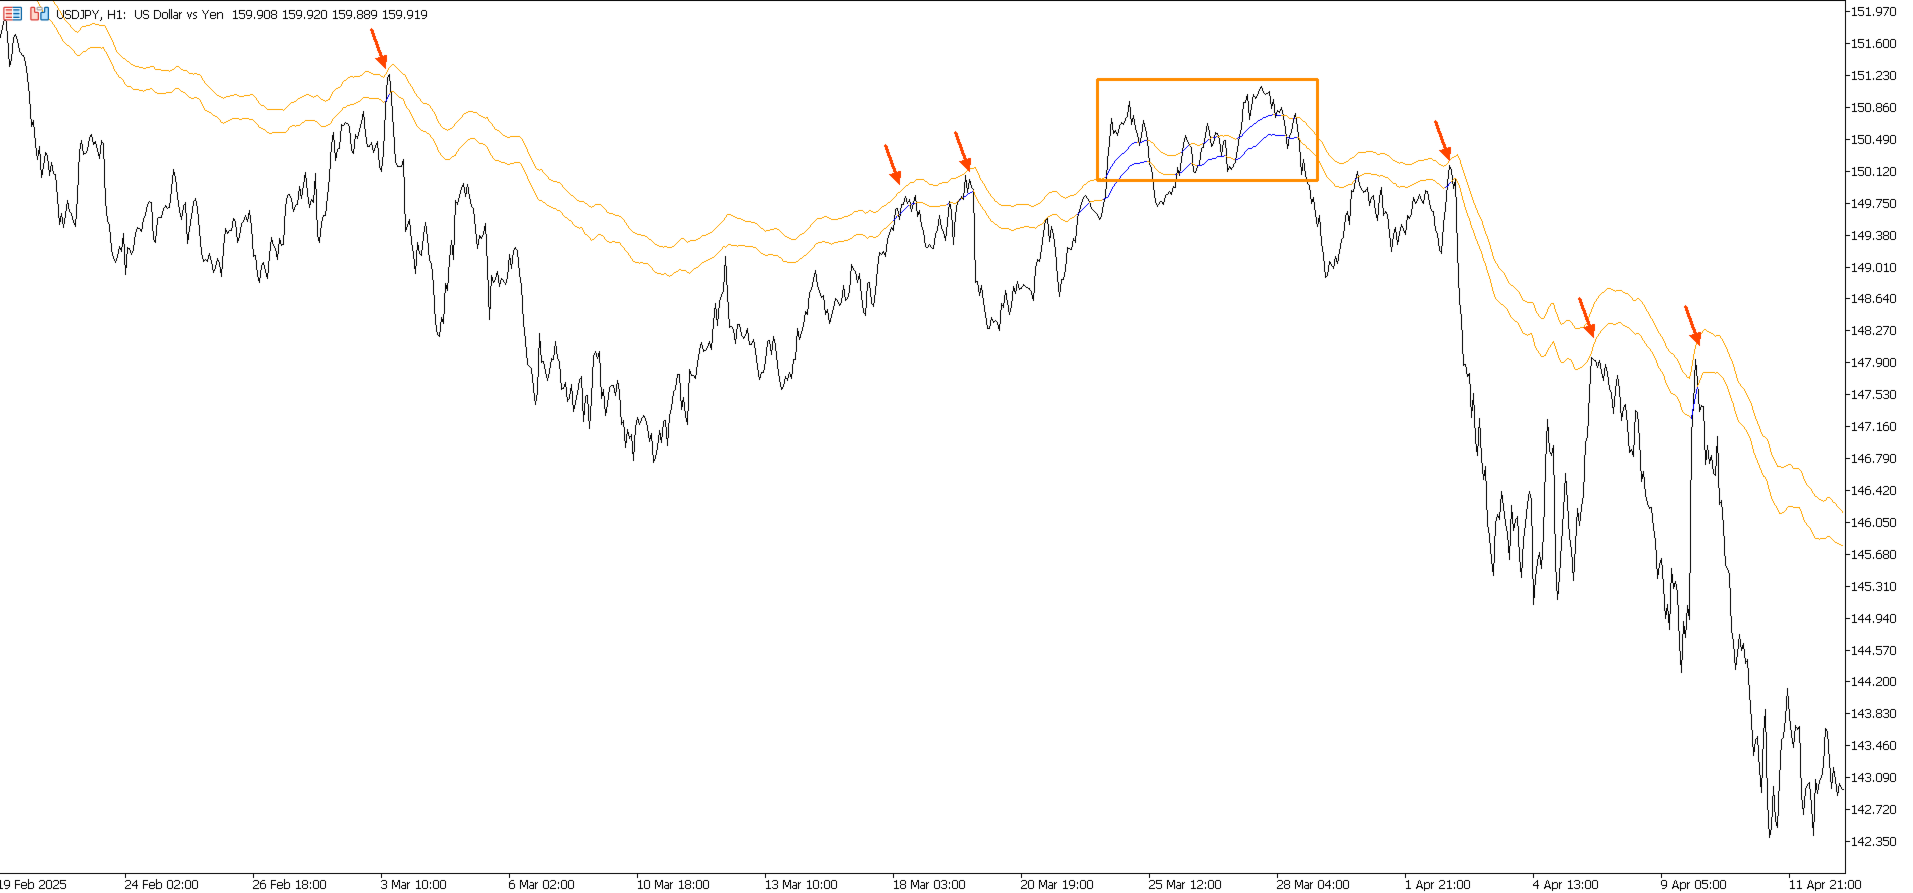
• Orange line state: price is trading below the Fibonacci average

This gives traders a simple way to identify when price is holding above or below an important moving average structure.

Key Features

• Fibonacci inspired moving average framework
• Two dynamic price structure lines
• Automatic blue and orange color switching
• Clean overlay directly on the main chart
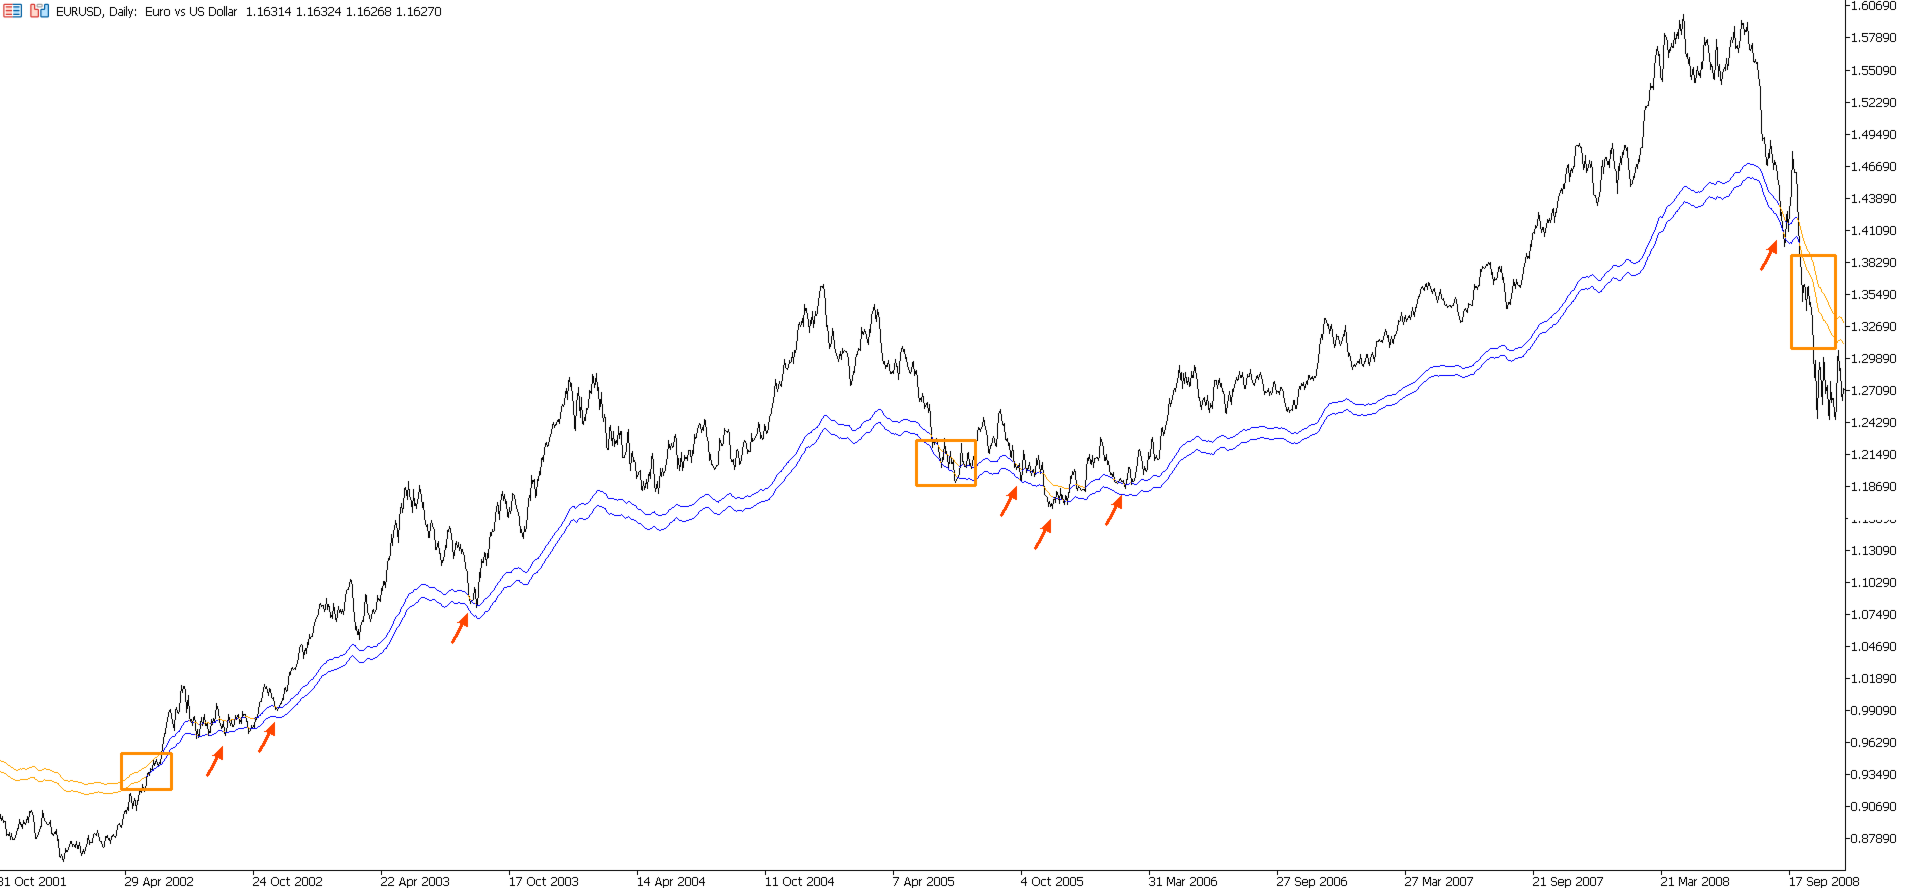
• Suitable for multiple markets and timeframes
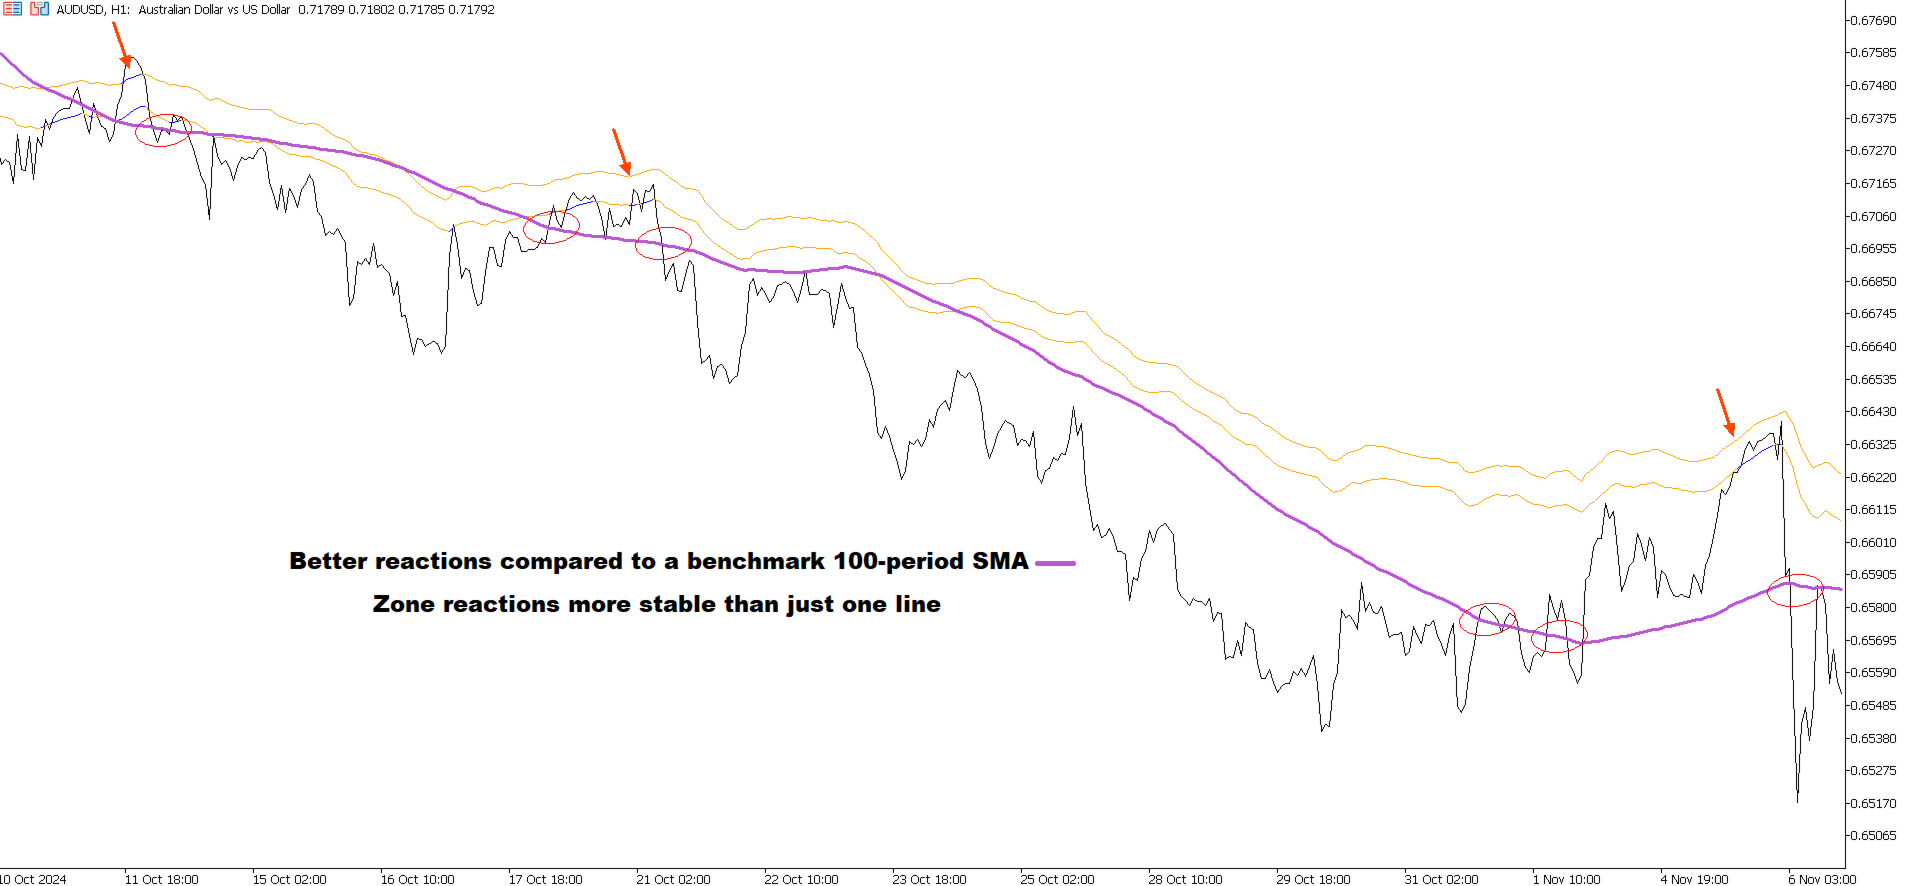
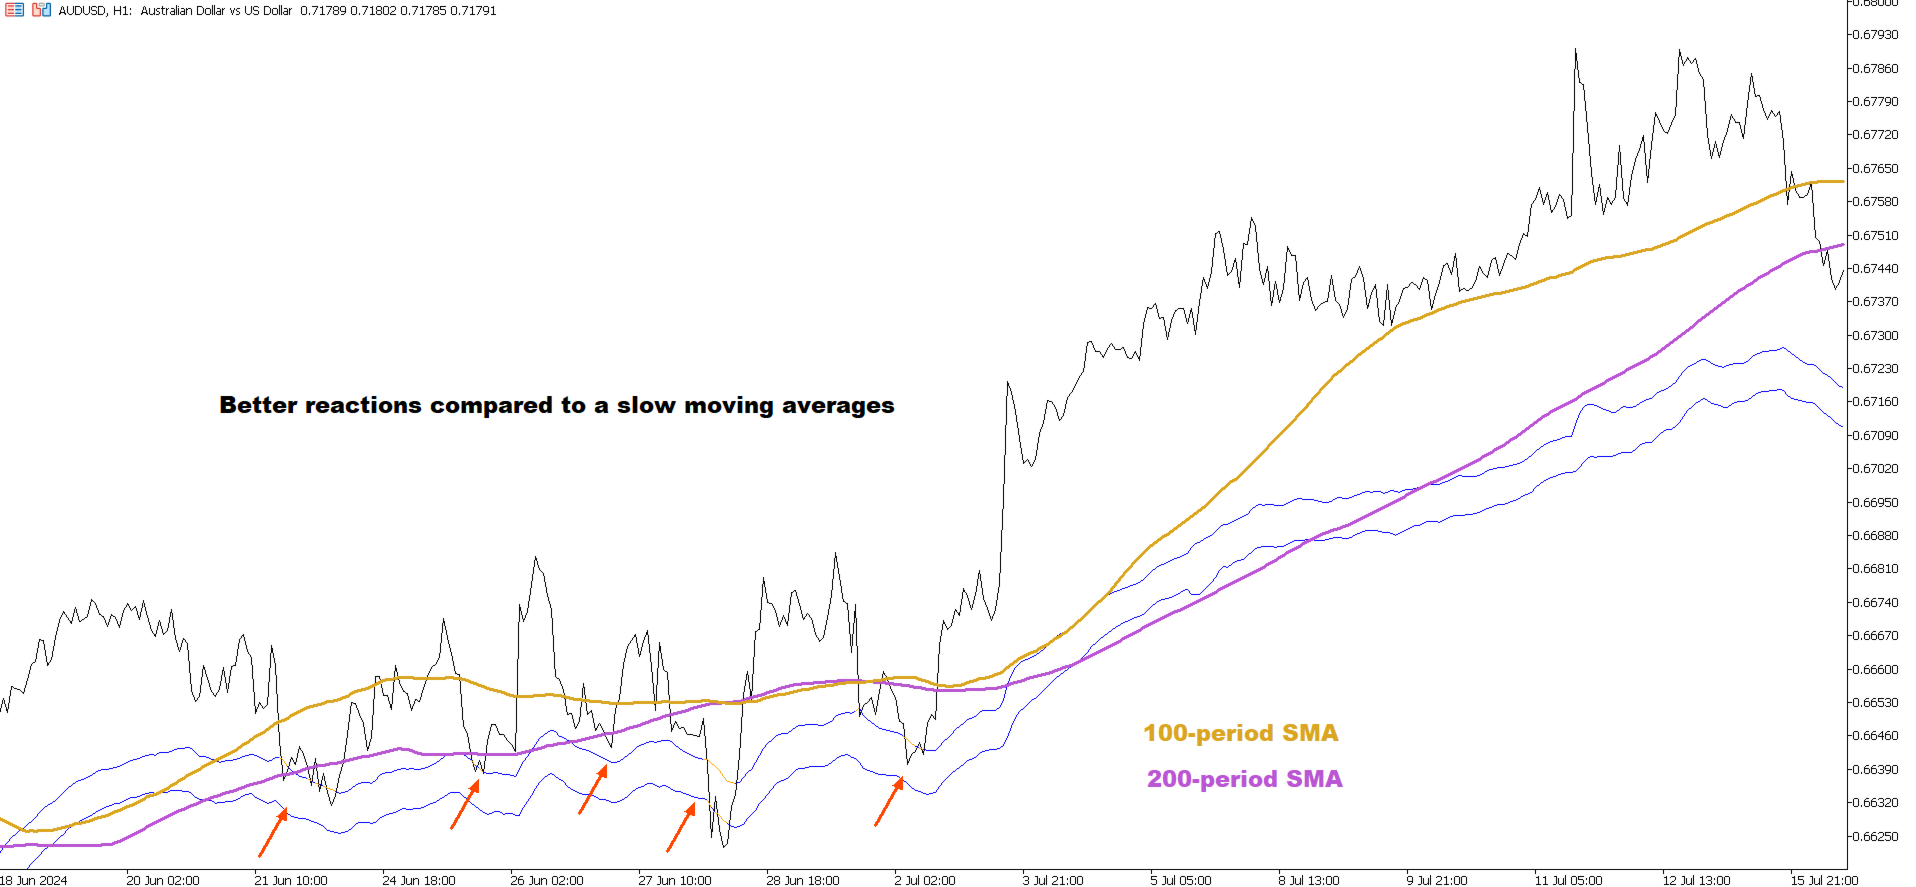
• Useful for trend reading, pullback context, and directional filtering
• Minimal design with no unnecessary chart clutter

How to Use

When price trades above the Fibonacci average structure, the line turns blue, suggesting stronger upward pressure.

When price trades below the Fibonacci average structure, the line turns orange, suggesting weaker or bearish pressure.

The indicator can be used to assess trend direction, identify pullback zones, filter trade setups, or support broader price action analysis.

Important

Fibonacci Moving Average is a decision support tool. It does not guarantee future market direction and should not be used as a standalone trading system. Traders should test it on their preferred symbols and timeframes before using it in live trading conditions.


作者のその他のプロダクト
Orange Indicator by Quant Atlas Creator:  https://www.quant-atlas.com/ Orange Indicator is a clean reversal focused indicator for MetaTrader 5, designed to highlight potential turning points directly on the chart using simple orange buy and sell markers. The indicator focuses on moments where price may be transitioning out of short term exhaustion and into a possible reaction phase. When a bullish setup appears, an orange upward triangle is displayed below the candle. When a bearish setup appear
FREE
Red Indicator  by Quant Atlas Creator:  https://www.quant-atlas.com/ Red Indicator is a clean reversal focused tool designed to highlight moments where price may be moving away from an extreme condition and entering a potential turning zone. The indicator uses a price derived volatility framework to detect areas where market pressure may have become stretched. When conditions align, it plots red triangle signals directly on the chart. Both bullish and bearish signals use the same red visual iden
FREE
Vision  by Quant Atlas Creator:  https://www.quant-atlas.com/ Vision by Quant Atlas  is a multi component reversal signal indicator designed to identify short term bullish and bearish exhaustion points across liquid markets. The model aggregates several independent technical evidence layers, including momentum behavior, mean reversion pressure, volatility based conditions, trend interaction, timing structure, and moving average related confirmation. The final output is converted into visual conv
K’s Reversal Indicator I   by Quant Atlas Creator:  https://www.quant-atlas.com/ K’s Reversal Indicator I is a clean reversal focused indicator designed to help traders identify potential bullish and bearish turning points directly on the chart. The indicator highlights moments where the market may be approaching exhaustion and where a tactical reversal setup may be forming. Signals are displayed with simple visual triangles, making the tool easy to read without cluttering the chart. Key idea Ma
Three Dimensional Reversal Indicator  by Quant Atlas Creator:  https://www.quant-atlas.com/ Three Dimensional Reversal Indicator is a clean and focused reversal tool designed to identify potential market turning points through a three dimensional view of price behavior. The model combines three key dimensions: • Time How long market pressure has remained one sided. • Price Where price is currently positioned relative to its recent behavior. • Price Derived Structure A transformed view of pric
Violet Indicator  by Quant Atlas Creator:  https://www.quant-atlas.com/ Violet Indicator is a clean reversal focused trading tool designed to identify moments where price may be shifting away from an extended directional condition. The indicator uses a price derived trend framework to detect moments where market structure may be changing. When conditions align, it plots violet triangle signals directly on the chart. Both bullish and bearish signals use the same violet visual identity, giving the
FREE
フィルタ:
レビューなし
レビューに返信