BeST IFT of Oscillators Collection
- インディケータ
- バージョン: 1.20
- アップデート済み: 11 12月 2019
- アクティベーション: 10

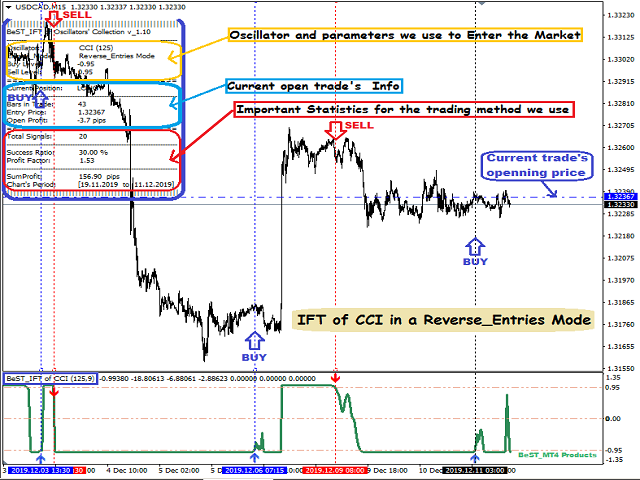
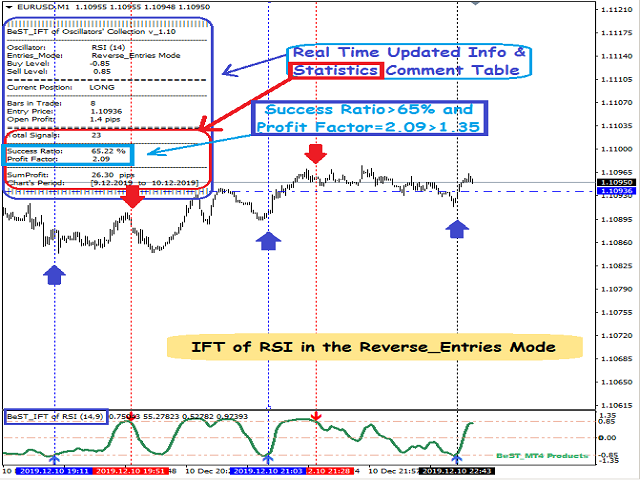
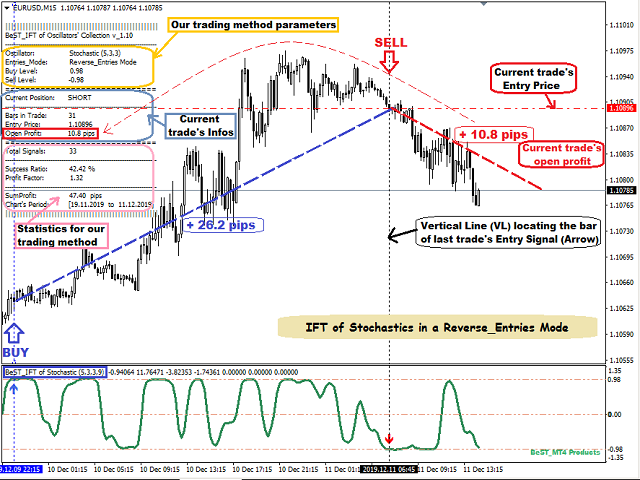
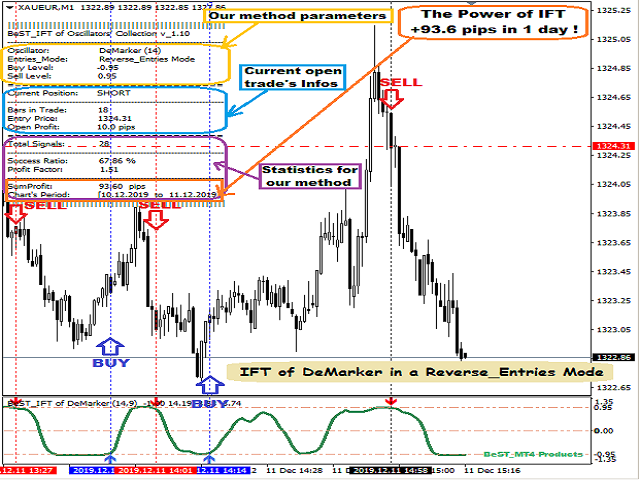
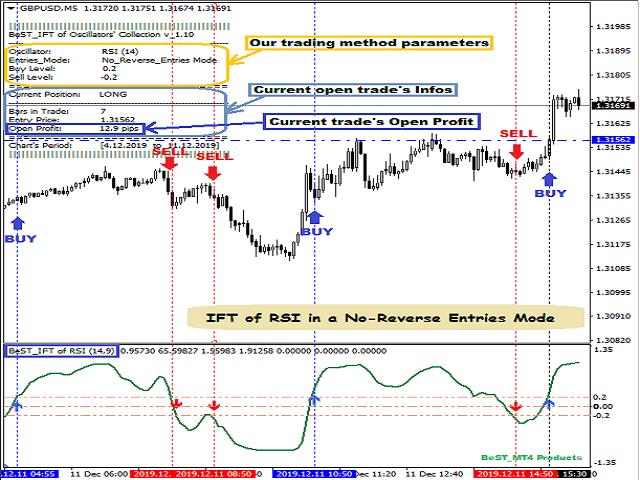
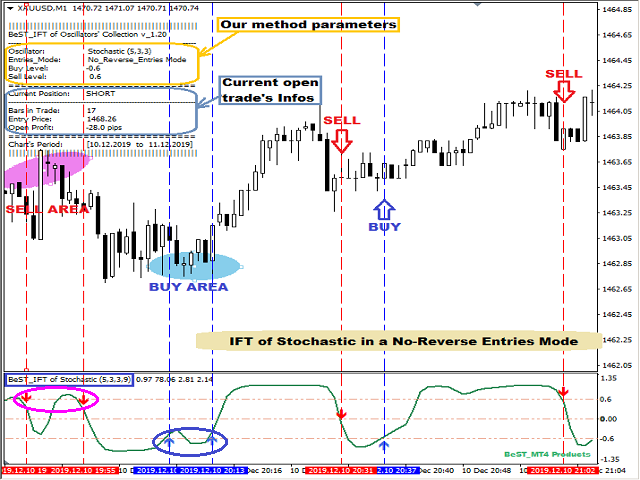
BeST_IFT of Oscillators Collection is a Composite MT4 Indicator that is based on the IFT (Inverse Fisher Transformation) applied to RSI, CCI, Stochastic and DeMarker Oscillators in order to find the best Entry and Exit points while using these Oscillators in our trading.The IFT was first used by John Ehlers to help clearly define the trigger points while using for this any common Oscillator ( TASC – May 2004).All Buy and Sell Signals are derived by the Indicator’s crossings of the Buy or Sell Level defined by the user as external parameters while the Indicator also provides the option of displaying the resulting Signals as Arrows in a Normal Mode (all arrows) or in a Reverse Mode (without showing up any resulting successive and of same type arrows).
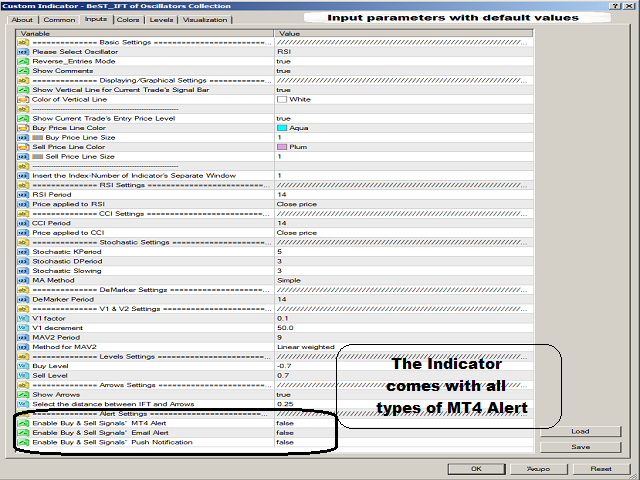
Input Parameters
Basic Settings
- Select Oscillator – for selecting the Oscillator for applying IFT. We can select among the RSI,CCI,Stochastics and DeMarker.
- Reverse_Entries Mode
- if true then we get the Entry Signals (Arrows) in a Reverse Mode without showing up any resulting successive and of same type arrows
- if false we get the Entry Signals in a Normal Mode/No_Reverse_Entries Mode (all possible Arrows).
- Show Comments – for selecting to show the New Info Table on the main Chart area.
Important Note:
- For Reverse_Entries Mode we get a Real Time Updated Info and Statistics Comment Table and so we can have some very useful infos about the current open trade ( Entry Price,Number of Bars in trade,Open Profit in pips) but also some very important statistics like % Success Ratio and Profit Factor for the corresponding Oscillator Type, its parameters, Buy and Sell Levels Value and always for the Current Chart Symbol, Time Period and Timeframe.
- For example getting a Success Ratio >=65% and Profit Factor>1.30+ we can have a better possibility for the next trade to be profitable!
- For Normal Entries Mode where we can have >=2 consecutive signals (arrows) of the same type we just get a Real Time Updated Info Comment Table about the current open trade.
Displaying/Graphical Settings - for selecting which main chart objects and their features to show or activate like Vertical Line locating the last Entry Signal and the corresponding Entry Price Level Horizontal Line.
Insert # of Indicators Window – for inserting the index of the separate window we use for the indicator in order to function correctly the Level lines of the Oscillators.
RSI Settings – for selecting the RSI parameters.
CCI Settings – for selecting the CCI parameters.
Stochastic Settings – for selecting the Stochastic parameters.
DeMarker Settings - for selecting the DeMarker parameters.
V1 & V2 Settings - for selecting the input parameters of V1 and V2 (V1 value,V1 increment, MA_period and MA_Method) where V1 nad V2 are elements of IFT calculation.
Levels Settings – for selecting the Buy and Sell trigger levels of the IFT line.
Arrows Settings
- Show Arrows - for selecting to Show or Not the Buy and Sell Signals’ Arrows based on the crosses between the IFT line and it’s trigger levels.
- Select the distance between IFT and Arrows - for a better appearance.
Alert Settings - for controlling the use of trigger points MT4 alerts
For EA Developers
Buy Arrow : Buffer = 1
Sell Arrow : Buffer = 2
The IFT oscillators have been professionally made - well done for an excellent indicator! Kudos Eleni