LT Easy Market
- インディケータ
- バージョン: 2.1
- アップデート済み: 20 12月 2022
- アクティベーション: 5

LT Easy Market - あらゆる市場を精密なトレードゾーンに変える
強いトレンド相場でトレードしようとして、迷子になったことはありませんか?あるいは、レンジ相場(保ち合い)でのエントリーポイントがはっきりと見えず、悔しい思いをしたことはありませんか?LT Easy Marketは、このジレンマを解決するために開発されました。値動きを完全に「正規化」し、常にレンジ(横ばい)状態であるかのような視覚効果を作り出すことで、買われすぎ・売られすぎのエクストリーム(極値)を外科手術のような精密さで簡単に見つけられるようにします。
== 正規化の魔法 ==
アセット(資産)が持つ本来の激しいボラティリティに振り回される代わりに、Easy Marketはスマートなアルゴリズムを適用し、あらゆる値動きを標準化されたスケール(尺度)に変換します。その結果、相場がトレンド状態であろうとレンジ状態であろうと、保ち合いや押し目・戻りにおける明確なエントリーチャンスを見極めることができます。
== 主な特徴 ==
-
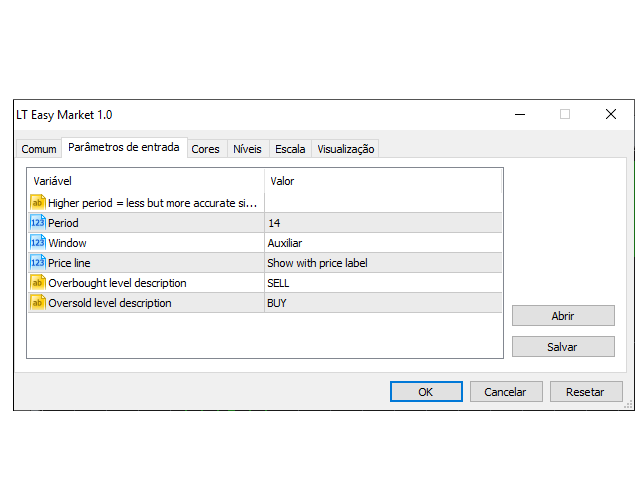
100% 自動正規化: ボラティリティを固定された予測可能なスケールに変換
-
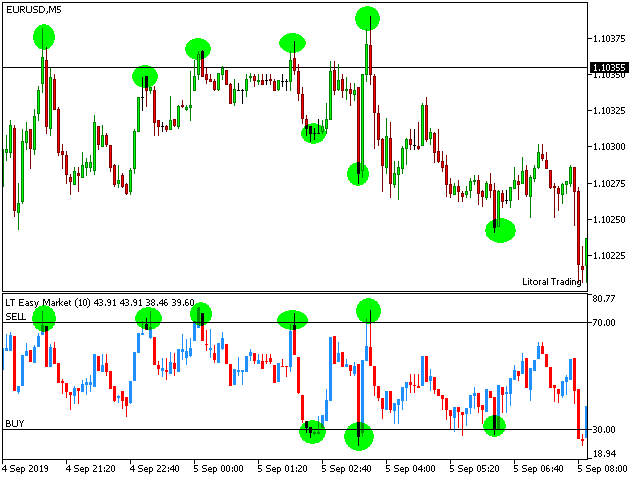
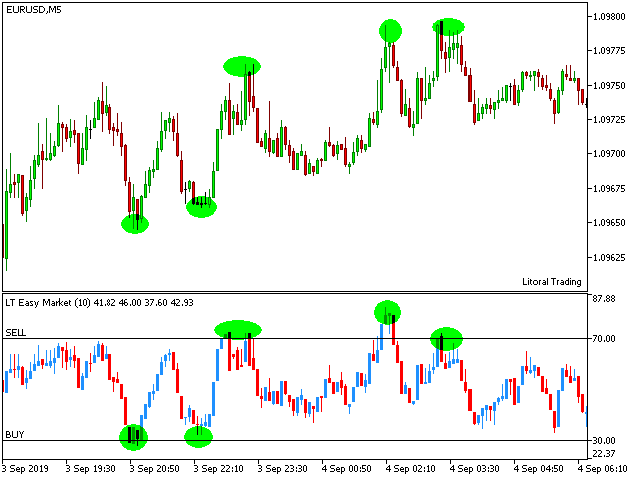
極値(エクストリーム)検出: 買われすぎ(>70)および売られすぎ(<30)ゾーンを特定
-
あらゆるアセットに対応: FX、インデックス(指数)、株式、暗号資産、コモディティ(商品)
-
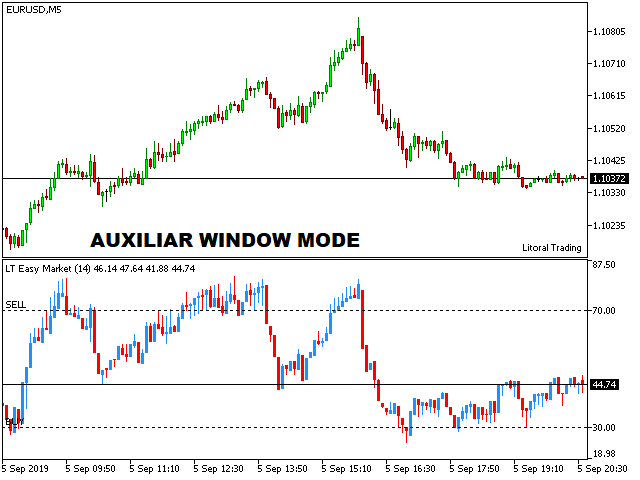
2つの表示モード: サブウィンドウ(auxiliary window)または全画面(fullscreen)
-
アラート機能内蔵: 重要なゾーンに達した際、ポップアップおよびプッシュ通知で追跡
-
クリアな視覚シグナル: リアルタイム分析を容易にするカラーローソク足
== 最適なユースケース ==
-
レンジトレーダー: 最も理想的なシナリオ — 永遠に続くレンジ相場
-
押し目・戻り狙いのスキャルパー: 微小な反転を自信を持って特定
-
デイトレーダー: 主流トレンドの調整局面(押し目・戻り)でのエントリーを同期
-
スイングトレーダー: 保ち合いの天井と底をピンポイントで特定
== 仕組み ==
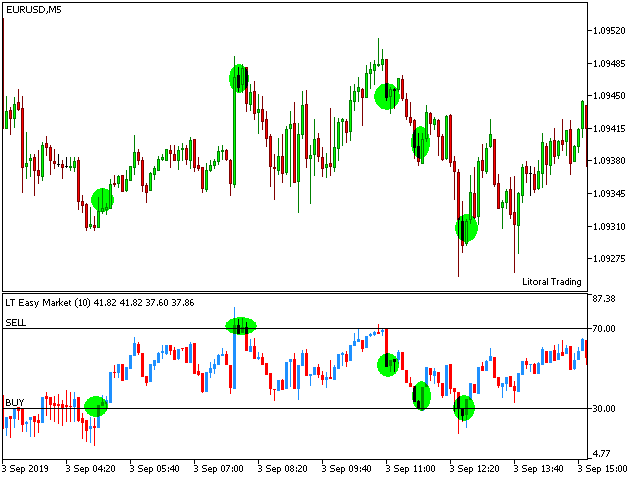
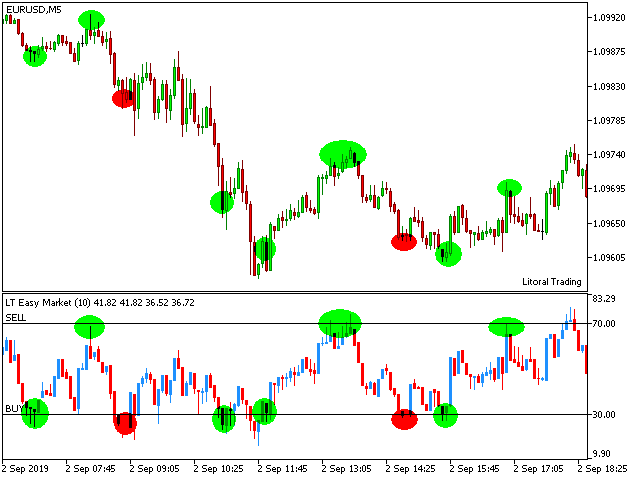
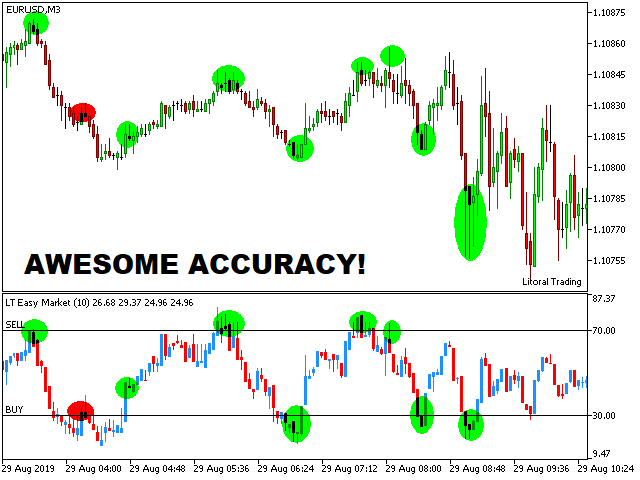
相場が常に保ち合い(レンジ)にあるかのように価格を視覚化します。数値が70を超えている場合は「買われすぎ(売りゾーン)」、30を下回っている場合は「売られすぎ(買いゾーン)」となります。
これらのレベルの間で、テクニカル分析の根拠(合流点)を組み合わせながら、最適なエントリーチャンスを見つけ出します。
== サポート ==
ご質問やご提案はございますか?お気軽にお問い合わせください!皆様の成功を全力でサポートいたします。MQL5.comのチャットまたはコメントタブをご利用ください。
注意: 100%完璧なインジケーターは存在しません。常に適切なリスク管理を行ってください。


The accuracy of Easy Market is truly impressive. The screenshots provided by the developers showcase how it delivers precise entry points. As someone who values accuracy in trading, I can attest that this indicator has significantly improved the timing of my trades, leading to more profitable outcomes. The developer behind Easy Market are clearly dedicated to user satisfaction. Their invitation to contact them for any doubts or suggestions reflects a commitment to ongoing improvement. I haven't had the need to reach out for support yet, but knowing that assistance is readily available adds an extra layer of confidence. In conclusion, Easy Market is a game-changer for traders seeking simplicity without sacrificing accuracy. Whether you're a seasoned professional or a novice in the trading world, this indicator is a valuable addition to your toolkit. The ability to effortlessly navigate both trend and consolidation markets sets Easy Market apart, making it a must-have for traders of all levels. If you're looking for a tool that makes trading easier, more accurate, and adaptable to your style, Easy Market is the answer. Don't hesitate to incorporate it into your strategy – you won't be disappointed!