Statistical Auto Levels

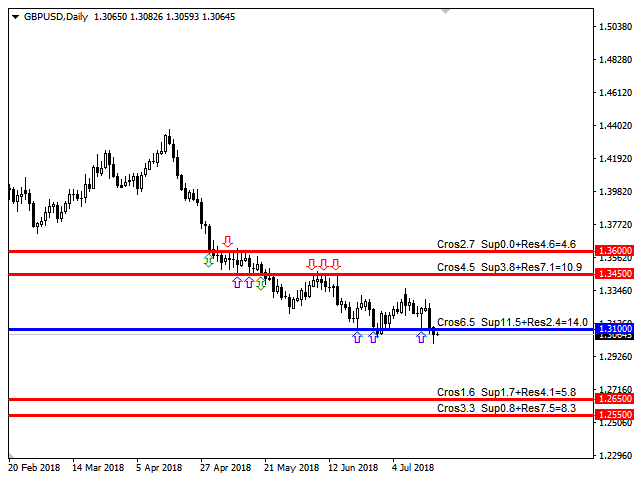
The indicator calculates the historic price statistics: the number of intersections of a level and the number of rollbacks. The levels are set as horizontal lines (the 'Horizontal lines' element on the Toolbar) manually, are are drawn automatically by the indicator with the specified step. Only strong levels are drawn in the automated mode. There are two options for the automated mode: 1. Strong levels of intersection and support/resistance; 2. Strong support/resistance levels.

The indicator uses the specified tolerance of level touching for calculating intersection and rollback cases. The tolerance is sensitive to the time period of bars. For example: for the M5 period the tolerance should be about 10 pips, for M30 is should be 30 pips, for 1 day - 300 pips. The statistics of touches and intersections are displayed in the form of an information line at each level. In this line, the 'Cros' label means the number of intersections (green arrow), the 'Sup' label means the number of supports (blue arrow), 'Res' = the number of resistances (red arrow). Arrows in history show the areas of intersection and level touches.

If the indicator paints a level in red, then the level was historically acting mostly as a resistance level. Blue color means it worked as a support level. Orange color - the level acted as support and resistance almost the same number of times. The tolerance for this difference is specified as percentage in the Levels strength parameter.

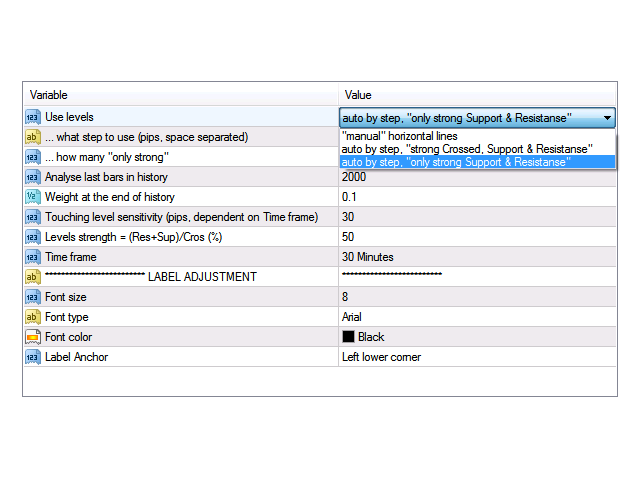
Indicator Parameters

  • Use levels - level drawing mode. You may select between manual and 2 automated modes.
  • ... what step to use (pips, space separated) - price step for strong levels. You can specify several levels separating them with a coma.
  • ... how many "only strong" - the number of strong levels above and below the price to search for.
  • Weight at the end of history - the weight coefficient for the level touch strength at the end of the history. The coefficient varies linearly, starting from the specified coefficient at the end of the history to 1 at the current bar.
  • Analyse last bars in history - analyzing the strength of the level on the specified number of historic bars.
  • Touching level sensitivity (pips, dependent on Time frame) - tolerance for level touches. Sensitive to the Time frame parameter.
  • Levels strength = (Res+Sup)/Cros (%) - level strength tolerance.
  • Time frame - timeframe of analyzed bars.
  • Font size - font size for the level information line.
  • Font type - font type for the level information line.
  • Font color - font color for the level information line.
  • Label Anchor - location of the statistics data.
おすすめのプロダクト
「Auto FIBO Pro」Crypto_Forex インジケーターは、取引の補助ツールとして最適です。 - インジケーターは、フィボナッチ レベルとローカル トレンド ライン (赤色) を自動的に計算してチャート上に配置します。 - フィボナッチ レベルは、価格が反転する可能性のある重要な領域を示します。 - 最も重要なレベルは、23.6%、38.2%、50%、61.8% です。 - リバーサル スキャルピングやゾーン グリッド取引に使用できます。 - Auto FIBO Pro インジケーターを使用して、現在のシステムを改善する機会も多数あります。 - Info Spread Swap Display があり、接続されている外国為替ペアの現在のスプレッドとスワップを表示します。 - ディスプレイには、アカウントの残高、エクイティ、マージンも表示されます。 - Info Spread Swap Display は、チャートのどのコーナーにも配置できます。 0 - 左上コーナー、1 - 右上、2 - 左下、3 - 右下。 // 素晴らしいトレーディング ロボットとインジケーター
We present you the indicator "Candle closing counter", which will become your indispensable assistant in the world of trading. That’s why knowing when the candle will close can help: If you like to trade using candle patterns, you will know when the candle will be closed. This indicator will allow you to check if a known pattern has formed and if there is a possibility of trading. The indicator will help you to prepare for market opening and market closure. You can set a timer to create a pre
トレンドキャッチャー: アラートインジケーター付きのトレンドキャッチャーストラテジーは、市場トレンドやポテンシャルなエントリーポイントやエグジットポイントを特定するのに役立つ多目的な技術分析ツールです。動的なトレンドキャッチャーストラテジーを備えており、市場状況に適応してトレンドの方向を明確に視覚化します。トレーダーは、自身の好みやリスク許容度に合わせてパラメーターをカスタマイズできます。このインジケーターはトレンドの識別を支援し、ポテンシャルなリバーサルをシグナルし、トレイリングストップのメカニズムとして機能し、市場への迅速な対応のためのリアルタイムアラートを提供します。 特徴: - トレンドの識別:上昇トレンドと下降トレンドをシグナルします。 - トレンドのリバーサル:ローソク足の色が上昇から下降に変わった場合やその逆の場合に、ポテンシャルなリバーサルを警告します。 - リアルタイムアラート:新しいトレンドの識別に対するアラートを生成します。 推奨事項: - 通貨ペア:EURUSD、AUDUSD、XAUUSDなど... - タイムフレーム:H1。 - アカウントタイプ:
FREE
Risk Management Protect utility is designed to maximize your trading efficiency: Automatically closing all open trades when your total floating profit hits a predefined threshold/value.e.g+100$ Automatically closing all open trades when your total floating loss hits a predefined threshold/value. e.g -30$ This expert advisor ensures that you lock in gains promptly and closes losses swiftly, reducing the risk of potential market reversals.Very effective simple risk management! Ideal for tra
The indicator shows the potential trend direction by cyclical-wave dependence. Thus, all the rays of the intersection will be optimal rays, in the direction of which the price is expected to move, taking into account the indicator period. Rays can be used as a direction for potential market movement. But we must not forget that the approach must be comprehensive, the indicator signals require additional information to enter the market.
KopierMaschine - локальный копировщик сделок между различными счетами MetaTrader 4 и MetaTrader 5 в любом направлении расположенных на одном компьютере с интуитивно понятным интерфейсом. Направления копирования: MT4 --> MT5 MT4 --> MT4 MT5 --> MT5 MT5 --> MT4 для копирования между терминалами MetaTrader 4 и MetaTrader   5 необходимо приобрести версию продукта KopierMaschine  для  MetaTrader   5 Особенности Программа работает в двух режимах Master и Slave На один подчиненный счет можно копировать
Owl smart levels
Sergey Ermolov
4.24 (37)
MT5版  |   FAQ Owl Smart Levels Indicator   は、 Bill Williams   の高度なフラクタル、市場の正しい波構造を構築する Valable ZigZag、エントリの正確なレベルをマークする Fibonacci レベルなどの一般的な市場分析ツールを含む 1 つのインジケーター内の完全な取引システムです。 利益を得るために市場と場所に。 戦略の詳細な説明 インジケータを操作するための指示 顧問-取引助手 プライベートユーザーチャット ->購入後に私に書いて、私はプライベートチャットにあなたを追加し、あなたはそこにすべてのボーナスをダウンロードすることができます 力はシンプルさにあります! Owl Smart Levels   取引システムは非常に使いやすいので、専門家にも、市場を勉強し始めて自分で取引戦略を選択し始めたばかりの人にも適しています。 戦略と指標に秘密の数式や計算方法が隠されているわけではなく、すべての戦略指標は公開されています。 Owl Smart Levels を使用すると、取引を開始するためのシグナルをすばやく確認し、注
Free automatic Fibonacci is an indicator that automatically plots a Fibonacci retracement based on the number of bars you select on the BarsToScan setting in the indicator. The Fibonacci is automatically updated in real time as new highest and lowest values appears amongst the selected bars. You can select which level values to be displayed in the indicator settings. You can also select the color of the levels thus enabling the trader to be able to attach the indicator several times with differe
FREE
Reversal Pattern Pro
Boonyapagorn Rodvattanajinda
Reversal Patterns Pro Reversal Patterns Pro is a Price Action (PA) analytical tool that scans the reversal patterns.  - Finds and marks the most dependable Japanese candlestick patterns in real-time. - Supports all time frames (Best for Scalping) - Doesn't repaint making it an exceptional indicator for Expert Advisors. Input parameters : - Support & Resistance Mode ( true or false ) for enabling advanced filtering - Donchian Period - RSI Period - RSI Oversold Level - RSI Overbought Level - Al
Watch your account Protect your capital with precision alerts for Balance, Equity, Margin, Margin level . Introducing: Balance, Equity, Margin, Margin level, Telegram Alerts and more expert advisor, A smart Expert Advisor for Meta Trader 4 that monitors your account in real time and sends instant alerts when critical thresholds are breached. What Makes This EA Different? Balance 1 Alerts:  When your balance drops to 75% or 50% or any percent you want. Balance 2 Alerts:  When your balance drops t
SMC Venom Model BPR インジケーターは、スマート マネー (SMC) コンセプトで取引するトレーダー向けのプロフェッショナル ツールです。価格チャート上の 2 つの主要なパターンを自動的に識別します。 FVG   (フェアバリューギャップ) は、3 本のローソク足の組み合わせで、最初のローソク足と 3 番目のローソク足の間にギャップがあります。ボリュームサポートのないレベル間のゾーンを形成し、価格修正につながることがよくあります。 BPR   (バランス価格範囲) は、2 つの FVG パターンの組み合わせで、「ブリッジ」を形成します。これは、価格がボリュームアクティビティの少ない動きで動くときに、ブレイクアウトしてレベルに戻るゾーンで、ローソク足の間にギャップを作成します。 これらのパターンは、大規模な市場プレーヤーと一般参加者の相互作用が発生するチャート上のボリュームと価格動向の分析に基づいて、トレーダーが主要なサポート/レジスタンス レベル、ブレイクアウト ゾーン、エントリ ポイントを識別するのに役立ちます。 インジケーターは、長方形と矢印の形でパターンを視
Trend PA
Mikhail Nazarenko
5 (3)
The Trend PA indicator uses   Price Action   and its own filtering algorithm to determine the trend. This approach helps to accurately determine entry points and the current trend on any timeframe. The indicator uses its own algorithm for analyzing price changes and Price Action. Which gives you the advantage of recognizing, without delay, a new nascent trend with fewer false positives. Trend filtering conditions can be selected in the settings individually for your trading style. The indicator
This system was created for the NASDAQ (NQ) in intraday trading (H1). Its logic is based on detecting breakouts after phases of relative calm and riding the momentum with risk management defined from the very start.The design was validated over 10 years of historical data, using in-sample/out-of-sample analysis, Walk Forward, and various robustness tests.It’s a slow, low-frequency bot that tends to trigger about ~9 times per month on average. It is aimed at experienced algorithmic traders who va
Now, you have your very own   PROP FIRM AUTO-CLOSER   program! Once your account target or drawdown hits, all open orders will close automatically. ========================================== INPUTS: Account target (exact amount):   Put the exact account target. Once the equity hits your specied account balance target, all open orders will close. Make sure to add some buffer to consider slippage. Use fixed value or dynamic value:   Choose whether you will need a fixed value or dynamic value for
Ultimate Trade Assistant MT4 — 다기능 트레이딩 어시스턴트 66개 이상의 강력한 기능으로 리스크 관리, 자동 주문, 시장 분석을 한 번에! 리스크 계산, 주문 제어, 차트 분석 기능을 하나로 통합했습니다. 전문 트레이더뿐 아니라, 체계적인 거래를 원하는 모든 사용자를 위해 설계되었습니다. 외환, 지수, 주식, 암호화폐 등 다양한 시장에서 완벽하게 작동합니다. 주요 기능 원클릭 거래 및 포지션 관리 자동 로트 및 리스크 계산 으로 효율적 트레이딩 스마트 주문: 그리드, OCO, 숨김 주문, 가상 SL/TP 트레일링 스탑, 부분 청산, 자동 종료 기능 변동성, 통화 강도, 세션 분석 및 시각적 알림 전체 가이드 가이드 읽기 데모 버전 데모 버전 사용 (MT4) 개발자에게 문의 질문, 아이디어 제안 또는 버그 보고 시: 개발자에게 문의
"Impulses and Corrections 4" is created to help traders navigate the market situation. The indicator shows multi-time frame upward and downward "Impulses" of price movements. These impulses are the basis for determining the "Base" , which is composed of zones of "Corrections" of price movements, as well as "Potential" zones for possible scenarios of price movement. Up and down impulses are determined based on a modified formula of Bill Williams' "Fractals" indicator. The last impulse is always
Day Pattern
Oleksandr Martsynyshen
Description: - D ay Pattern - an indicator that helps to identify patterns of price changes for the development of trading algorithms and strategies. For whom this tool? - For developers of trading strategies and algorithms. - Medium- and long-term traders. Time frames H1-W1. Features of the indicator: - There is a function of exporting indicator values to a file of the csv format. - Using the information panel, you can conduct an express analysis of trading tool. - The indicator is sui
Expert candle finder for forex in MetaTrader 4 Expert candle finder is one of the practical trader assistant experts that is used in the forex financial market, this expert accurately identifies the candlestick patterns on the price chart as a signal, all the found candles. informs you. This expert is run on your Meta trader platform and in a very precise way, it examines all the currency pairs that are in your watch list and every currency pair that had a professional and good candlestick patt
This trading system requires the user to manually add Fibonacci, trend lines, horizontal lines, channel to perform semi-automatic or manual trading. The trading system can also be used in the tester. Trading panel provides: spread information margin information free marging Information The swap information to order for lots (requires your dealer support)
Noize Absorption Index - is the manual trading system that measures the difference of pressure between bears forces and bulls forces. Green line - is a noize free index that showing curent situation. Zero value of index shows totally choppy/flat market.Values above zero level shows how powerfull bullish wave is and values below zero measures bearish forces.Up arrow appears on bearish market when it's ready to reverse, dn arrow appears on weak bullish market, as a result of reverse expectation. S
"The trend is your friend" is one of the best known sayings in investing, because capturing large trendy price movements can be extremely profitable. However, trading with the trend is often easier said than done, because many indicators are based on price reversals not trends. These aren't very effective at identifying trendy periods, or predicting whether trends will continue. We developed the Trendiness Index to help address this problem by indicating the strength and direction of price trend
インジケーターは、古典的なガンの角度と同様に、(特定のキャンドルをクリックした後)トレンドラインのファンを構築します。インジケーターの特徴は、固定スケールで角度を作成するだけでなく、特定の数のバーの平均価格を使用することです(オプション)。 インジケーターの角度の平均価格を計算する方法は2つあります(オプション)。 1)高値から安値への(特定の数のバーの)平均価格の動きの計算。 2)平均価格の計算はオープンからクローズに移動します。 オプション: 1.Method -コーナーを構築する方法。 2. FixedScale-固定スケール(メソッドでFixed_Scaleが選択されている場合)。 3.SecondaryAngles-二次角度を描画するための許可を制御します。 4.RayRight-トレンドラインの光線を設定します。 5.DrawBackground-背景として線を描画します。 6.AnglesQuantity-角度の数。 7. Bars_To_Process-期間、バーの数、これに基づいて平均価格が決定され、角度の「速度」。ゼロ以下の場合、すべての履歴
インジケーターは、可能な限り最小のラグで 再描画せず にチャートに高調波パターンを表示します。インディケータトップの検索は、価格分析の波動原理に基づいています。 詳細設定では、取引スタイルのパラメータを選択できます。ろうそく(バー)のオープニングで、新しいパターンが形成されると、価格変動の可能性のある方向の矢印が固定され、変更されません。 インジケーターは、次のパターンとその種類を認識します:ABCD、Gartley(Butterfly、Crab、Bat)、3Drives、5-0、Batman、SHS、One2One、Camel、Triangles、WXY、Fibo、Vibrations。デフォルトでは、ABCDとGartleyの数字のみが設定に表示されます。多くの追加の構成可能なパラメーター。 主なパラメータ: ShowUpDnArrows-予想される方向矢印を表示/非表示 ArrowUpCode-上矢印コード ArrowDnCode-下矢印コード Show old history patterns-古いパターンの表示を有効/無効にします Enable alert messages,
Fibonacci SR Indicator This indicator creates support and resistance lines. This indicator is based on Fibonacci Retracement and Extension levels. It will consider many combinations of the Fibonacci levels and draw support/resistance lines based on these. This indicator uses tops and bottoms drawn by the ZigZag indicator in its calculations. The ZigZag can also be drawn on the chart, if necessary. The indicator considers many combinations of past reversal points and Fibonacci ratio levels, and w
FREE
Candlestick Pattern Scanner is a multi-timeframe and multi-symbol dashboard and alert system that checks all timeframes and currency pairs for different candlestick patterns that are formed in them. Scanner is integrated with support and resistance zones so you can check the candlestick patterns in the most important areas of the chart to find breakout and reversal patterns in the price chart. Download demo version   (works on M30,D1,W1 timeframes and 20 symbols of Market Watch window) Read the
Trendlines Chart Patterns Indicator (MT4) Automated Chart Patterns & Breakout Signals for MT4: Trade with Precision! The "Trendlines Chart Patterns Indicator" is an advanced trading tool for MetaTrader 4 (MT4) , meticulously designed to identify high-probability buy and sell signals based on dynamically forming, robust trend lines and popular chart patterns . This powerful forex indicator automates the complex process of identifying patterns like triangles, flags, ranges, ascending/descending tr
Overview Harmonic Patterns MT4 is a technical analysis indicator designed for the MetaTrader 5 platform. It identifies and displays harmonic price patterns, such as Butterfly, Cypher, Crab, Bat, Shark, and Gartley, in both bullish and bearish directions. The indicator calculates key price levels, including entry, stop loss, and three take-profit levels, to assist traders in analyzing market movements. Visual elements and customizable alerts enhance usability on the chart. Features Detects six ha
This is an intraday indicator that uses conventional formulae for daily and weekly levels of pivot, resistance and support, but updates them dynamically bar by bar. It answers the question how pivot levels would behave if every bar were considered as the last bar of a day. At every point in time, it takes N latest bars into consideration, where N is either the number of bars in a day (round the clock, i.e. in 24h) or the number of bars in a week - for daily and weekly levels correspondingly. So,
Advisor "Orders Assistant" is designed to control the positions and orders that are opened manually by the trader. The control is performed by automatically placing TakeProfit and StopLoss orders after the position is opened by the trader, or setting a pending order and further tracking the position using the services “Transfer StopLoss to breakeven” and “Trailing Stop”. The Expert Advisor also provides the ability to install virtual TakeProfit and StopLoss, which allows you to use scalping str
The Divergent Accuracy indicator is designed to identify discrepancies on the price chart of a currency pair. The Divergent Accuracy indicator recognizes bullish and bearish divergences, and can also output a signal that a divergence has been detected... In addition to identifying divergences, the indicator works with overbought and oversold levels, and also shows arrows to enter the market...
このプロダクトを購入した人は以下も購入しています
Trade Manager EAへようこそ。これは、取引をより直感的、正確、そして効率的にするために設計された究極の リスク管理ツール です。これは単なるオーダー実行ツールではなく、包括的な取引計画、ポジション管理、リスク管理のためのソリューションです。初心者から上級者、迅速な実行を必要とするスキャルパーまで、Trade Manager EAはあらゆるニーズに対応し、為替、指数、商品、暗号通貨などさまざまな市場で柔軟に対応します。 Trade Manager EAを使用すると、複雑な計算が過去のものになります。市場を分析し、エントリーポイント、ストップロス、テイクプロフィットのレベルをチャート上のラインでマークし、リスクを設定するだけで、Trade Managerが最適なポジションサイズを即座に計算し、SLとTPをピップ、ポイント、口座通貨でリアルタイムに表示します。すべての取引が簡単かつ効果的に管理されます。 主な機能: ポジションサイズ計算機 :定義されたリスクに基づいて取引サイズを瞬時に決定します。 簡単な取引計画 :エントリー、ストップロス、テイクプロフィットを設定するためのド
Copy Cat More Trade Copier MT4 (コピー猫MT4) は単なるローカル取引コピーツールではなく、現代の取引課題に対応するために設計された完全なリスク管理と実行フレームワークです。Propファームのチャレンジから個人の資産管理まで、強力な実行力、資金保護、柔軟な設定、高度な取引処理を組み合わせ、あらゆる状況に適応します。 このコピーツールは Master(送信側) と Slave(受信側) の両モードで動作し、成行注文や指値注文のリアルタイム同期、取引修正、部分決済、Close By 操作をサポートします。デモ口座・リアル口座の両方に対応し、取引用パスワードまたは投資家パスワードでも利用可能です。Persistent Trade Memory 技術により、EA・ターミナル・VPS が再起動しても復元可能です。複数の Master と Slave を同時に管理でき、ブローカー間の違いはプレフィックス/サフィックスの自動調整やシンボルマッピングで処理されます。 マニュアル/設定: Copy Cat Trading Copier マニュアル Copy Cat Mo
News Filter EA: Advanced Algo Trading Assistant News Filter EA is an advanced algo trading assistant designed to enhance your trading experience. By using the   News Filter EA , you can integrate a Forex economic news filter into your existing expert advisor, even if you do not have access to its source code. In addition to the news filter, you can also specify   trading days   and   hours   for your expert. The News Filter EA also includes   risk management   and   equity protection   features
TelegramからMT4へ: 究極のシグナルコピーソリューション Telegram to MT4 は、DLLを必要とせず、TelegramのチャンネルやチャットからMetaTrader 4プラットフォームに取引シグナルを直接コピーできる最先端のユーティリティです。この堅牢なソリューションは、比類のない精度とカスタマイズオプションにより、シグナルのシームレスな実行を保証し、時間を節約し、効率性を向上させます。 [説明書 ] [   デモ ] 主な特徴 直接的なTelegram API統合 電話番号とセキュアコードで認証します。 ユーザーフレンドリーな EXE ブリッジを使用して、チャット ID を簡単に取得および管理します。 複数のチャネル/チャットを追加、削除、更新して、同時に信号をコピーします。 高度なフィルターによる信号解析 カスタム例外語 (例: 「レポート」、「概要」) を含む不要な信号をスキップします。 柔軟な SL および TP 形式 (価格、ピップ、ポイント) をサポートします。 シグナルが価格ではなくポイントを指定する場合、エントリ ポイントを自動的に計算します。 注
MT4 to Telegram Signal Provider は使いやすく、完全にカスタマイズ可能なツールで、Telegramに信号を送信し、あなたのアカウントを信号提供者に変えることができます。 メッセージのフォーマットは 完全にカスタマイズ可能です! しかし、簡単な使用のために、あらかじめ定義されたテンプレートを選択し、メッセージの特定の部分を有効または無効にすることもできます。 [ デモ ]   [ マニュアル ] [ MT5バージョン ] [ Discordバージョン ] [ Telegramチャンネル ]  New: [ Telegram To MT5 ] セットアップ ステップバイステップの ユーザーガイド が利用可能です。 Telegram APIの知識は必要ありません。開発者が必要なものをすべて提供します。 主要機能 購読者に送信される注文の詳細をカスタマイズする機能 例えばブロンズ、シルバー、ゴールドなど、階層型のサブスクリプションモデルを作成できます。ゴールドサブスクリプションでは、すべての信号が得られますなど。 ID、シンボル、またはコメントによる注文のフ
The product will copy all telegram signal to MT4   ( which you are member  ) , also it can work as remote copier.  Easy to set up, copy order instant, can work with almost signal formats, image signal, s upport to translate other language to English Work with all type of channel or group, even channel have "Restrict Saving Content", work with  multi channel, multi MT5 Work as remote copier: with signal have ticket number, it will copy exactly via ticket number. Support to backtest signal. How to
日ごとおよび週ごとのクローズ取引履歴、現在のオープン取引、および外国為替エクスポージャーを 1 つのチャートで即座に確認できます。ヒートマップを使用して、収益性の高い取引と、取引ポートフォリオ内の現在のドローダウンの位置を特定します。 クイック クローズ ボタン クイック クローズ ボタンを使用すると、1 つのシンボルのすべての取引をクローズしたり、個々の取引を完全にクローズしたり、ボタンをクリックするだけで部分的な利益または損失を取得したりできます。リストで取引を探したり、取引の一部をクローズする方法を考えたりする必要はもうありません。ダッシュボードには、外国為替ペアの取引中に各通貨シンボルの現在のエクスポージャーも表示されるため、主要なニュース イベントの前にエクスポージャーが過剰になっている可能性のある領域を特定するのに役立ちます。ボタンを使用して、ニュースの前にエクスポージャーを即座にすばやく減らすことができます。または、ニュースがすでに発生して利益が出ている場合は、1 回のクリックでその利益をすばやく銀行に預けることができます。 オープン取引ヒートマップ 取引ヒートマッ
Grid Manual MT4
Alfiya Fazylova
4.71 (17)
「Grid Manual」は、注文のグリッドを操作するための取引パネルです。 ユーティリティはユニバーサルで、柔軟な設定と直感的なインターフェイスを備えています。 それは、損失を平均化する方向だけでなく、利益を増やす方向でも注文のグリッドで機能します。 トレーダーは注文のグリッドを作成して維持する必要はありません。 すべてが「Grid Manual」によって行われます。 注文を開くだけで十分であり、「Grid Manual」は注文のグリッドを自動的に作成し、非常に閉じるまでそれに付随します。 完全な説明とデモバージョン ここ。 ユーティリティの主な機能と機能 ユーティリティは、モバイル端末から開かれた注文を含め、あらゆる方法で開かれた注文を処理します。 「制限」と「停止」の2種類のグリッドで機能します。 グリッド間隔の計算には、固定と動的(ATRインジケーターに基づく)の2つの方法で機能します。 オープンオーダーグリッドの設定を変更できます。 チャート上の各注文グリッドの損益分岐点を表示します。 各注文グリッドの利益率を表示します。 ワンクリックでグリッドから収益性の高い注文を閉じるこ
TradePanel MT4
Alfiya Fazylova
4.84 (89)
Trade Panel は、多機能の取引アシスタントです。このアプリケーションには手動取引用の 50 を超える取引機能が含まれており、ほとんどの取引操作を自動化できます。 注意、アプリケーションはストラテジー テスターでは動作しません。購入する前に、デモアカウントでデモ版をテストできます。デモ版 ここ 。 完全な手順 こちら 。 取引。 ワンクリックで取引操作を実行できます: 自動リスク計算を使用して未決の注文とポジションをオープンします。 ワンクリックで複数の注文とポジションをオープンします。 注文グリッドを開きます。 未決の注文とポジションをグループごとにクローズします。 ポジション反転 (買いを閉じて売りを開く、または売りを閉じて買いを開く)。 ポジションをロックします(買いポジションと売りポジションの量を均等にする追加のポジションをオープンします)。 ワンクリックですべてのポジションを部分的にクローズします。 すべてのポジションのテイクプロフィットとストップロスを同じ価格レベルに設定します。 すべてのポジションのストップロスをポジションの損益分岐点レベルに設定します。 注文とポ
Exp COPYLOT CLIENT for MT4
Vladislav Andruschenko
4.69 (64)
MetaTrader4のコピー機を取引します。     それは任意の口座からの外国為替取引、ポジション、注文をコピーします。 それは最高の貿易コピー機の1つです     MT4 - MT4、MT5 - MT4     のために     COPYLOT MT4     バージョン(または     MT4 - MT5  MT5 - MT5     のために     COPYLOT MT5     バージョン)。 MT5のバージョン 完全な説明   +DEMO +PDF 購入する方法 インストールする方法     ログファイルの取得方法     テストと最適化の方法     Expforex のすべての製品 のコピー機 バージョン       MetaTrader 5 ターミナル(   МТ5 - МТ5、МТ4 - МТ5   )-   コピーロットクライアントMT5 独自のコピーアルゴリズムにより、すべての取引がマスターアカウントからクライアントアカウントに正確にコピーされます。 また、動作速度が速いことでも知られています。タフなエラー処理。 強力な機能セット。 プログラムは、複数
VirtualTradePad mt4 Extra
Vladislav Andruschenko
4.86 (58)
ワンクリックで取引できるトレーディングパネル。ポジションと注文の操作!チャートまたはキーボードから取引。 手動取引用の取引パネル。チャート(チャートウィンドウ)またはキーボードから取引できます。開閉、リバース、ロックポジションと注文を処理する МetaТrader4のメインオーダーのトレーディングコントロールパネル:売買、売却、売却、売却、売却、閉じる、削除、修正、トレーリングストップ、ストップロス、takeproft MT5のバージョン 完全な説明   +DEMO +PDF 購入する方法 インストールする方法     ログファイルの取得方法     テストと最適化の方法     Expforex のすべての製品 シンボルウィンドウからの取引とキーボードからの取引! あなたはMetaTrader 4ターミナル - バーチャルコントロールパネルVirtualTradePadのためのユニークなプラグインを持っています。 Description on English 注意!  ストラテジーテスターの 取引方法を学びたい場合は、無料の TesterPad ユーティリティをチェックしてくだ
コピー機->便利で高速なインターフェースインタラクション、ユーザーはすぐに使用できます     ->>>> WindowsコンピュータまたはVPS Windowsでの使用を推奨 特徴: 多様でパーソナライズされたコピー取引設定:1. 異なるシグナルソースに異なるロットモードを設定できます。2. フォワードコピー取引とリバースコピー取引に異なるシグナルソースを設定できます。3. シグナルはコメントで設定できます。4. 契約ロットに応じてロットを調整するかどうか 多様でパーソナライズされたコピー注文設定2:1.品種ごとに異なるロットモードを設定できます2.順方向コピー注文と逆方向コピー注文に異なる品種を設定できます3.コメントでシグナルを設定できます4.契約ロットに応じてロットを調整するかどうか コメントフィルタリング、MAGICフィルタリング、シグナルロットフィルタリング、ローカル製品フィルタリング 勤務時間設定 逆同期SLAVE終了 注文バインド機能: 任意の注文を設定されたシグナルソース注文にバインドできます (テーブルをダブルクリックして編集します) アカウントリスク管理 基本
Click and Go Trade Manager, the ultimate solution for seamless trading execution. With a simple click on the chart, you can effortlessly define your stop loss, entry price, and target levels. No more hassle of inputting values manually - it's made incredibly intuitive and easy. Embedded risk management is a key feature of our Trade Manager. We understand the importance of protecting your investments, which is why the Click and Go Trade Manager incorporates risk management. When placing orders,
News Trapper EA
Noha Mohamed Fathy Younes Badr
4.85 (13)
Hi, all.  News trapper EA It is an expert for trading news very safe expert  Automated Trading on the news of the economic calendar. It shows stable trading during last 10  years. EA doesn't use dangerous technologies like martingale, grid. The Expert is very simple to use.      sale will end after 48 h how to install it     and set files     read the blog         after purchase contact me to add you to   VIP   channel  The program contains flexible settings for trading on the news of the econo
DrawDown Limiter MT4
Haidar, Lionel Haj Ali
5 (8)
Drawdown Limiter EA You are in the right place if you were searching for Drawdown control, Drawdown limiter, Balance protection, Equity Protection or Daily Drawdown Limit related to Prop Firm, FTMO, or Funded account trading, or if you want to protect your trading account. Have you suffered from controlling your drawdown when trading funded accounts? This EA is meant for you. Prop firms usually set a rule called “Trader Daily Drawdown”, and if it is not respected, you are disqualified.  I am an
EASY Insight AIO – スマートで手間いらずな取引のオールインワンソリューション 概要 数秒で市場全体——FX、ゴールド、暗号資産、指数、さらには株式まで——を、手作業のチャート確認や複雑なセットアップ・インジケーター導入なしにスキャンできたらどうでしょうか? EASY Insight AIO はAIトレードのための究極のプラグ&プレイ型エクスポートツールです。市場全体のスナップショットを、クリーンなCSVファイルで一括出力。ChatGPT、Claude、Gemini、Perplexityなど、さまざまなAIプラットフォームで即座に解析できます。 ウィンドウの切り替えやグラフのごちゃごちゃしたオーバーレイはもう不要。自動エクスポートされる純粋で構造化されたインサイトだけで、無駄なチャート監視に悩まされず、スマートなデータ主導の判断に集中できます。 なぜEASY Insight AIOなのか? 本当のオールインワン • セットアップ不要、インジケーターのインストール不要、チャートへのオーバーレイ不要。インストールして起動し、エクスポートするだけです。 マルチアセット対
Everything for chart Technical Analysis indicator MT4 in one tool Draw your supply demand zone with rectangle and support resistance with trendline and get alerts to mobile phone or email alert -  Risk reward indicator Video tutorials, manuals, DEMO download   here .  Find contacts on my   profile . 1.   Extended rectangles and trendlines Object will be extended to the right edge of the chart when price will draw new candles on chart. This is rectangle extender or trendline extender. 2. Price to
Zone Guardian is an advanced Expert Advisor (EA) designed to automate trade management. This EA manages trades within specified risk parameters using automatic lot calculation and multi-layered trade activation. It supports up to 5 layers within the entry zone, each with customizable risk percentages. Visual aids on the chart display entry zones, stop loss (SL), and take profits (TP), ensuring easy level adjustments. The EA adapts to market conditions by closing trades at each TP and moving SLs
Trade Manager は、リスクを自動的に計算しながら、取引を迅速に開始および終了するのに役立ちます。 過剰取引、復讐取引、感情的な取引を防止する機能が含まれています。 取引は自動的に管理され、アカウントのパフォーマンス指標はグラフで視覚化できます。 これらの機能により、このパネルはすべてのマニュアル トレーダーにとって理想的なものとなり、MetaTrader 4 プラットフォームの強化に役立ちます。多言語サポート。 MT5バージョン  |  ユーザーガイド + デモ Trade Manager はストラテジー テスターでは機能しません。 デモについてはユーザーガイドをご覧ください。 危機管理 % または $ に基づくリスクの自動調整 固定ロットサイズを使用するか、ボリュームとピップに基づいた自動ロットサイズ計算を使用するオプション RR、Pips、または価格を使用した損益分岐点ストップロス設定 トレーリングストップロス設定 目標に達したときにすべての取引を自動的に終了するための 1 日あたりの最大損失 (%)。 過度のドローダウンからアカウントを保護し、オーバートレードを防ぎま
RSI Divergence Scanner is a multi-timeframe and multi-symbol dashboard and alert that checks all timeframes and symbols to find divergences between price chart and RSI indicator. This divergence scanner is integrated with support and resistance zones so you can check the RSI divergences in the most important areas of the chart to find trend reversals in the price chart. Download demo version   (works on M 1,M5,M30,W1 timeframes) Full description of scanner parameters ->   click here . How to get
Titan Machinist - Your Professional Management System for MetaTrader                                                                                                                                 Transform Your Trading with Automated Position Management Tired of having to manually manage every single trade? Titan Machinist is the ultimate solution to automate your trade management, allowing you to trade like a true professional. Suitable for any trading technique: one
Comprehensive on chart trade panel with the unique ability to be controllable from mobile as well. Plus has a library of downloadable configuration, e.g. exit rules, extra panel buttons, pending order setup and more. Please see our product video. Works with all symbols not just currency pairs. Features On chart panel plus controllable from free app for Windows, iPhone and Android Built-in script engine with library of downloadable configuration, e.g. add 'Close All Trades in Profit' button, exit
リスクリワード比率管理ツールは、直感的なパネルで効率的かつ情報に基づいた意思決定を可能にする、包括的な取引ビジュアル注文ツールとポジションサイズ(ロット)計算ツールです。通貨ペア、指数、貴金属、コモディティ、暗号通貨など、様々な銘柄に対応し、シームレスに機能します。 リスク対報酬比率管理ツールは、視覚的なツール、自動計算、カスタマイズ オプションを提供することで取引プロセスを合理化し、効果的なリスク管理と戦略的意思決定のための包括的なソリューションをトレーダーに提供します。 リスク対報酬比率マネージャー   インストールと入力ガイド EAに関する通知を受け取りたい場合はURLを追加してください(       http://www.betasoft.dev   ) MT4/MT5 ターミナル (スクリーンショットを参照)。 MT4バージョン https://www.mql5.com/en/market/product/110797 MT5バージョン https://www.mql5.com/en/market/product/110798 主な特徴: 直感的なパネル:     このツー
AIP – MT4/MT5 To Telegram 1         Main features of MT4/MT5 EA To Telegram: Send all types of orders (Open Order/Close Order/Partial Close/Modify Order/Pending Order/Delete Order) Close and Modify Order with replies to the corresponding Open Order   Support sending to both private and public channels Support sending to multiple channels simultaneously Send Chart Screenshots Manage all symbols with a single EA on one terminal Automatic loading of templates, logos, and screenshots Support sending
あなたがメンバーである任意のチャンネル(プライベートおよび制限されたチャンネルを含む)からのシグナルを、直接あなたのMT4にコピーします。 このツールは、ユーザーを念頭に置いて設計されており、取引を管理および監視するために必要な多くの機能を提供しています。 この製品は、使いやすく視覚的に魅力的なグラフィカルインターフェースで提供されています。設定をカスタマイズして、数分で製品を使用開始できます! ユーザーガイド + デモ  | MT5版 | Discord版 デモを試したい場合は、ユーザーガイドを参照してください。 Telegram To MT5レシーバーは、ストラテジーテスターでは機能しません! Telegram To MT4の特長 一度に複数のチャンネルからシグナルをコピー プライベートおよび制限されたチャンネルからシグナルをコピー BotトークンやチャットIDは不要です(必要な場合は引き続き使用できます) リスク%または固定ロットを使用して取引 特定のシンボルを除外 すべてのシグナルをコピーするか、コピーするシグナルをカスタマイズするかを選択 すべてのシグナルを認識するため
Easy Trade – シンプルかつ強力なスマートトレード管理 Easy Trade は、リスクを適切にコントロールし、スムーズな取引執行を実現したい MetaTrader ユーザーのためのオールインワン・トレードマネジメントソリューションです。 トレーダーの声をもとにゼロから設計された Easy Trade は、複数シンボルの取引を簡単に実行・監視・管理できるようにし、作業フローを複雑にしません。 手動スキャルピングでも、少数のセットアップを管理するポートフォリオでも、Easy Trade は賢明な判断と安定した成果に集中できるようサポートします。 ⸻ なぜ Easy Trade を使うべきか? 精密なリスク管理:固定ロットサイズまたはパーセンテージによるリスク設定が可能。リアルタイムでリスクとリワード情報を確認。 バスケット型トレーリング:複数の取引の利益を監視。目標到達で部分利益を自動確保。 取引の自動記録:各取引をスクリーンショットで記録。ジャーナル記録やパフォーマンス分析に最適。 時限クローズ機能:指定日時での自動クローズ設定が可能。週末前や取引終了時に便利。 カス
Custom Alerts AIO:マルチマーケット監視を一括で実現 — 設定不要ですぐに使えるインテリジェントツール 概要 Custom Alerts AIO は、追加のインジケーター設定が不要で、インストール後すぐに利用できる高機能マーケットスキャナーです。FX Power、FX Volume、FX Dynamic、FX Levels、IX Power を内部にすべて統合し、主要なすべての資産クラス(為替、金属、指数、暗号資産)を一括監視できます。MetaTrader の仕様により、株式は個別のシンボルとして追加可能ですが、一般的には利用頻度は低めです。 1. なぜ Custom Alerts AIO を選ぶべきか 追加ライセンス不要 • 必要なすべての Stein Investments インジケーターが内蔵されており、すぐに使用可能です。 • チャートに表示されるグラフィックは省略されており、アラート生成に特化した構成です。 市場を広範囲にカバー • 為替、金属、暗号資産、株価指数に対応(株式は手動追加可能)。 • シンボル名を入力する必要はなく、プロパティで資産クラス
This EA Utility allows you to manage (with advanced filtering) unlimited open orders (manual or EA) with 16 trailing stop methods: fixed, percent, ATR Exit, Chandelier Exit, Moving Average, Candle High Low Exit, Bollinger Bands, Parabolic, Envelope, Fractal, Ichimoku Kijun-Sen, Alligator, Exit After X Minutes or Bars, RSI and Stochastic. The trailing stop can be either real or virtual, and you can exit fully or with a partial close percent on touch or bar close.  Moreover, you can add (overrid
この製品は、ニュースタイム中にすべてのエキスパートアドバイザーと手動チャートをフィルタリングするため、急激な価格変動によるマニュアルトレードのセットアップの破壊や他のエキスパートアドバイザーによって入力された取引について心配する必要はありません。この製品には、ニュースのリリース前にオープンポジションとペンディングオーダーを処理できる完全な注文管理システムも付属しています。 The News Filter  を購入すると、将来のエキスパートアドバイザーのためにビルトインのニュースフィルターに頼る必要はなく、今後はすべてのエキスパートアドバイザーをここからフィルタリングできます。 ニュース選択 ニュースソースは、Forex Factoryの経済カレンダーから取得されます。 USD、EUR、GBP、JPY、AUD、CAD、CHF、NZD、CNYなど、任意の通貨数に基づいて選択できます。 Non-Farm(NFP)、FOMC、CPIなどのキーワード識別に基づいて選択することもできます。 影響レベルによってフィルタリングするニュースを選択することができ、低、中、高の影響範囲から選択できます。
MACD Divergence Scanner is a multi-timeframe and multi-symbol dashboard and alert that checks all timeframes and symbols to find regular and hidden divergences between price chart and MACD indicator. This divergence scanner is integrated with support and resistance zones so you can check the MACD divergences in the most important areas of the chart to find trend reversals in the price chart. Download demo version   (works on M 1,M5,M30,W1   timeframes) Full description of scanner parameters ->  
作者のその他のプロダクト
The utility copies trades from the signal provider accounts (master accounts, one or multiple providers) to unlimited number of receiver accounts (slave accounts).  Attention! Y ou need to use identifiers (Provider number) of the same length if you use several master copiers. For example. 1, 2, 3 or 11, 13, 22. The copying can be set in the opposite direction. The comments with all the recently performed actions are displayed on the screen to monitor the utility actions in slave mode. To avoid p
The Expert Advisor receives signals from an artificial neural network that uses the RSI indicator. Trades are closed by the opposite signals. Presence of a signal is checked at the closing of the bar. The EA also has the following functions: changing a position volume in proportion to the change in balance (function for the tester); transfer of unprofitable trades into breakeven; Parameters Start with lot - initial position volume increased in proportion to the balance change; Lotsize by balanc
FREE
The utility copies trades from the signal provider accounts (master accounts, one or multiple providers) to unlimited number of receiver accounts (slave accounts). The provider is defined by the 'provider' parameter (any combination of numbers and letters). For example, there are two providers. Run the utility in master mode on them, and set different values to the provider parameter. On the account designated for copying these signals, run two utilities in slave mode in different windows, setti
The indicator displays the trading statistics of the analyzed Market signal on the chart. Signal transaction data is presented in an excel (csv) file and can be taken from the Signal>Trading history ( Export to CSV:  History ). The copied file must be saved to the directory MT4>File>Open Data Folder>MQL4>Files.  Available color management and font output.  If the currency names are different on the Signal and User accounts, use the Prefix and Suffix parameters. Utility options Prefix at Signal -
FREE
The indicator reads the current spread and displays it on the chart. The maximum value, the minimum value, the value at the time of opening the bar and the maximum value divided by 10 are displayed separately.  The indicator does not remember these values so the data will be lost if there is a change in the timeframe. The indicator is useful for analyzing market volatility, comparing the spread between brokers and different types of accounts. By default: Red line - maximum spread; Green bar -
FREE
The indicator analyzes the change in the minimum and maximum prices of the previous bars fixing the entrance of the big players. If the change (delta) increases, a signal is displayed on the graph in the form of an arrow. At the same time, virtual trade on history is carried out. In the free version, virtual trade is performed without refills in case of a repeat of the signal. The results of virtual trading in the form of losses / losses, profitability, drawdown and transaction lines are display
FREE
The indicator displays on a chart trading results. You can configure the color and font of displayed results, as well as filter trades based on the magic number. If multiple trades were closed within one bar of the current timeframe, the result is summed and output in one value. Utility parameters Plot profit in - the format of output results: wither in deposit currency taking onto account commission and swap, or in points. Start from - start processing data at the specified time. Plot last dea
FREE
The utility searches the price history looking for the pattern similar to the one within a specified interval. The length of a pattern and a specified interval is the same and set in bars. Similarity is estimated by comparing the bars' body colors, size and shadows. The subsequent price movement is displayed as lines for all detected patterns. The color of the lines defines the degree of similarity. The movement length is set as a number of bars. Search for patterns and visualization are perform
FREE
This EA trades support/resistance levels which were placed by a trader (Trend Line from toolbar). The direction of a trade is set graphically by arrows: ↑ - buy; ↓ - sell; - buy or sell in case of crossing support/resistance level. The level is off if inconsistent directions were set, like: ↑↓, ↑, or ↓. If the price is lower than a level it is a resistance level. And opposite is true for support level. There are a few methods available for levels defining, for testing with visualization as
The Expert Advisor trades the signals from an artificial neural network. Network with one hidden layer. Presence of a signal is checked at the closing of the specified period, which significantly increases the optimization and testing speed. It differs from the previous version by a number of additional features: works with pending orders; subsequent trades are opened with a lot increased by the specified step; moves the trade to breakeven a specified time after it was opened; closes trades at t
The Expert Advisor trades the signals from an artificial neural network with one hidden layer. Presence of a signal is checked at the closing of the specified period. MAIN PARAMETERS Net option - setting the order grid. When placing a market (not pending, Pending order offset=0 ) order according to a signal, the grid order is set. The following direction are available: follow the trend , against the treand and both directions . The number of placed orders is taken from the ...maximum deals with
This utility searches the history for price patterns, which are similar to those present in the intervals selected by trader (there are several intervals, see the screenshot). The length of the pattern and selected intervals is the same and is given by the number of bars. The similarity is estimated by comparing the colors of bar bodies, sizes of bars' bodies and wicks. For all identified patterns, further movement of the price is visualized as lines. The color of lines determines the degree of
The Expert Advisor opens a trade in the direction of the previous price movement or in the opposite direction (selectable). The previous direction is determined based on the chosen time interval. The interval can be set to trading session hours and thus to check the theory that the price is inactive after session close. Multiple trades can be open at a time depending on input parameters. The Expert Advisor trails the stop loss order, and is provided with multiple breakeven and trade closing func
The Expert Advisor opens a trade in the specified direction at the specified time. If the price moves in the profit direction, additional trades are opened after a preset step. Trade are closed by a Stop Loss or upon reaching a target profit. The Expert Advisor trails the stop loss order, and is provided with multiple breakeven and trade closing functions (See the description of the parameters). Test and optimize the EA in the Tester using M1 open prices. The EA parameters can be controlled via
The indicator calculates the number of times the price crossed the levels and bounced off the levels in history. The levels are defined by horizontal lines (Horizontal lines element from the Toolbar). In the free version, the levels are set manually. To calculate the number of crosses and rebounds, the indicator uses the specified tolerance to touching a level. This tolerance is sensitive to the timeframe of the bars. For example: for M5 use a tolerance about 10 pips, for М30 - 30 pips, for D1 -
The indicator analyzes the change in the minimum and maximum prices of the previous bars fixing the entrance of the big players. If the change (delta) increases, a signal is displayed on the graph in the form of an arrow. At the same time, virtual trade on history is carried out. In case of a repeat of the signal, the positions are increased (refilling). Thus the lot of positions can differ. The results of virtual trading in the form of losses / losses, profitability, drawdown and transaction li
The cut release of Top Signals Strategy EA for less price. With default parameters EA works in Assian session and scalps market. EA opens trades by RSI indicator signals in a specified time interval. In the case of a repetition of the signal opens a unidirectional transaction. The number of transactions per day can be limited. Revolves trades on the opposite signal. Displays information on trade and its results. Also you can set virtual stop loss and take profit. Telegram channel for discation p
The cross-correlation indicator calculates the relationship between the specified pairs for the previous period. Automatically selects the instruments with the highest and the lowest correlation, and then simulates trading on the selected pairs on the same test period. Then indicator displays the pairs that have shown the best trading results. Visualizes the PAC (Pairs Arbitrage Correlation) criterion for the pairs selected by the trader. The signal to open trades is set by the PAC levels. When
EA trades pairs selected by correlation criterion. The choice is made in such a way that there are pairs with negative and neutral correlation to the main pair. The PAC indicator is used to automate the selection of pairs  https://www.mql5.com/en/market/product/41985 Expert is multycurrency, thus it is no use to test it in the MT4 terminal. So, watch for real signal and joing to telegram channel. After setting the pairs, the expert Advisor simulates trading for the previous period with visualiz
Simplified release of PACman EA. Expert is multycurrency, thus it is no use to test it in the MT4 terminal. So, watch for real signal and joing to telegram channel. After setting the pairs, the expert Advisor simulates trading for the previous period with visualization of the results. The user can interactively change the signal levels and observe their impact on the simulation result. In this way, you can select the optimal level values. By manually moving the vertical boundary lines to the ri
Simple and fast trade duplicator that copies trades on the same account with the reverse function. The reverse can be used for locking. You can choose to duplicate transactions for the current or all instruments.  Parameters Duplicate in reverse - the direction of duplication; Duplicate symbol - duplicate the selected tool; Manual lot size - hand size of the volume; Do not duplicate if spread > - do not duplicate a trade if the current spread is larger; List of magic to be duplicated - filte
Indicator shows the price history. The history is read for vertical lines and output for the main line. Those lines are the time cursors. You can use the indicator to analyze the price cycle over time, thereby predicting its movement. The duration of the forecast and the number of time cursors can be set in the indicator parameters. Additionally, you can link the main line to a new bar. Lines can be moved manually. Analyze the cyclical nature of the market using this indicator. Indicator para
This expert Advisor uses the saved trading history to repeat trades in the strategy tester. Meanwhile you can set other values for take profit, stop loss, and closing time. Thus, you can check how the results of trading with other parameters would look like. The best set of parameters can be obtained using the strategy optimizer in the MT4 terminal. In addition, you can find out how the results of trading would be affected by the later opening of trades when the price went to the loss side. You
フィルタ:
レビューなし
レビューに返信