Time Cursors

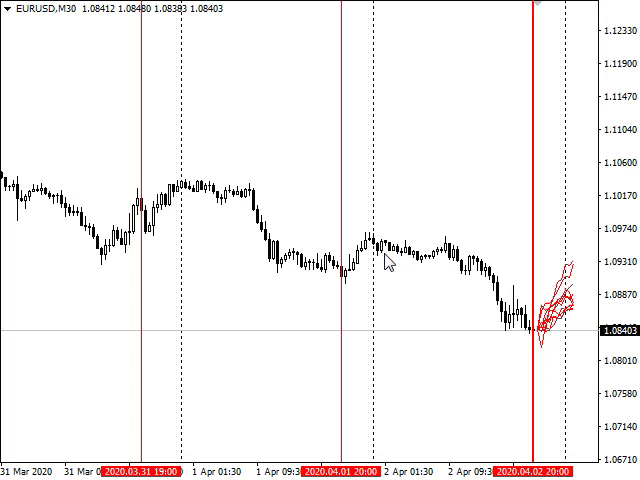
Indicator shows the price history. The history is read for vertical lines and output for the main line. Those lines are the time cursors. You can use the indicator to analyze the price cycle over time, thereby predicting its movement. The duration of the forecast and the number of time cursors can be set in the indicator parameters. Additionally, you can link the main line to a new bar. Lines can be moved manually.

Analyze the cyclical nature of the market using this indicator.

Indicator parameters

  • Stick first line to new bar - link the main line to the new bar;
  • Vertical lines amount - number of temporary cursors;
  • History bars for each line - the number of bars to read the price history for each time cursor;
  • Lines color - the color of the lines.
おすすめのプロダクト
The indicator allows you to trade binary options. The recommended time frame is М1 and the expiration time is 1,2,3 minutes. The indicator suitable for auto and manual trading. A possible signal is specified as a arrows above/under a candle. You should wait until the candle closes! Arrows are not re-painted Trade sessions: TOKYO section (Half-end) Currency pairs: USD/JPY Working time frame: M1 Expiration time: 1,2,3 minutes. The indicator also shows good results when using the martingale strateg
FREE
Quantum Falcon Signal Free is a smart visual trading indicator for MetaTrader 4 designed for Forex and Gold traders. The indicator combines: • Trend analysis • RSI momentum confirmation • MACD momentum filtering • ATR volatility filtering • Higher timeframe confirmation • Smart exit signal detection Main Features: • Smart Buy and Sell signals • Exit Buy / Exit Sell alerts • Real-time dashboard on chart • Professional candle arrows • Multi-timeframe trend confirmation • ATR market volatility filt
FREE
The Trend Trade indicator displays assumed turning points of the price on the chart in the direction of the trend after correction. It is based on data of the Prise Reversal oscillator with the period 6 and indicators which characterize strength and availability of the trend. When the value of Prise Reversal is in overbought or oversold area (area size is set by a user), and the current trend is confirmed, the Trend Trade indicator draws an arrow pointed to the further assumed price movement. I
WPR by Profile, or WPR for Professionals Geo_WprPro is one of the well-known currency profile indicators. It simultaneously displays two WPR indicators with different parameters in the matrix form on all timeframes of multiple currency pairs forming the currency profile . As follows from the description, " WPR is a leading indicator that often goes ahead of the price chart. The oscillator frequently reaches extreme values before the price reversal as if anticipating that event: it almost always
Alpha Trend signは私たちの取引システムを検証し、取引信号を明確に提示し、信号がドリフトすることはありません。 主な機能: •市場が活況を示している地域に応じて、指標に基づいて現在の相場がトレンド相場に属しているか、それとも揺れ相場に属しているかを直感的に判断することができる。 そして、指標の指示矢印に基づいて市場に切り込み、緑の矢印は購入を提示し、赤の矢印は販売を提示する。 •小周期変動による頻繁な取引信号の発生を回避するために、5分以上の時間周期で取引を行うことを推奨します。 •最適な取引タイミングを逃さないために、シグナルプロンプトをオンにすることもできます。 •本指標はトレンド相場をよく予測するだけでなく、幅広振動相場でも利益を得ることができる。 •本指標は大道至簡の原則に基づいており、異なる段階のトレーダーが使用するのに適している。 注意事項: •Alpha Trend signには明確な入退場信号があり、損失を与えないように逆位相操作を提案しない。 •Alpha Trend signは特に成熟した指標であり、デルのチー
Smart FVG インジケーター MT4 – MetaTrader 4 向け高度なフェアバリューギャップ検出 Smart FVG インジケーター MT4 は、MetaTrader 4 上で Fair Value Gap(FVG)をプロフェッショナルレベルで検出・監視し、アラートまで行うツールです。ATR ベースのフィルタリングと相場構造を考慮したロジックを組み合わせることで、ノイズを取り除き、流動性に応じて適応し、本当に重要な不均衡だけを残して精度の高い判断をサポートします。 主な特長 正確な FVG 検出:単なるローソク足のギャップではなく、市場の本質的な非効率を捉えます。 ATR ベースの精度:市場や時間軸が変わっても、低品質なシグナルを自動的にフィルタリング。 有効性のリアルタイム追跡:価格がゾーンを埋める/ブレイクすると、ゾーンが自動で延長・調整・削除されます。 カスタマイズ可能な表示:色・ラインスタイル・塗りつぶしを自由に設定し、どんなテンプレートにも合わせられます。 実用的なアラート:新規 FVG や、埋められた/無効化されたゾーンをリアルタイム通知。 パフォーマンス
FREE
Spread and Close MT4
Alexander Denisovich Jegorov
Spread & Candle Close Timer Indicator for MT4  Optimize your trading with this lightweight and efficient indicator, designed to display the real-time spread and candle close countdown directly on your MT4 chart. Features: Live Spread Monitoring – Instantly see market conditions. Candle Close Timer – Stay prepared for the next price movement. Simple & Non-Intrusive Design – No unnecessary settings, just clear and accurate data. Ideal for scalpers, day traders, and those who need real-time exec
MACDivergence MTF
Pavel Zamoshnikov
4.29 (7)
Advanced ideas of the popular MACD indicator: It detects and displays classic and reverse divergences (three methods of detecting divergences). It uses different color to highlight an uptrend and a downtrend. Two methods of determining a trend: а) MACD crosses the 0 level (classic signal); б) MACD crosses its own average (early signal). This is a multi-timeframe indicator: it can display MACD data from other timeframes. Two methods of drawing: classic histogram and line. It generates sound and v
「Auto FIBO Pro」Crypto_Forex インジケーターは、取引の補助ツールとして最適です。 - インジケーターは、フィボナッチ レベルとローカル トレンド ライン (赤色) を自動的に計算してチャート上に配置します。 - フィボナッチ レベルは、価格が反転する可能性のある重要な領域を示します。 - 最も重要なレベルは、23.6%、38.2%、50%、61.8% です。 - リバーサル スキャルピングやゾーン グリッド取引に使用できます。 - Auto FIBO Pro インジケーターを使用して、現在のシステムを改善する機会も多数あります。 - Info Spread Swap Display があり、接続されている外国為替ペアの現在のスプレッドとスワップを表示します。 - ディスプレイには、アカウントの残高、エクイティ、マージンも表示されます。 - Info Spread Swap Display は、チャートのどのコーナーにも配置できます。 0 - 左上コーナー、1 - 右上、2 - 左下、3 - 右下。 高品質のトレーディングロボットとインジケーターをご覧にな
Price Magnet — Price Density and Attraction Levels Indicator Price Magnet is a professional analytical tool designed to identify key support and resistance levels based on statistical Price Density. The indicator analyzes a specified historical period and detects price levels where the market spent the most time. These zones act as “magnets,” attracting price action or forming a structural base for potential reversals. Unlike traditional Volume Profile tools, Price Magnet focuses on price-time d
The indicator shows the potential trend direction by cyclical-wave dependence. Thus, all the rays of the intersection will be optimal rays, in the direction of which the price is expected to move, taking into account the indicator period. Rays can be used as a direction for potential market movement. But we must not forget that the approach must be comprehensive, the indicator signals require additional information to enter the market.
How TrendMaster Works TrendMaster is a trading indicator designed to streamline and enhance your chart analysis. Using algorithmic logic, it reviews historical price data to generate a dynamic reference line. When price action crosses this line, a "BUY" or "SELL" signal is displayed on your chart. The goal is to assist in identifying potential shifts in price behavior with a clear and user-friendly visual approach. Why Use TrendMaster? The TrendMaster MT4 Indicator helps highlight potential tre
このプロジェクトが好きなら、5つ星レビューを残してください。 このインジケータは、指定されたためのオープン、ハイ、ロー、クローズ価格を描画します 特定のタイムゾーンの期間と調整が可能です。 これらは、多くの機関や専門家によって見られた重要なレベルです トレーダーは、彼らがより多くのかもしれない場所を知るために有用であり、 アクティブ。 利用可能な期間は次のとおりです。 前の日。 前週。 前の月。 前の四半期。 前年。 または: 現在の日。 現在の週。 現在の月。 現在の四半期。 現年。
FREE
Your Good Friends — this is not just an indicator, but your reliable trading assistant, designed for traders who value simplicity, clarity, and stability. It combines the best classic methods of technical analysis — support and resistance levels, reversal signals, visual cues — and presents them in the clearest, most user-friendly format possible. Suitable for both beginners and experienced traders — especially those who want to eliminate chaos, reduce stress, and trade based on clear signals.
SX Supply Demand Zones accurately identifies and draws high-probability Supply and Demand zones using a sophisticated algorithm. Unlike traditional indicators that clutter your chart, this indicator is designed with a focus on performance and a clean user experience. New Unique Feature: Interactive Legend System What truly sets this indicator apart from everything else is the Interactive Control Legend. You have a professional dashboard directly on your chart that allows you to: Show/Hide: Ins
FREE
This indicator is based on the Bollinger Bands on one or more timeframes and on any Currency Cross Pair. The indicator generates an alert message when it detects a buy or sell signal. It also draws a vertical bar on the price chart: green for buy or red for sell, white if flat. Alert messages and Vertical bars for BUY or SELL, are generated when the Bollinger Bands is consistent for all chosen timeframes else a FLAT signal is generated. In addition, the Multi TimeFrames Bollinger Bands Signals i
Smart Money Trap Detector は、スイングハイとスイングローにおける流動性トラップを識別します。価格がキーレベルを超えて反転した際に、機関投資家が仕掛けたブルトラップまたはベアトラップの可能性をシグナルとして検出します。各トラップはヒゲのサイズ、反転速度、出来高に基づいて1〜5の強度スコアを受け取ります。   動作原理 インジケーターは設定可能なルックバック期間を使用してスイングハイとスイングローを追跡します。価格がスイングハイを上抜けまたはスイングローを下抜けした場合、設定された確認足数以内に価格がレベルを戻って反転するかを監視します。ブレイクアウトのヒゲがATR比率の最小閾値を満たし、価格がレンジ内に戻って引ければ、トラップが確認されます。スコアは3つの要素から計算されます:ATRに対するヒゲのサイズ、反転速度、出来高の急増。すべてのシグナルはリペイントを防ぐために確定済みの閉じたバーに配置されます。   視覚機能 チャート上の矢印が確認されたブルトラップ(上向き矢印)とベアトラップ(下向き矢印)をマーク。流動性ゾーンがスイングポイント周辺に色付き矩形として描
Trade History Drawer is an indicator for MetaTrader 4. It shows trades on the chart and draws them in customized colors. Furthermore, the indicator shows a trade summary and saves a CSV history file for either one selected pair or all pairs. Inputs General Settings Number Trades : Number of trades to be drawn on the chart, if -1 then all trades Magic Number : Only trades with this magic number, if -1 then ignore Line Style : Line Style Line Thickness : Line Thickness Arrow Size : Arrow Size
Pivot Points MT4
KEENBASE SOFTWARE SOLUTIONS
KT Pivot Points は、最新の市場データに基づいて、日足・週足・月足のピボットレベルをチャート上に自動で表示します。ピボットポイントは、特にFX市場において、テクニカル分析で広く利用されている指標の一つです。 特徴 価格がピボットレベルに到達した際にアラートを送信します。  各種類のピボットレベルに対して完全なカスタマイズが可能です。   シンプルな表示で、日足・週足・月足のピボットレベルを一目で確認できます。 最小限のCPUリソースを使用し、高速な計算を実現します。 チャート上の他のインジケーターとも互換性があります。 ピボットポイントとは ピボットポイントは、前の取引日の高値、安値、終値の平均から算出されます。  この計算により、将来のサポートおよびレジスタンスレベルを予測でき、価格がこれらのレベル付近でどのように動くかを判断する手助けとなります。 また、価格がピボットポイントの上にあるときは強気傾向、下にあるときは弱気傾向とされるのが一般的です。 ピボットの計算式 ピボットレベルの計算には、前日、週、または月の高値、安値、終値が使用されます。 P = (H +
Rainbow MT4 is a technical indicator based on Moving average with period 34 and very easy to use. When price crosses above MA and MA changes color to green, it’s a signal to buy. When price crosses below MA and MA changes color to red, it’s a signal to sell. The Expert advisor ( Rainbow EA MT4) based on Rainbow MT4 indicator, as you can see in the short video below is now available here .
FREE
Ska ZigZag BuySell
NKATEKO VUKOSI LEROY MASANGO
Ska ZigZag BuySell indicator determines the overbought and oversold regions within a trend. The indicator determines the overbought region by the candlestick high and the oversold region by the candlestick low. This indicator only gives signals with arrow and audible alerts each and every time when a new candlestick appear. To utilize the full strategy i recommend using "Ska ZigZag BuySell" together with "Ska ZigZag Line". The Ska ZigZag Line indicator is available for free. NOTE: Indicator is h
This is a multi-timeframe version of the popular Hull Moving Average (HMA). The Double HMA MTF Light indicator combines two timeframes on a single chart. The HMA of the higher timeframe defines the trend, and the HMA of the current timeframe defines short-term price movements. The indicator is freely distributed and hasn't audio signals or messages. Its main function is the visualization of price movements. If you need advanced functionality of the HMA multi-timeframe indicator (information ab
FREE
回帰取引を意味する専門的かつ定量的なアプローチを実装する独自の指標。これは、価格が予測可能かつ測定可能な方法で迂回して平均に戻るという事実を利用しており、非定量的な取引戦略を大幅に上回る明確な出入りルールを可能にします。 [ Installation Guide | Update Guide | Troubleshooting | FAQ | All Products ] 明確な取引シグナル 驚くほど簡単に取引できます カスタマイズ可能な色とサイズ パフォーマンス統計を実装します ほとんどの取引戦略を上回ります 適切なSLおよびTPレベルを表示します 電子メール/音声/視覚アラートを実装します 使い方 インディケータは、より高い時間枠からの完全にカスタマイズ可能な移動平均の周りの標準偏差を測定し、トレンドフォローアプローチを使用して正確に取引を見つけます。取引は、現在のチャートの価格アクションに飛び込むことによって見つけられ、価格が選択したより高い時間枠から計算された平均価格帯に戻ったときに閉じられます。それがコード化される方法のために、指標は高ボラティリティと強いトレンドの市場か
ADX Pointer is an indicator which is based on "Average Directional Index" and draws three numbers in chart window depending on the value of ADX. In ADX Pointer you can set "ADX_Period" which is of course period of Average Directional Index and you can also set 3 levels. When ADX value exceed first level ("ADX_Level1") in chart window appears number "1", when ADX exceed second level ("ADX_Level2") appears "2" and when ADX exceed third level ("ADX_Level3") appears "3". Simple. ADX Pointer works on
Indicateur Crypto_Forex « HTF Moving Averages Cross » pour MT4. - Améliorez vos méthodes de trading avec le puissant indicateur HTF Moving Averages Cross pour MT4. HTF signifie « période de temps supérieure ». - Cet indicateur est idéal pour les traders de tendance avec des entrées d'action de prix. - Il vous permet d'associer des moyennes mobiles rapides et lentes d'une période de temps supérieure à votre graphique actuel - une méthode professionnelle. - HTF Moving Averages Cross intègre des
R747 BreakLevels is smart indicator that automatically detects Support and Resistance levels on actual market trend. Strength of levels can be easily adjusted by changing parameter LevelsStrength in range of 2 (weak levels) and 50 (strong levels). This indicator is accessible in EA via iCustom functions and is fully customizable by user. There is possibility to send Push notifications and Alerts of newly found levels. Follow this link to get all detailed information:  >> LINK << Features Adjusta
ROC acceleration-deceleration is the manual system for medium-term scalping. Indicator based on custom ROC system which defines bullish/bearish market and especially  acceleration-deceleration of tendention in the market's main direction. Buy arrow is plotted during bearish market when current trend decelerates and sell  arrow is plotted during bullish market when current trend decelerates. Main Indicator's Features Signals are not repaint,non-late or disappear(exept cases when system recalculat
初心者またはプロフェッショナルである当社のベストセラーのマルチタイムフレームPivotProfは、スペシャリストが使用するサポート層とレジスタンス層を使用して、売買を美化し、一流の変更の可能性を提供します。ピボットの売買は、主要な範囲で市場に出入りするための簡単で優れた手法であり、当局によって長い間使用されており、外国為替、暗号、株式、インデックスなどのすべてのシンボルで機能します。ピボット教授がトップをもたらします市場が反応する可能性が最も高い場所であるディーラーへのレートティア。これは、ディーラーが市場に出入りし、大規模な最終損失やドローダウンを回避することを望んでいるまさにその要素です。 17の特定の時間枠全体から、シンボルごとに120度以上のデータを計算し、同時に表示する、他に類を見ないアルゴリズムを備えた豊富な機能。すべてがユニークで整頓された使いやすい形式で表示され、端末、電子メール、携帯電話のスマートフォンアラートが付属しています。さらに、全体がカスタマイズ可能です...数式、表示、信号など。 売買スタイルは数えられません。PivotProfを使用して、これらの重要
WAD Stoch
Yonny Pascal Ekwa Mezui
WAD Divergence + Stochastic Overview WAD Divergence + Stochastic is a technical indicator designed to assist traders in identifying potential market turning points. It combines price behavior with momentum confirmation to highlight areas where buying or selling pressure may be shifting. The indicator works directly on the chart and provides clear visual signals to support decision-making in fast-moving markets. How It Works The indicator analyzes the relationship between price movement and inte
FREE
Take Your Trading Experience To the   Next Level ! and get the Magic Bollinger Bands Diamond Indicator MagicBB Diamond Indicator is MT4 Indicator which can suggest signals for you while on MT4. The indicator is created with Non Lag Bollinger Bands strategy for the best entries. This is a system to target 10 to 20 pips per trade. The indicator will give alerts on the pair where signal was originated including timeframe. If signal sent, you then enter your trade and set the recommended pips target
このプロダクトを購入した人は以下も購入しています
Genesis Matrix Pro is a professional multi-timeframe trend detection indicator designed to help traders identify high-quality market alignment with clarity and structure. It combines 12 different technical indicators into one visual alignment matrix, allowing traders to quickly see when market conditions are bullish, bearish, or neutral. A signal is generated only when the selected strategies are aligned, helping reduce noise and improve decision-making. PLEASE CONTACT ME AFTER PURCHASE TO GET
Gann Made Easy は、ミスター・ギャンの理論を使用した取引の最良の原則に基づいた、プロフェッショナルで使いやすい外国為替取引システムです。 W・D・ガン。このインジケーターは、ストップロスとテイクプロフィットレベルを含む正確な買いと売りのシグナルを提供します。 PUSH通知を利用して外出先でも取引可能です。 ご購入後、取引方法の説明と優れた追加インジケーターを無料で入手するには、私にご連絡ください! おそらく、ギャンの取引手法についてはすでに何度も聞いたことがあるでしょう。通常、ギャンの理論は初心者のトレーダーだけでなく、すでにある程度の取引経験がある人にとっても非常に複雑なものです。なぜなら、ギャンの取引手法は理論的にはそれほど簡単に適用できるものではないからです。私はその知識を磨き、最良の原則を私の外国為替インジケーターに組み込むために数年を費やしました。 このインジケーターは非常に簡単に適用できます。必要なのは、それをチャートに添付し、簡単な取引推奨事項に従うだけです。このインジケーターは常に市場分析の仕事を行い、取引の機会を探します。適切なエントリーポイントを検出す
The Propfolio Master Suite is the ultimate all-in-one analytical workstation for professional traders. Combining the power of the Beat The Market Maker (BTMM) methodology, Smart Money Concepts (SND/Liquidity), and Advanced Volume Profile, this suite replaces multiple different indicators with one optimized engine. Monitor up to 14 pairs simultaneously from a single chart, instantly identify market cycles, and seamlessly map institutional footprints with the click of a button. The Command Center
Scalper Inside PRO Scalper Inside PRO は、MetaTrader 4 向けの短期トレンドおよびスキャルピング用インジケーターです。独自アルゴリズムを用いて、市場の方向性と主要なターゲットレベルを素早く検出します。エントリー、イグジット、複数の利確ターゲットを自動計算し、詳細なパフォーマンス統計を表示することで、さまざまな銘柄やストラテジーがどのように機能してきたかを確認できます。これにより、現在のマーケットコンディションに最も適した取引銘柄を選択するのに役立ちます。さらに、Scalper Inside PRO には、お使いの矢印インジケーターを簡単に接続でき、その統計と過去のパフォーマンスを素早く評価できます。 本インジケーターは、あらゆる銘柄と時間足で動作し(短期トレードには M5 を推奨)、複数の内蔵ストラテジーを備えています。そのため、単体のスキャルピングツールとしても、トレーディングシステム内の強力な分析コンポーネントとしても活用できます。 主な機能 独自アルゴリズム(Next‑Generation Trend Detection Algor
M1 SNIPER は使いやすいトレーディングインジケーターシステムです。M1時間足向けに設計された矢印インジケーターです。M1時間足でのスキャルピングのためのスタンドアロンシステムとして、また既存のトレーディングシステムの一部としても使用できます。このトレーディングシステムはM1時間足での取引に特化して設計されていますが、他の時間足でも使用できます。元々、この手法はXAUUSDとBTCUSDの取引用に設計しましたが、他の市場においても役立つと考えています。 インジケーターのシグナルは、トレンドの方向と逆方向に取引できます。インジケーターのシグナルを利用して両方向に取引するのに役立つ特別な取引テクニックをご紹介します。この手法は、特別な動的なサポートとレジスタンスの価格帯を利用することに基づいています。 ご購入後、M1 SNIPER矢印インジケーターをすぐにダウンロードできます。さらに、M1 SNIPERツールのすべてのユーザーに、以下のスクリーンショットに表示されているApollo Dynamic SRインジケーターを無料で提供しています。この2つのインジケーターを組み合わせることで
PRO Renko Systemは、特別にRENKOチャートを取引するために設計された高精度の取引システムです。 これは、様々な取引商品に適用することができる普遍的なシステムです。 システムは効果的に正確な逆転信号へのアクセスを与えるいわゆる市場の騒音を中和する。 表示器は非常に使いやすく、信号の生成に責任がある1つの変数だけがあります。 あなたは簡単にお好みの任意の取引ツールとレンコバーのサイズにツールを適応させることができます。 私はいつもあなたが私のソフトウェアで収益性の高い取引を支援するために余分なサポートを提供する準備ができています! 私はあなたに幸せで収益性の高い取引をしたいです! ご購入後にご連絡ください! 私はあなたに私のレンコチャートジェネレータを送信します。 私はまた、私の個人的な推奨事項やシステムの他のモジュールを無料で共有します!
Auto Optimized Parabolic RSI: 高度な3Dモメンタムエンジン ほとんどのリテール向けインジケーターは、市場のボラティリティが変化した瞬間に破綻する静的な入力値に依存しているため、失敗に終わります。Auto Optimized Parabolic RSIは、自らの数学的優位性を継続的に再計算することで「インジケーターの陳腐化」問題を解決し、機関投資家レベルの定量的適応力をMT5ターミナルに直接もたらします。 最大の強み: カスタムインメモリ3D最適化   標準的な自動最適化ツールは、インジケーターの呼び出しで端末に過負荷をかけるため、頻繁にMT5プラットフォームをフリーズさせます。本ツールは、このボトルネックを完全に回避しています。RAMベースのカスタムネイティブ計算機を内蔵した内部エンジンは、チャートを読み込んだりタイムフレームを変更したりするたびに、超高速の3Dグリッド探索を実行します。RSI期間(頻度)、SARステップ(加速度)、SAR最大値(制限速度)を同時にスイープし、プラットフォームを遅延させることなく、数万通りものパラメーターの組み合わせを絶対的
NAM Order Blocks
NAM TECH GROUP, CORP.
3.67 (3)
MT4マルチタイムフレームオーダーブロック検出インジケーター。 特徴 -チャートコントロールパネルで完全にカスタマイズ可能で、完全な相互作用を提供します。 -必要な場所でコントロールパネルを表示および非表示にします。 -複数の時間枠でOBを検出します。 -表示するOBの数量を選択します。 -さまざまなOBユーザーインターフェイス。 -OBのさまざまなフィルター。 -OB近接アラート。 -ADRの高線と低線。 -通知サービス(画面アラート|プッシュ通知)。 概要 注文ブロックは、金融機関や銀行からの注文収集を示す市場行動です。著名な金融機関と中央銀行が外国為替市場を牽引しています。したがって、トレーダーは市場で何をしているのかを知る必要があります。市場が注文ブロックを構築するとき、それは投資決定のほとんどが行われる範囲のように動きます。 注文の構築が完了すると、市場は上向きと下向きの両方に向かって急激に動きます。注文ブロック取引戦略の重要な用語は、機関投資家が行っていることを含むことです。それらは主要な価格ドライバーであるため、機関投資家の取引を含むあらゆる戦
LHおよびHLブレイクアウトを見つけるための純粋な価格アクションによって行われる高度な計算。 それはあなたに市場で素晴らしい逆転ポイントを与えるでしょう。LHとHL信号は同様にトレイングルブレイクアウトに使用することができます。 ブレイクアウトが発生すると、強い反転を示します。移動平均の優れたフィルターです。トレンドインジケーターと一緒に使用することを強くお勧めします。 サポートとレジスタンス、供給需要指標の追加確認として使用できます。 詳細については、次の外国為替スレッドをご覧ください。 インジケーターは再描画されていません。 Buffers :   SetIndexBuffer ( 0 ,UpBar);      SetIndexBuffer ( 1 ,UpBar2);           SetIndexBuffer ( 2 ,DnBar);      SetIndexBuffer ( 3 ,DnBar2);           SetIndexBuffer ( 4 ,UpBarTop);      SetIndexBuffer ( 5 ,UpBarLow);     
Dynamic Forex28 Navigator - 次世代の Forex 取引ツール。 現在 49% オフ。 Dynamic Forex28 Navigator は、長年人気のインジケーターを進化させたもので、3 つの機能を 1 つにまとめています。 Advanced Currency Strength28 インジケーター (レビュー 695 件)  + Advanced Currency IMPULSE with ALERT (レビュー 520 件) + CS28 コンボ シグナル (ボーナス)。 インジケーターの詳細 https://www.mql5.com/en/blogs/post/758844 次世代の Strength インジケーターが提供するもの  オリジナルで気に入っていたすべての機能が、新機能と精度の向上によって強化されました。 主な機能: 独自の通貨強度計算式。 すべての時間枠でスムーズかつ正確な強度ライン。 トレンドの特定と正確なエントリーに最適です。 ダイナミックマーケットフィボナッチレベル (マーケットフィボナッチ)。 このインジケーターに固有
これはほぼ間違いなく、MetaTraderプラットフォームで見つけることができる最も完全な調和価格形成自動認識インジケーターです。 19種類のパターンを検出し、フィボナッチプロジェクションをあなたと同じように真剣に受け止め、潜在的逆転ゾーン(PRZ)を表示し、適切なストップロスとテイクプロフィットレベルを見つけます。 [ インストールガイド | 更新ガイド | トラブルシューティング | よくある質問 | すべての製品 ] 19の異なる調和価格形成を検出します プライマリ、派生および補完フィボナッチ投影(PRZ)をプロットします 過去の価格行動を評価し、過去のすべてのパターンを表示します この指標は、独自の品質とパフォーマンスを分析します 適切なストップロスとテイクプロフィットのレベルを表示します ブレイクアウトを使用して適切な取引を通知します すべてのパターン比をグラフにプロットします 電子メール/音声/視覚アラートを実装します スコット・M・カーニーの本に着想を得て、この指標は最も純粋で急を要するトレーダーのニーズを満たすように設計されています。ただし、トレードを容易にする
このインジケーターは、反転ポイントと価格戻りゾーンを正確に表示します。     主要プレーヤー 。新たなトレンドが形成される場所を把握し、最大限の精度で意思決定を行い、すべての取引をコントロールします。 TREND LINES PRO インジケーターと組み合わせることで、その潜在能力を最大限に発揮します。 VERSION MT5 インジケーターが示す内容: 新しいトレンドの始まりに活性化する反転構造と反転レベル。 リスクと報酬の比率を最小限に抑えた利益 確定 と 損失停止の レベルの表示     RR 1:2   。 インテリジェントな削減ロジックによるストップロス。 指定されたインジケーターから 2 つのトレンド タイプの反転パターンを表示します。 指標: トレンドを追う   TREND LINES PRO   (世界的なトレンドの変化) TREND PRO   (クイックトレンド変更) シンプルで効果的   スキャナー   リアルタイムトレンド(新機能)。 マルチタイムフレームのインストゥルメント フィルタリング。 画面   利益     LOGIC AI信号の後。 当日プラス方
トレンドキャッチャーインジケーター トレンドキャッチャーインジケーターは、開発者独自の適応型トレンド分析指標を組み合わせることで、市場価格の動きを分析します。短期的なノイズを除去し、根底にあるモメンタムの強さ、ボラティリティの拡大、価格構造の挙動に焦点を当てることで、真の市場方向性を特定します。また、移動平均線、RSI、ボラティリティフィルターなどの平滑化およびトレンドフィルタリング機能を備えたカスタマイズ指標も使用します。 実際の運用状況のモニタリングやその他の製品については、こちらをご覧ください: https://www.mql5.com/en/users/mechanic/seller ご注意ください。私はTelegramでEAや設定を販売していません。詐欺です。すべての設定はブログで無料で公開しています。 重要!ご購入後すぐにご連絡ください。手順とボーナスをお送りします!
Apollo SR Master は、サポート/レジスタンスゾーンを利用した取引をより容易かつ確実にする特別な機能を備えたサポート/レジスタンスインジケーターです。このインジケーターは、ローカル価格の高値と安値を検出することで、タイムラグなしでリアルタイムにサポート/レジスタンスゾーンを計算します。そして、新たに形成されたSRゾーンを確認するために、インジケーターは特別なシグナルを表示します。このシグナルは、SRゾーンを実際の売りまたは買いシグナルとして考慮して使用できることを示します。この場合、SRゾーンの強度が高まり、SRエリアからの取引が成功する確率も高まります。これがこのインジケーターの基本的な考え方です。 SRゾーンは、ストップロスとテイクプロフィットの設定を容易にします。シグナルの方向に応じて、SRゾーンの上または下のスペースをストップロスとして設定できます。さらに、反対側のSRゾーンは、潜在的なテイクプロフィットエリアとして設定できます。 また、Apollo SRマスターインジケーターをご利用のすべてのユーザーには、「Apollo Price Action System」
優れたテクニカルインジケーター「Grabber」をご紹介します。これは、すぐに使える「オールインワン」トレーディング戦略として機能します。 ひとつのコードに、市場のテクニカル分析ツール、取引シグナル(矢印)、アラート機能、プッシュ通知が強力に統合されています。 このインジケーターを購入された方には、以下の特典を無料で提供します: Grabberユーティリティ:オープンポジションを自動で管理するツール ステップバイステップのビデオマニュアル:インジケーターのインストール、設定、取引方法を解説 カスタムセットファイル:インジケーターをすばやく自動設定し、最大限の成果を出すための設定ファイル 他の戦略はもう忘れてください!Grabberだけが、あなたを新たなトレードの高みへと導いてくれるのです。 Grabber戦略の主な特徴: 推奨タイムフレーム:M5〜H4 対応通貨ペア・資産:どれでも使用可能ですが、私が実際に検証した以下を推奨します(GBPUSD、GBPCAD、GBPCHF、AUDCAD、AUDUSD、AUDSGD、AUDCHF、NZDUSD、NZDCAD、EURCAD、EURUSD、E
デイトレーダーマスターは、デイトレーダーのための完全なトレーディングシステムです。システムは2つのインジケーターで構成されています。 1つの指標は売買する矢印信号です。それはあなたが得る矢印インジケーターです。 2つ目のインジケーターを無料で提供します。 2番目のインジケーターは、これらの矢印と組み合わせて使用​​するために特別に設計されたトレンドインジケーターです。 インジケーターは繰り返さず、遅れないでください! このシステムの使用は非常に簡単です。 2色の線で表示されている現在のトレンドの方向に矢印信号をたどる必要があります。青は買いの傾向です。赤い色は売りの傾向です。青い矢印は買いシグナルです。赤い矢印は売りの合図です。トレンドラインの色と一致するように、矢印の色と信号の方向が必要です。 矢印インジケーターは、主に時間間隔M5とM15での日中取引のために作成されました。ただし、技術的には、システムは他の時間間隔で使用できます。 インジケータには、PUSHメッセージ機能を備えたポップアップアラートが装備されています。 購入後、必ず私に書いてください!私はあなたにシステムとの取引の
ゴールドラッシュ・トレンド・アロー・シグナル ゴールドラッシュ・トレンド・アロー・シグナル 指標は、XAU/USDにおける高速・短期スキャルパー向けに最適化された、正確でリアルタイムのトレンド分析を提供します。 1分足専用に設計されたこのツールは、明確なエントリーポイントを示す方向矢印を表示し、スキャルパーが変動の激しい市場状況でも自信を持って取引できるよう支援します。 この指標は、PRIMARY(主要)とSECONDARY(補助)のアラート矢印で構成されています。PRIMARYシグナルは、トレンドの方向転換を示す白と黒の方向矢印であり、SECONDARYシグナルは、PRIMARY矢印が示す方向を確認し、潜在的なエントリーポイントを示す青と赤の矢印です。 注意:トレンド方向の変化後にPRIMARYアラート矢印が1つだけ表示される場合、複数のSECONDARY青/赤矢印が表示される点に注意が必要です。SECONDARYシグナルは、シグナル基準を満たす任意のローソク足後に表示されます。したがって、長期的なトレンド移動の場合、画面に多くのSECONDARY矢印が表示されます(添付の
Introduction to Fractal Pattern Scanner Fractal Indicator refers to the technical indicator that makes use of the fractal geometry found in the financial market. Fractal Pattern Scanner is the advanced Fractal Indicator that brings the latest trading technology after the extensive research and development work in the fractal geometry in the financial market. The most important feature in Fractal Pattern Scanner is the ability to measure the turning point probability as well as the trend probabi
現在40%オフ 初心者やエキスパートトレーダーに最適なソリューション! このインジケーターは、独自の機能と新しい計算式を取り入れた、ユニークで高品質、かつ手頃な価格のトレーディングツールです。たった1枚のチャートで28の為替ペアの通貨強度を読み取ることができます。新しいトレンドやスキャルピングチャンスの引き金となるポイントを正確に特定することができるので、あなたのトレードがどのように改善されるか想像してみてください。 ユーザーマニュアルはこちら  https://www.mql5.com/en/blogs/post/697384 これが最初の1本、オリジナルだ! 価値のないクローンを買わないでください。 特別な サブウィンドウの矢印で強い通貨の勢いを表示 GAPがあなたのトレードを導く! 基準通貨や気配値が売られすぎ・買われすぎのゾーン(外相フィボナッチレベル)にあるとき、個別チャートのメインウィンドウに警告表示。 通貨がレンジの外側から反落した場合、プルバック/リバーサルのアラート。 クロスパターンの特別なアラート 複数の時間枠を選択可能で、トレンドを素早く確認できます
Advanced Supply Demand
Bernhard Schweigert
4.91 (300)
現在40%オフ 初心者にもエキスパートトレーダーにも最適なソリューション このインジケーターは独自の機能と新しい公式を多数内蔵しており、ユニークで高品質かつ手頃な取引ツールです。このアップデートでは、2つの時間枠ゾーンを表示できるようになります。より長いTFだけでなく、チャートTFとより長いTF(ネストゾーンを表示)の両方を表示できます。すべてのSupply Demandトレーダーの皆さんのお気に召すはずです。:) 重要情報の公開 Advanced Supply Demandの可能性を最大化するには、 https://www.mql5.com/ja/blogs/post/720245 にアクセスしてください。   エントリーまたはターゲットの正確なトリガーポイントを正確に特定できれば取引がどのように改善されるか想像してみてください。新しい基盤となるアルゴリズムに基づいて構築されているため、買い手と売り手の間の潜在的な不均衡をさらに簡単に特定できます。これは、最も強い需要と供給のゾーンと、過去のパフォーマンス(古いゾーンを表示)がグラフィカルに表現されるためです。これらの機能は、最適な
Market Structure Patterns   is an indicator based on   smart money concepts   that displays   SMC/ICT   elements that can take your trading decisions to the next level. Take advantage of the   alerts ,   push notifications   and   email messages   to keep informed from when an element is formed on the chart, the price crosses a level and/or enters in a box/zone. Developers can access the values of the elements of the indicator using the   global variables  what allows the automation of trading d
Advanced UT BOT ALERTS for MT4 プロフェッショナル多重フィルター型トレンド検出システム|強化版 UT BOT エンジン 私たちは高品質なインジケーターのみを提供します。 Advanced UT BOT はプロフェッショナル向けに設計されており、安定したシグナルロジックと安全な計算構造によって遅延や誤更新を防止します。 過去のシグナルを 再描画・修正・削除することはありません 。 すべての BUY / SELL シグナルは ローソク足の確定後に生成され固定されます 。 リアルタイム取引中に 再描画は一切なく 、足が確定した時点で即座に表示されます。 期間限定オファー — 次回価格は 49 ドルになります。 価格が上がる前に今すぐ入手してください。 製品概要 Advanced UT BOT ALERTS   は、 UT BOT   のコアロジックに基づいて再構築された次世代のトレンドシグナルシステムです。 MT5 に完全対応し、複数のフィルター、動的ビジュアル化、高精度アラートを統合しています。 UT Bot インジケーターはもともと   Yo_adrii
購入後、このインジケーターに基づいたボーナスEAを受け取るためにご連絡ください。 Self Optimizing Double MA Strategyは、パラメータ推測の必要性を排除するために設計されたプロフェッショナルグレードの取引ツールです。組み込みの自動最適化エンジンを搭載し、バックグラウンドで何千ものパラメータの組み合わせをシミュレートすることで、変化する市場状況に継続的に適応し、統計的な優位性を維持します。 静的で時代遅れの設定に依存するのではなく、インジケーターは自身のロジックを動的に更新し、現在の時間枠と取引商品にとって最も収益性の高い構成を見つけ出します。 主な機能 組み込みの自動最適化: 選択した更新頻度に基づいて、システムはFast MA、Slow MA、およびRSIの期間を定期的に再計算し、設定が常に現在の市場のリズムと一致するようにします。 MAダイバージェンスフィルター: 移動平均線が明確に乖離している(広がっている)場合にのみシグナルを検証する、トレンド強度のコア指標です。これにより、移動平均線が収束している相場や平坦なレンジ相場での誤ったエントリーを防ぎ
もしあなたがFX取引をしているなら、通貨の強さと通貨ペアの相関関係に関する詳細な情報を持つことは、取引パフォーマンスを飛躍的に向上させることができます。相関関係を活用すればリスクを半減でき、強さの分析を活用すれば利益を最大化することが可能です。 このインジケーターは、通貨の強さ分析と通貨ペアの相関関係を組み合わせたハイブリッドなアプローチにより、最適な通貨ペアを選択するサポートをします。 通貨の強さ分析の使い方 例えば、あなたの取引戦略でAUD/JPYの買いシグナルが出たとします。しかしKTの通貨強さ分析を使うと、JPYがAUDよりも強くなっていることがわかりました。この場合、その取引は損失に終わる可能性が高いです。このインジケーターがあれば、そのような損失を未然に防ぐことができます。 通貨ペア相関関係の使い方 例えば、NZD/USDとGBP/JPYの同時売りシグナルが出たとします。KTの通貨ペア相関ツールを使うと、これらのペアの相関率が77%であることが判明します。  これらのペアは強く相関しているため、同時に取引するとリスクが二重になります。もしNZD/USDで損失が出れば、
KURAMA GOLD SIGNAL PRO(MT4版)— 7層フィルター・自動TP/SL・品質スコア搭載 XAUUSD完全トレードシステム リペイントなし。リドローなし。ラグなし。すべてのサインは確定後に変わりません。見たままが結果です。 特典:買い切りライセンスをご購入いただいた方に、AI Zone Radar($59相当)+PDFマニュアルを無料プレゼント。購入後にMQL5でメッセージをお送りください。 AI Zone Radar: https://www.mql5.com/en/market/product/175834 トレーダーから信頼されています:ゴールドトレーダーのコミュニティで実際に使用され、精度と使いやすさで高く評価されています。 あなたの問題 — そしてその解決策 ゴールドは1日$30〜$50動く。チャンスがあるのは分かっている。でもこういう経験はないか: - エントリーが早すぎて、$10逆行してから思った方向に動く - MAタッチのたびに入って、半分は負ける - TP/SLの基準がないから、持ちすぎるか早すぎる決済をする - 動かない時間帯にトレ
「 Dynamic Scalper System 」インジケーターは、トレンド波の中でスキャルピング取引を行う手法のために設計されています。 主要通貨ペアと金でテスト済みで、他の取引商品との互換性があります。 トレンドに沿った短期的なポジションオープンのシグナルを提供し、追加の価格変動サポートも提供します。 インジケーターの原理 大きな矢印はトレンドの方向を決定します。 トレンド波の中では、小さな矢印の形でスキャルピングシグナルを生成するアルゴリズムが機能します。 赤い矢印は強気方向、青い矢印は弱気方向です。 トレンドの方向には敏感な価格変動ラインが描かれ、小さな矢印のシグナルと連動します。 シグナルは次のように機能します。適切なタイミングでラインが現れるとエントリーシグナルが形成され、ラインが開いている間はポジションが保持され、完了すると取引が終了します。 推奨される動作時間枠はM1~H4です。 矢印は現在のローソク足に形成され、次のローソク足が開いている場合は、前のローソク足の矢印は再描画されません。 入力パラメータ Trend Wave Period - トレンド方向
頭と肩のパターンは、3つのピークを持つベースラインに似たチャート構成であり、外側の2つは高さが近く、中央は最高です。強気から弱気のトレンド反転を予測し、最も信頼性の高いトレンド反転パターンの1つと考えられています。これは、トレンドが終わりに近づいていることをさまざまな精度で知らせるいくつかのトップパターンの1つです。 [ インストールガイド | 更新ガイド | トラブルシューティング | よくある質問 | すべての製品 ] クリアな取引シグナル カスタマイズ可能な色とサイズ パフォーマンス統計を実装します カスタマイズ可能なフィボナッチリトレースメントレベル 適切なストップロスおよび利益レベルを表示します インジケーターを使用して、継続パターンまたは反転パターンを見つけることができます 再描画および非再描画ではありません 電子メール/音声/視覚アラートを実装します 設定 チャートにインジケーターをロードすると、入力パラメーターとして一連のオプションが表示されます。パラメーターが自明のブロックにグループ化されているため、それらが多すぎると思う場合でも、絶望しないでください。これは、パ
このインディケーターはダブルトップとダブルボトムの反転パターンを見つけ、ブレイクアウトを使用して取引シグナルを発生させます。 [ インストールガイド | 更新ガイド | トラブルシューティング | よくある質問 | すべての製品 ] クリアな取引シグナル カスタマイズ可能な色とサイズ パフォーマンス統計を実装します カスタマイズ可能なフィボナッチリトレースメントレベル 適切なストップロスとテイクプロフィットのレベルを表示します 電子メール/音声/視覚アラートを実装します これらのパターンは拡張でき、インジケーターは再描画によってパターンに追従します。ただし、インジケーターはトレードを容易にするためにツイストを実装します。トレードをシグナルする前に正しい方向へのドンチャンブレイクアウトを待機し、シグナルを非常に信頼性が高く、ほとんど再描画しません。 入力パラメータ 振幅:振幅は、代替価格ポイント間のバーの最小量を表します。大きなパターンを見つけるには、振幅パラメーターを大きくします。小さなパターンを見つけるには、振幅パラメーターを小さくします。 最小リトレースメント:パターンに
Special offer : ALL TOOLS , just $35 each! New tools   will be   $30   for the   first week   or the   first 3 purchases !  Trading Tools Channel on MQL5 : Join my MQL5 channel to update the latest news from me スリーバーレバーサルパターンインジケーター は、トレーダーに強力なツールを提供し、価格チャート上で三本の反転パターンを自動的に識別して強調表示します。このインジケーターは、潜在的なトレンドの反転を検出するための貴重なリソースであり、統合されたトレンドインジケーターを通じて信号精度を向上させることができます。 MT5バージョンの詳細はこちら: Three Bar Reversal Pattern MT5 その他の製品はこちら:   すべての製品 主な機能 パターンの自動検出: このインジケーターは、三本の反転パターンをスキャンし、視覚的に明確なシグナルで表示し、潜在的なト
チャートを構成し、周期的な価格変動を識別するテクニカル指標。 どのチャートでも動作します。 いくつかの種類の通知。 グラフ自体に追加の矢印があります。 履歴を再描画せずに、キャンドルのクローズに取り組みます。 M5以上のTFを推奨します。 パラメータの使用と設定が簡単です。 異なるパラメータを持つ 2 つのインジケーターを使用する場合、他のインジケーターなしで使用できます。 入力パラメータは2つあります 周期性と信号持続時間 これら 2 つのパラメータは、チャート構造の処理を扱います。 Cyclicity - 反転サイクルが変化する頻度を調整し、サイクルを滑らかにします。 Signal duration - 最小数では価格変動の衝動を検出し、最大数では長期的なトレンドの動きを検出します。
作者のその他のプロダクト
The utility copies trades from the signal provider accounts (master accounts, one or multiple providers) to unlimited number of receiver accounts (slave accounts).  Attention! Y ou need to use identifiers (Provider number) of the same length if you use several master copiers. For example. 1, 2, 3 or 11, 13, 22. The copying can be set in the opposite direction. The comments with all the recently performed actions are displayed on the screen to monitor the utility actions in slave mode. To avoid p
The Expert Advisor receives signals from an artificial neural network that uses the RSI indicator. Trades are closed by the opposite signals. Presence of a signal is checked at the closing of the bar. The EA also has the following functions: changing a position volume in proportion to the change in balance (function for the tester); transfer of unprofitable trades into breakeven; Parameters Start with lot - initial position volume increased in proportion to the balance change; Lotsize by balanc
FREE
The indicator analyzes the change in the minimum and maximum prices of the previous bars fixing the entrance of the big players. If the change (delta) increases, a signal is displayed on the graph in the form of an arrow. At the same time, virtual trade on history is carried out. In the free version, virtual trade is performed without refills in case of a repeat of the signal. The results of virtual trading in the form of losses / losses, profitability, drawdown and transaction lines are display
FREE
The indicator displays on a chart trading results. You can configure the color and font of displayed results, as well as filter trades based on the magic number. If multiple trades were closed within one bar of the current timeframe, the result is summed and output in one value. Utility parameters Plot profit in - the format of output results: wither in deposit currency taking onto account commission and swap, or in points. Start from - start processing data at the specified time. Plot last dea
FREE
The indicator displays the trading statistics of the analyzed Market signal on the chart. Signal transaction data is presented in an excel (csv) file and can be taken from the Signal>Trading history ( Export to CSV:  History ). The copied file must be saved to the directory MT4>File>Open Data Folder>MQL4>Files.  Available color management and font output.  If the currency names are different on the Signal and User accounts, use the Prefix and Suffix parameters. Utility options Prefix at Signal -
FREE
The indicator reads the current spread and displays it on the chart. The maximum value, the minimum value, the value at the time of opening the bar and the maximum value divided by 10 are displayed separately.  The indicator does not remember these values so the data will be lost if there is a change in the timeframe. The indicator is useful for analyzing market volatility, comparing the spread between brokers and different types of accounts. By default: Red line - maximum spread; Green bar -
FREE
The utility searches the price history looking for the pattern similar to the one within a specified interval. The length of a pattern and a specified interval is the same and set in bars. Similarity is estimated by comparing the bars' body colors, size and shadows. The subsequent price movement is displayed as lines for all detected patterns. The color of the lines defines the degree of similarity. The movement length is set as a number of bars. Search for patterns and visualization are perform
FREE
The utility copies trades from the signal provider accounts (master accounts, one or multiple providers) to unlimited number of receiver accounts (slave accounts). The provider is defined by the 'provider' parameter (any combination of numbers and letters). For example, there are two providers. Run the utility in master mode on them, and set different values to the provider parameter. On the account designated for copying these signals, run two utilities in slave mode in different windows, setti
This EA trades support/resistance levels which were placed by a trader (Trend Line from toolbar). The direction of a trade is set graphically by arrows: ↑ - buy; ↓ - sell; - buy or sell in case of crossing support/resistance level. The level is off if inconsistent directions were set, like: ↑↓, ↑, or ↓. If the price is lower than a level it is a resistance level. And opposite is true for support level. There are a few methods available for levels defining, for testing with visualization as
The Expert Advisor trades the signals from an artificial neural network. Network with one hidden layer. Presence of a signal is checked at the closing of the specified period, which significantly increases the optimization and testing speed. It differs from the previous version by a number of additional features: works with pending orders; subsequent trades are opened with a lot increased by the specified step; moves the trade to breakeven a specified time after it was opened; closes trades at t
The Expert Advisor trades the signals from an artificial neural network with one hidden layer. Presence of a signal is checked at the closing of the specified period. MAIN PARAMETERS Net option - setting the order grid. When placing a market (not pending, Pending order offset=0 ) order according to a signal, the grid order is set. The following direction are available: follow the trend , against the treand and both directions . The number of placed orders is taken from the ...maximum deals with
This utility searches the history for price patterns, which are similar to those present in the intervals selected by trader (there are several intervals, see the screenshot). The length of the pattern and selected intervals is the same and is given by the number of bars. The similarity is estimated by comparing the colors of bar bodies, sizes of bars' bodies and wicks. For all identified patterns, further movement of the price is visualized as lines. The color of lines determines the degree of
The Expert Advisor opens a trade in the direction of the previous price movement or in the opposite direction (selectable). The previous direction is determined based on the chosen time interval. The interval can be set to trading session hours and thus to check the theory that the price is inactive after session close. Multiple trades can be open at a time depending on input parameters. The Expert Advisor trails the stop loss order, and is provided with multiple breakeven and trade closing func
The Expert Advisor opens a trade in the specified direction at the specified time. If the price moves in the profit direction, additional trades are opened after a preset step. Trade are closed by a Stop Loss or upon reaching a target profit. The Expert Advisor trails the stop loss order, and is provided with multiple breakeven and trade closing functions (See the description of the parameters). Test and optimize the EA in the Tester using M1 open prices. The EA parameters can be controlled via
The indicator calculates the number of times the price crossed the levels and bounced off the levels in history. The levels are defined by horizontal lines (Horizontal lines element from the Toolbar). In the free version, the levels are set manually. To calculate the number of crosses and rebounds, the indicator uses the specified tolerance to touching a level. This tolerance is sensitive to the timeframe of the bars. For example: for M5 use a tolerance about 10 pips, for М30 - 30 pips, for D1 -
The indicator calculates the historic price statistics: the number of intersections of a level and the number of rollbacks. The levels are set as horizontal lines (the 'Horizontal lines' element on the Toolbar) manually, are are drawn automatically by the indicator with the specified step. Only strong levels are drawn in the automated mode. There are two options for the automated mode: 1. Strong levels of intersection and support/resistance; 2. Strong support/resistance levels. The indicator use
The indicator analyzes the change in the minimum and maximum prices of the previous bars fixing the entrance of the big players. If the change (delta) increases, a signal is displayed on the graph in the form of an arrow. At the same time, virtual trade on history is carried out. In case of a repeat of the signal, the positions are increased (refilling). Thus the lot of positions can differ. The results of virtual trading in the form of losses / losses, profitability, drawdown and transaction li
The cut release of Top Signals Strategy EA for less price. With default parameters EA works in Assian session and scalps market. EA opens trades by RSI indicator signals in a specified time interval. In the case of a repetition of the signal opens a unidirectional transaction. The number of transactions per day can be limited. Revolves trades on the opposite signal. Displays information on trade and its results. Also you can set virtual stop loss and take profit. Telegram channel for discation p
The cross-correlation indicator calculates the relationship between the specified pairs for the previous period. Automatically selects the instruments with the highest and the lowest correlation, and then simulates trading on the selected pairs on the same test period. Then indicator displays the pairs that have shown the best trading results. Visualizes the PAC (Pairs Arbitrage Correlation) criterion for the pairs selected by the trader. The signal to open trades is set by the PAC levels. When
EA trades pairs selected by correlation criterion. The choice is made in such a way that there are pairs with negative and neutral correlation to the main pair. The PAC indicator is used to automate the selection of pairs  https://www.mql5.com/en/market/product/41985 Expert is multycurrency, thus it is no use to test it in the MT4 terminal. So, watch for real signal and joing to telegram channel. After setting the pairs, the expert Advisor simulates trading for the previous period with visualiz
Simplified release of PACman EA. Expert is multycurrency, thus it is no use to test it in the MT4 terminal. So, watch for real signal and joing to telegram channel. After setting the pairs, the expert Advisor simulates trading for the previous period with visualization of the results. The user can interactively change the signal levels and observe their impact on the simulation result. In this way, you can select the optimal level values. By manually moving the vertical boundary lines to the ri
Simple and fast trade duplicator that copies trades on the same account with the reverse function. The reverse can be used for locking. You can choose to duplicate transactions for the current or all instruments.  Parameters Duplicate in reverse - the direction of duplication; Duplicate symbol - duplicate the selected tool; Manual lot size - hand size of the volume; Do not duplicate if spread > - do not duplicate a trade if the current spread is larger; List of magic to be duplicated - filte
This expert Advisor uses the saved trading history to repeat trades in the strategy tester. Meanwhile you can set other values for take profit, stop loss, and closing time. Thus, you can check how the results of trading with other parameters would look like. The best set of parameters can be obtained using the strategy optimizer in the MT4 terminal. In addition, you can find out how the results of trading would be affected by the later opening of trades when the price went to the loss side. You
フィルタ:
レビューなし
レビューに返信