Pattern Finder4Free

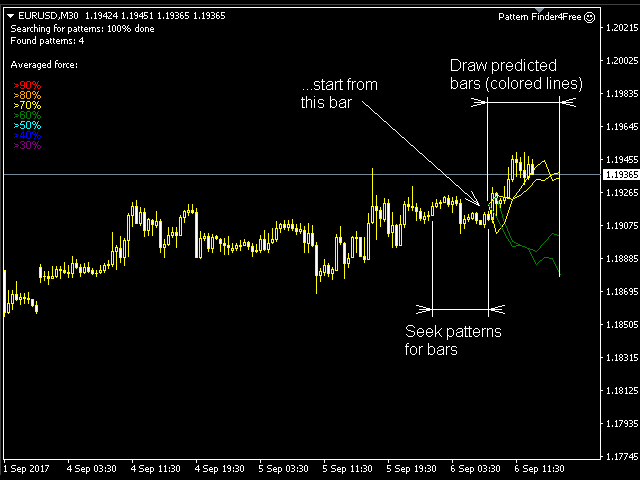
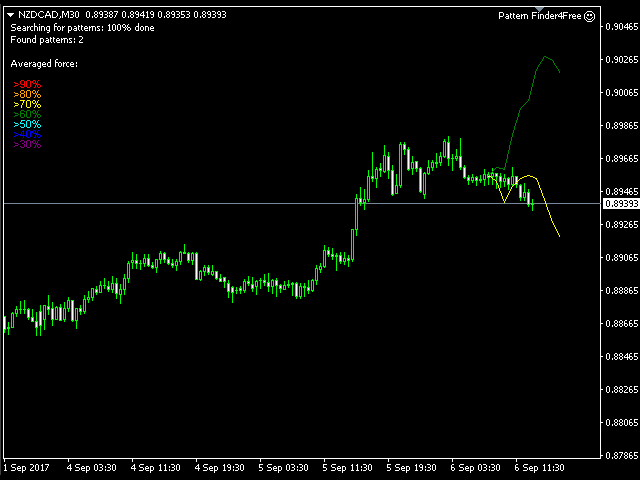
The utility searches the price history looking for the pattern similar to the one within a specified interval. The length of a pattern and a specified interval is the same and set in bars. Similarity is estimated by comparing the bars' body colors, size and shadows. The subsequent price movement is displayed as lines for all detected patterns. The color of the lines defines the degree of similarity. The movement length is set as a number of bars. Search for patterns and visualization are performed at any specified bar. The numbering is regular - from right to left from 0 (last open bar).


Parameters

  • Seek patterns for bars – length of the selected interval in bars used to search for matches (patterns);
  • ...start from this bar – index of the bar the search starts from;
  • Draw predicted bars – length of further price movement visualization, in bars;
  • Use History (bars) – length of history, on which the search for patterns is performed, in bars;
  • Pattern force by bars color (%) – patterns' body color similarity degree, in % from 0 (not checked) to 100;
  • Pattern force by bodies size (%) – patterns' body size similarity degree, in % from 0 (not checked) to 100;
  • Pattern force by shadows size (%) – patterns' shadow size similarity degree, in % from 0 (not checked) to 100;
  • Pattern Timeframe – search for patterns on bars within the specified timeframe.


Recommendation

The less the length of the selected timeframe (Seek patterns for bars), the higher the forces' values should be. For example, the length of the highlighted interval is 10 bars on the screenshots. The color force is 100%, the body size force is 30% and the shadow size force is 30%. If we set the length to 3 bars, the forces should exceed 80%.

The simplified version of the utility is to be posted in CodeBase. Also, the paid utility with more options is to be available in the Market.

おすすめのプロダクト
--- FREE VERSION - WORKS ONY ON EURUSD ------------------------------------------------------------------- This is a unique breakout strategy that is used for determination of the next short term trend/move. The full system is available on MQL5 under the name "Forecast System". Here is the link -->  https://www.mql5.com/en/market/product/104166?source=Site Backtest is not possible, because calculations are done based on the data of all timeframes/periods. Therefore I propose you use the technolo
FREE
Free automatic Fibonacci is an indicator that automatically plots a Fibonacci retracement based on the number of bars you select on the BarsToScan setting in the indicator. The Fibonacci is automatically updated in real time as new highest and lowest values appears amongst the selected bars. You can select which level values to be displayed in the indicator settings. You can also select the color of the levels thus enabling the trader to be able to attach the indicator several times with differe
FREE
DF Fib Trader Pro DF Fib Trader Proは、MetaTrader 4向けに設計された自動取引システムです。 フィボナッチベースの価格水準とトレンドおよびストラクチャー分析を組み合わせ、エントリーポイントとエグジットポイントを決定します。このEAはロングポジションとショートポジションの両方をサポートし、リスク管理パラメータも組み込まれています。 主な機能: • フィボナッチ・リトレースメントとエクステンション・ロジックを用いて、エントリーポイント、SLポイント、TPポイントをプロットします。 • ロットサイズと損切り/利益確定レベルを設定可能 • エントリーポイントは1つまたは2つから選択可能 • 市場状況に応じて、固定または動的な損切り/利益確定をサポート • 複数の時間枠と通貨ペアに対応 • 最大スプレッド、スリッページ、取引頻度の制御オプションを搭載 • 自動取引管理:損益分岐点、トレーリングストップ、部分決済オプション • 希望に応じて成行注文もサポート入力項目の概要: • リスク管理:ロットサイズ、取引ごとのリスク、最大取引回数 • エントリー
FREE
Индикатор "Стрелки" (Arrow Drawing Tool) Краткое описание: Удобный инструмент для рисования стрелок на графике с помощью кнопки и мыши. Позволяет визуально отмечать направления движения цены, уровни поддержки/сопротивления и важные ценовые зоны. Основные возможности: Простое управление   - кнопка "Стрелка" для активации режима рисования Автоматическая окраска   - зеленые стрелки для движения вверх, красные для движения вниз Настраиваемый дизайн   - регулируемая длина и угол наконечника стрелки Г
FREE
this EA draws vertical lines on the chart, either consecutive or alternating lines, depending on the input settings. Since vertical lines often represent time events, timing is important in trading. StartTime = D'2025.03.12 23:00';  // Starting point (time and date) NumberOfLines = 10;                    // Total number of lines to draw IntervalCandles = 1;                   // Interval in candles (must be > 0) IntervalMinutes = 30;                  // Interval in minutes (0 to disable) Directi
FREE
Mr Beast Indicator
Luis Mariano Vazquez Marcos
Indicador Gratuito desarrollado por Mr Beast Inversiones Mr Beast : Gestión de riesgo profesional. Brindo a la comunidad la entrada a productos de M Beast. Echar un vistazo a mis señales y expert advisors. Descuentos de hasta 70% Diclaimer: La negociación en Forex, CFD y Opciones conlleva un riesgo de pérdida sustancial y no es adecuada para todos los inversores. El alto grado de apalancamiento puede actuar en su contra y también en su favor, Antes de decidirse a operar en productos tan apalanca
FREE
This is a multi-timeframe version of the popular Hull Moving Average (HMA). The Double HMA MTF Light indicator combines two timeframes on a single chart. The HMA of the higher timeframe defines the trend, and the HMA of the current timeframe defines short-term price movements. The indicator is freely distributed and hasn't audio signals or messages. Its main function is the visualization of price movements. If you need advanced functionality of the HMA multi-timeframe indicator (information ab
FREE
The indicator displays signals according to the strategy of Bill Williams on the chart. Demo version of the indicator has the same features as the paid, except that it can work only on a demo account . Signal "First Wise Man" is formed when there is a divergent bar with angulation.  Bullish divergent bar - with lower minimum and closing price in the upper half. Bearish divergent bar - higher maximum and the closing price at the bottom half. Angulation is formed when all three lines of Alligator
FREE
This indicator has been created for finding the probable reversal points of the symbol price. A small candlestick reversal pattern is used it its operation in conjunction with a filter of extremums. The indicator is not redrawn! If the extremum filter is disabled, the indicator shows all points that have a pattern. If the extremum filter is enabled, the condition works – if the history Previous bars 1 candles back contains higher candles and they are farther than the Previous bars 2 candle, such
FREE
Binary options tester Trading panel to test your strategies according to the rules of binary options. Scope: Set the percentage of profit from the transaction. Set the expiration time in seconds. Set the bet size Set the Deposit amount. Make several deals in a row. Keep track of the time before expiration. The tick chart with trade levels is duplicated to an additional window for accuracy. It allows you to work both in the testing mode and in the real quotes mode. The program gives an idea of bi
FREE
Pin Bars
Yury Emeliyanov
5 (4)
主な目的:"ピンバー"は、自動的に金融市場チャート上のピンバーを検出するように設計されています。 ピンバーは、特徴的なボディと長いテールを持つキャンドルであり、トレンドの反転または修正を知らせることができます。 それがどのように機能するか:インジケーターはチャート上の各キャンドルを分析し、キャンドルの体、尾、鼻のサイズを決定します。 事前定義されたパラメータに対応するピンバーが検出されると、インジケータはピンバーの方向(強気または弱気)に応じて、上矢印または下矢印でチャート上に パラメータ: TailToBodyRatio-テールの長さとピンバーのボディサイズの最小比率を定義します。 NoseToTailRatio-ピンバーの「ノーズ」とテールの間の最大許容比を設定します。 ArrowSize-マークされたピンバーとチャート上のピンバーを指す矢印との間の距離を定義します。 適用:"ピン棒"の表示器が潜在的な傾向の逆転ポイントを識別し、市場か近い位置を書き入れる信号を発生させるのに使用することができます。 正しく使用され、他のテクニカル指標や分析方法と組み合わせると、指標は取引結果
FREE
Bar Size MT4
Mikhail Tcvetkov
5 (3)
The technical indicator, in real time, searches for candlesticks that exceed the size set in the settings and gives signals about them. As a rule, such abnormally large candles appear either at the beginning of strong impulses or at the end of a directional price movement. At the beginning of the pulse, the signal can serve as a basis for searching for an entry point, at the end of the movement, it is a sign of a climax and may indicate the near end of the trend. The reference size for filtering
FREE
Triple RSI
Pablo Leonardo Spata
1 (1)
LOOK AT THE FOLLOWING STRATEGY   WITH THIS INDICATOR.   Triple RSI   is a tool that uses the classic Relative Strength Indicator, but in several timeframes to find market reversals.    1.  ️ Idea behind the indicator and its strategy: In Trading, be it Forex or any other asset, the ideal is   to keep it simple, the simpler the better . The   triple RSI   strategy is one of the simple strategies that seek market returns. In our experience, where there is more money to always be won, i
FREE
Binary Options Assistant (BOA) BURN Signals Indicator provides signals based on Ana Trader Binary Options Strategy. Indicators: MACD & Stochastic Stop missing trades, stop jumping from chart to chart looking for trade set-ups and get all the signals on 1 chart! U se any of the BOA Signals Indicator with the  Binary Options Assistant (BOA) Multi Currency Dashboard .   All BOA Signal Indicator settings are adjustable to give you more strategy combinations. The signals can be seen visually and
FREE
Vanexio
Sayan Vandenhout
VANEXIO USES THE TREND WAVE INDICATOR AND IT CAN IDENTIFY THE BEGINNING AND THE END OF A NEW WAVE TREND MOVEMENT. AS AN OSCILLATOR, THE INDICATOR IDENTIFIES THE OVERBOUGHT AND OVERSOLD ZONES. IT WORKS GREAT TO CATCH THE SHORT TERM PRICE REVERSALS AND USES A MARTINGALE STRATEGY TO CLOSE ALL TRADES IN PROFIT. USE DEFAULT SETTINGS ON H1 OR HIGHER TIME FRAME ON ANY PAIR FOR MORE ACCURATE TRADES WHY THIS EA : Smart entries calculated by 5 great strategies The EA can be run on even a $20000 acco
FREE
Fibonacci Entries
Christianiel Robles Faustino
Objective: To automatically show the Fibonacci entries from last candle. Inputs: 1.        Show/Hide the Fibonacci entries 2.        Set where the Fibonacci will draw, 0 = current, 1 = last bar … (Default = 1) 3.        Set the Fibonacci color 4.        Set the line style 5.        Set the minimum candle size automatically/manually in which the fib levels will appear 6.        Set the candle size based on ADR/X Fibonacci levels: 23.6, 38.2, 50  Other Tools: https://www.mql5.com/en/market/product
FREE
Wicks UpDown Target GJ Wicks UpDown Target GJ is specialized in GJ forex pairs. Choppy movement up and down on the opening range every day.  Trading breakouts on London session and New York session is recommended. Guideline Entry Strategy Idea: Step 1 - Breakout Forming (Warning! Trade on London Session and New York Session) Step 2 - Breakout Starting (Take Action on your trading plan) Step 3 - Partial Close your order & set breakeven (no-risk) Step 4 - Target complete Step 5 - Don't trade
FREE
MTF Alligator
Alexander Pekhterev
4.75 (8)
This is an indicator detecting trend direction. It uses the popular Bill Williams Alligator. It shows market state on all timeframes on one chart. As is well known, traders gain the main profit on the Forex market trading by trend, and losses usually occur when the market is flat. So, in order to gain profit a trader should learn to detect trend market and direction of a current trend in a rapid manner. This indicator has been developed for this purpose. MTF Alligator helps to: Profitably trade
FREE
FlatBreakout (Free Version) Flat Range Detector and Breakout Panel for MT4 — GBPUSD Only FlatBreakout is the free version of the professional FlatBreakoutPro indicator, specially designed for flat (range) detection and breakout signals on the GBPUSD pair only. Perfect for traders who want to experience the unique fractal logic of FlatBreakout and test breakout signals on a live market without limitations. Who Is This Product For? For traders who prefer to trade breakout of flat ranges (breakout,
FREE
QuantumAlert Stoch Navigator is a free indicator available for MT4/MT5 platforms, its work is to provide "alerts" when the market is inside "overbought and oversold" regions in the form of "buy or sell" signals. This indicator comes with many customization options mentioned in the parameter section below, user can customise these parameters as needful. Join our   MQL5 group , where we share important news and updates. You are also welcome to join our private channel as well, contact me for the p
FREE
Harvest FX
Sayan Vandenhout
4.56 (9)
Harvest FX USES THE TREND WAVE INDICATOR AND IT CAN IDENTIFY THE BEGINNING AND THE END OF A NEW WAVE TREND MOVEMENT. AS AN OSCILLATOR, THE INDICATOR IDENTIFIES THE OVERBOUGHT AND OVERSOLD ZONES. IT WORKS GREAT TO CATCH THE SHORT TERM PRICE REVERSALS AND USES A MARTINGALE STRATEGY TO CLOSE ALL TRADES IN PROFIT. USE DEFAULT SETTINGS ON H1 OR HIGHER TIME FRAME ON ANY PAIR FOR MORE ACCURATE TRADES WHY THIS EA : Smart entries calculated by 3 great strategies The EA can be run on even a $30000 a
FREE
Update:ver1.53 (2023/08/16) ・概要と必要環境 手動発注もしくは他ツール等からの発注に対し、指値発注予約の複製を生成します。こちらは「発注操作の簡易化」に特化したものになります。発注判断となる分析は、資料を漁る、経験則を導く、他の分析ツールやEAを併用する等、利用者ご自身で頑張ってください。なお、ver1.28より、「決済後、自動で再発注する」機能が実装されました。(有償版でのみ有効化できます) ・導入と導入後の操作 導入そのものは簡単です。「自動売買可能なEA」として、適当なチャートにて動作させるだけです。(チャートの対象相場は問いません。このEAは、チャートを見ていません)。あとは、「このEAでのローカルコピー以外の発注」があれば、それに応じて「損失が出た場合に備えての追加取引の予約」という形で、指値発注が自動生成されます。 導入操作上の注意として、「本EAを、複数のチャートで動作」はできません。EAがチャート自体を見ておらず、注文状況だけを見ているため、複数のチャートで動かす意味もありません。また、ターミナルとEAの設定として「自動売買」を許可しない
FREE
ZeroOptZigZag
Stanislav Korotky
5 (1)
This is yet another non-parametric ZigZag. Its every upward edge continues until next bar's high is formed below highest low of its bars, and every downward edge continues until next bar's low is formed above lowest high of its bars. In addition to zigzag itself (shown in orange color), the indicator shows signal marks on those bars where zigzag direction changes. The blue arrow up denotes that new bullish edge is started (but not yet completed), whereas the red arrow down denotes that new beari
FREE
Magnet Draw MT4
Phongwiroon Khompradit
5 (1)
Emulate TradingView drawing experience with magnet snap to the nearest price. Supported drawing tools: Vertical Line Horizontal Line Trend Line Horizontal Ray (Angle Trend Line) Fibonacci Retracement Rectangle Input: Threshold (px) : The distance in pixel unit to snap the crosshair to the nearest price. Crosshair color: The color of crosshair. Feel free to write the review, request more features or report bugs.
FREE
This utility allows you to check and improve your binary options trading skills. This is an indicator, not an Expert Advisor. Therefore, you do not need to remove your active EA from the chart. Inputs Expiry, min - option expiration time; InfoPanel background color - info panel background color; InfoPanel text color - info panel text color; InfoPanel text fontsize - info panel font size.
FREE
In a departure from the conventional approach, traders can leverage the bearish engulfing candlestick pattern as a buy signal for short-term mean reversion trades. Here's how this alternative strategy unfolds: The bearish engulfing pattern, (typically signaling a reversal of bullish momentum) , is interpreted differently in this context. Instead of viewing it as a precursor to further downward movement, we perceive it as an indication of a potential short-term bounce or mean reversion in prices.
FREE
Star Reversal Pro - Morning & Evening Star Pattern Detector with Advanced Filters Star Reversal Pro is a professional technical indicator for MetaTrader 4 that automatically detects Morning Star and Evening Star candlestick patterns. The indicator features an intelligent trend filter and Higher Timeframe confirmation to improve signal quality and reduce false signals. Main Features: The indicator precisely detects Morning Star (bullish reversal signal) and Evening Star (bearish reversal signal)
FREE
Position Selective Close MT4
Francisco Manuel Vicente Berardo
The Position Selective Close is a multi-symbol multi-timeframe script used to close simultaneously various positions.  General Description   The Position Selective Close   possesses   three operation modes (Intersection,   Union   and All) that control the way   as   four position features (symbol, magic number,   type   and profit) are used. The modes, available through the Selection Mode input parameter, relate to the features, available through the “Select by Feature” and “Feature” input pa
FREE
PZ Heiken Ashi EA
PZ TRADING SLU
4.8 (10)
This EA trades using the Heiken Ashi Smoothed Indicator. It offers many trading scenarios and flexible position management settings, plus many useful features like customizable trading sessions, a martingale and inverse martingale mode. [ Installation Guide | Update Guide | Troubleshooting | FAQ | All Products ] Easy to use and supervise It implements three different entry strategies Customizable break-even, SL, TP and trailing-stop Works for ECN/Non-ECN brokers Works for 2-3-4-5 digit symbols T
FREE
このプロダクトを購入した人は以下も購入しています
Local Trade Copier EA MT4
Juvenille Emperor Limited
4.96 (106)
Local Trade Copier EA MT4 による、驚くほど高速な取引コピーを体験してください。1分で簡単にセットアップできるこの取引コピー機は、同じWindowsコンピュータまたはWindows VPS上の複数のMetaTrader端末間で取引をコピーすることができ、0.5秒未満の高速コピースピードを実現します。 初心者であろうとプロのトレーダーであろうと、 Local Trade Copier EA MT4 には、あなたの特定のニーズに合わせてカスタマイズするための幅広いオプションが用意されています。これは、利益の可能性を高めたい人にとって究極のソリューションです。 今すぐ試してみて、これが市場で最も速くて簡単なトレードコピー機である理由を理解してください。 ヒント: デモアカウントで Local Trade Copier EA MT4 デモバージョンをダウンロードして試すことができます: ここ ダウンロードした無料のデモ ファイルを MT4 >> ファイル >> データ フォルダを開く >> MQL4 >> Experts フォルダに貼り付けて、ターミナルを再起動しま
Trade Assistant MT4
Evgeniy Kravchenko
4.42 (193)
取引 ごとのリスクの 計算、新規注文 の 簡単 な 設置、部分的 な 決済機能 を 持 つ 注文管理、 7 種類 のトレーリングストップなど 、便利 な 機能 を 備 えています 。 追加の資料と説明書 インストール手順 - アプリケーションの手順 - デモアカウント用アプリケーションの試用版 ライン機能 チャート上にオープニングライン、ストップロス、テイクプロフィットを表示します。この機能により、新規注文を簡単に設定することができ、注文を出す前にその特徴を確認することができます。   リスク計算 リスク計算機能は、設定されたリスクとストップロス注文のサイズを考慮して、新規注文のボリュームを計算します。ストップロスの大きさを自由に設定できると同時に、設定したリスクを守ることができます。 Lot calc ボタン - リスク 計算 を 有効 / 無効 にします 。 Risk フィールドでは 、必要 なリスクの 値 を 0 から 100 までのパーセンテージまたは 預金通貨 で 設定 します 。 設定」 タブで 、 リスク 計算 の 種類 を 選択 します :「 $ 通貨」、「 % 残
Trade Manager EAへようこそ。これは、取引をより直感的、正確、そして効率的にするために設計された究極の リスク管理ツール です。これは単なるオーダー実行ツールではなく、包括的な取引計画、ポジション管理、リスク管理のためのソリューションです。初心者から上級者、迅速な実行を必要とするスキャルパーまで、Trade Manager EAはあらゆるニーズに対応し、為替、指数、商品、暗号通貨などさまざまな市場で柔軟に対応します。 Trade Manager EAを使用すると、複雑な計算が過去のものになります。市場を分析し、エントリーポイント、ストップロス、テイクプロフィットのレベルをチャート上のラインでマークし、リスクを設定するだけで、Trade Managerが最適なポジションサイズを即座に計算し、SLとTPをピップ、ポイント、口座通貨でリアルタイムに表示します。すべての取引が簡単かつ効果的に管理されます。 主な機能: ポジションサイズ計算機 :定義されたリスクに基づいて取引サイズを瞬時に決定します。 簡単な取引計画 :エントリー、ストップロス、テイクプロフィットを設定するためのド
The product will copy all telegram signal to MT4   ( which you are member  ) , also it can work as remote copier.  Easy to set up, copy order instant, can work with almost signal formats, image signal, s upport to translate other language to English Work with all type of channel or group, even channel have "Restrict Saving Content", work with  multi channel, multi MT5 Work as remote copier: with signal have ticket number, it will copy exactly via ticket number. Support to backtest signal. How to
Exp COPYLOT CLIENT for MT4
Vladislav Andruschenko
4.69 (65)
MetaTrader4のコピー機を取引します。     それは任意の口座からの外国為替取引、ポジション、注文をコピーします。 それは最高の貿易コピー機の1つです     MT4 - MT4、MT5 - MT4     のために     COPYLOT MT4     バージョン(または     MT4 - MT5  MT5 - MT5     のために     COPYLOT MT5     バージョン)。 MT5のバージョン 完全な説明   +DEMO +PDF 購入する方法 インストールする方法     ログファイルの取得方法     テストと最適化の方法     Expforex のすべての製品 のコピー機 バージョン       MetaTrader 5 ターミナル(   МТ5 - МТ5、МТ4 - МТ5   )-   コピーロットクライアントMT5 独自のコピーアルゴリズムにより、すべての取引がマスターアカウントからクライアントアカウントに正確にコピーされます。 また、動作速度が速いことでも知られています。タフなエラー処理。 強力な機能セット。 プログラムは、複数
Copy Cat More Trade Copier MT4 (コピー猫MT4) は単なるローカル取引コピーツールではなく、現代の取引課題に対応するために設計された完全なリスク管理と実行フレームワークです。Propファームのチャレンジから個人の資産管理まで、強力な実行力、資金保護、柔軟な設定、高度な取引処理を組み合わせ、あらゆる状況に適応します。 このコピーツールは Master(送信側) と Slave(受信側) の両モードで動作し、成行注文や指値注文のリアルタイム同期、取引修正、部分決済、Close By 操作をサポートします。デモ口座・リアル口座の両方に対応し、取引用パスワードまたは投資家パスワードでも利用可能です。Persistent Trade Memory 技術により、EA・ターミナル・VPS が再起動しても復元可能です。複数の Master と Slave を同時に管理でき、ブローカー間の違いはプレフィックス/サフィックスの自動調整やシンボルマッピングで処理されます。 マニュアル/設定: Copy Cat Trading Copier マニュアル Copy Cat Mo
Trade copier MT4
Alfiya Fazylova
4.58 (33)
Trade Copierは、取引口座間の取引をコピーして同期するように設計された専門的なユーティリティです。 コピーは、同じコンピューターまたはvps にインストールされている、サプライヤーのアカウント/端末から受信者のアカウント/端末に行われます。 購入する前に、デモ アカウントでデモ バージョンをテストできます。 デモ版 こちら 。 詳細な説明は こちら 。 主な機能と利点: MT5ネッティングアカウントを含む、MT4> MT4、MT4> MT5、MT5> MT4のコピーをサポートします。 高いコピー速度(0.5秒未満)。 ベンダーモードと受信者モードは同じ製品内に実装されています。 チャートから直接リアルタイムでコピーを制御できる、簡単で直感的なインターフェイス。 接続が切断されたり、端末が再起動されたりしても、設定と位置が失われることはありません。 コピーするシンボルを選択できます。また、受信者のシンボルを置き換えることもできます(例:EURUSD> USDJPY)。 バックコピーをサポートします。 特定の注文のみのコピーを有効にする機能。 取引開始価格の最大差と最大遅延時間を
--------------Welcome to use [MQL5 Signal Analyze Master]------------------  Function: Draw order tracks of MQL5 MT4 and MT5 signal on MT4 chart. [Using guide] 1.Use it as Experts. 2.Download history record from MQL5 signal(MT4 signal or MT5 signal).  3.Paste history record file below "MQL4/Files/" 4.Load [Signal Analyze Master] on the symbol chart what you want to analyze. 5.Paste the history record file name to parameter 'FileName' 6.Select  SignalType  match the history you download on MT4
Comprehensive on chart trade panel with the unique ability to be controllable from mobile as well. Plus has a library of downloadable configuration, e.g. exit rules, extra panel buttons, pending order setup and more. Please see our product video. Works with all symbols not just currency pairs. Features On chart panel plus controllable from free app for Windows, iPhone and Android Built-in script engine with library of downloadable configuration, e.g. add 'Close All Trades in Profit' button, exit
Tired of complex order placement and manual calculations? Trade Dashboard is your solution. With its user-friendly interface, placing orders becomes effortless, by a single click, you can open trades, set stop loss and take profit levels, manage trade lot size, and calculate risk to reward ratios, allowing you to only focus on your strategy. Say goodbye to manual calculations and streamline your trading experience with Trade Dashboard. Download  Demo Version  right now. You can find  Details of
Trading History - A program for trading and money management on the history of quotes in stratagy tester. It can work with pending and immediate orders, and is equipped with trailing stop, breakeven and take profit functions. Very good for training and testing different strategies. Manual (Be sure to read before purchasing) Advantages 1. Allows you to test any trading strategy in the shortest possible time 2. An excellent simulator for trading training. You can gain months of trading experience
このユーティリティを使用すると、マスター設定のある端末からスレーブ設定の他の端末にトランザクションをコピーできます 同時に、コピーするペアを選択し、いくつかのパラメータに従ってコピーされた順序のサイズを設定することができます。 ドローダウン損失制限を設定するか、収益性の高い取引のみをコピーします あなたは、他のブローカーのMT4またはMT5にMT4またはMT5から取引をコピーすることができます これで、MT4で作業している専門家の信号をMT5端末にコピーするか、またはバックすることは難しくありません コピーマスターを使用して、他のシグナル、Expert Advisors、手動取引から任意の取引をコピーします。  設定を使用して、ロットサイズ、取引方向を変更し、収益性の高い取引のみをコピーし、預金を保存するための値を設定することができます  コピーマスターは、一つのアカウント上の異なるサブスクリプションシグナルのいくつかの戦略を組み合わせることができます 取引をMT4にコピーするには、コピーマスター MT5バージョンが必要です。 https://www.mql5.com
TelegramからMT4へ: 究極のシグナルコピーソリューション Telegram to MT4 は、DLLを必要とせず、TelegramのチャンネルやチャットからMetaTrader 4プラットフォームに取引シグナルを直接コピーできる最先端のユーティリティです。この堅牢なソリューションは、比類のない精度とカスタマイズオプションにより、シグナルのシームレスな実行を保証し、時間を節約し、効率性を向上させます。 [ Instructions and DEMO ] 主な特徴 直接的なTelegram API統合 電話番号とセキュアコードで認証します。 ユーザーフレンドリーな EXE ブリッジを使用して、チャット ID を簡単に取得および管理します。 複数のチャネル/チャットを追加、削除、更新して、同時に信号をコピーします。 高度なフィルターによる信号解析 カスタム例外語 (例: 「レポート」、「概要」) を含む不要な信号をスキップします。 柔軟な SL および TP 形式 (価格、ピップ、ポイント) をサポートします。 シグナルが価格ではなくポイントを指定する場合、エントリ ポイントを自動
Riskless Pyramid
Snapdragon Systems Ltd
5 (1)
Introduction This powerful MT4 trade mangement EA offers a way potentially to aggressively multiply trade profits in a riskfree manner. Once a trade has been entered with a defined stoploss and take profit target then the EA will add three pyramid add-on trades in order to increase the overall level of profit. The user sets the total combined profit target to be gained if everything works out. This can be specified either as a multiple of the original trade profit or as a total dollar amount. Fo
MT4 to Telegram Signal Provider は使いやすく、完全にカスタマイズ可能なツールで、Telegramに信号を送信し、あなたのアカウントを信号提供者に変えることができます。 メッセージのフォーマットは 完全にカスタマイズ可能です! しかし、簡単な使用のために、あらかじめ定義されたテンプレートを選択し、メッセージの特定の部分を有効または無効にすることもできます。 [ デモ ]   [ マニュアル ] [ MT5バージョン ] [ Discordバージョン ] [ Telegramチャンネル ]  New: [ Telegram To MT5 ] セットアップ ステップバイステップの ユーザーガイド が利用可能です。 Telegram APIの知識は必要ありません。開発者が必要なものをすべて提供します。 主要機能 購読者に送信される注文の詳細をカスタマイズする機能 例えばブロンズ、シルバー、ゴールドなど、階層型のサブスクリプションモデルを作成できます。ゴールドサブスクリプションでは、すべての信号が得られますなど。 ID、シンボル、またはコメントによる注文のフ
利益追跡機能により、MetaTrader 4で総利益/損失に達した時にポジションをクローズします。 仮想ストップ(個別注文) を有効にできます。 買いと売りのポジションを別々に計算してクローズ(別々の買い/売り) します。 すべてのシンボルまたは現在のシンボルのみをクローズして計算(すべてのシンボル) します。 利益追跡(トレーリング・プロフィット) を有効にします。 預金通貨、ポイント、残高の%で総利益または損失をクローズします。 このアプリケーションは、他のEAと一緒に、または手動取引と組み合わせて、任意のアカウントで使用するために設計されています。 MT5 のバージョン 完全な説明 +DEMO +PDF 購入する方法 インストールする方法 ログファイルの取得方法 テストと最適化の方法 Expforex のすべての製品 取引ペアの全てまたは一部の合計バランスが設定された値以上になった時点で、すべてのポジションがクローズされ、注文が削除されます。 このバージョンは、指定された利益レベルでポジションをクローズできるだけでなく、より良い結果を得るために利益を追跡することも可能です。 C
現在20%オフ! 初心者やエキスパートトレーダーのためのベストソリューション! トレードを見直すことは、成功するトレーダーへの第一歩です。 成功するトレーダーは、定期的に自分の取引パフォーマンスを見直す習慣があります。 このツールは、まさにそれを行うのに役立ちます。 このツールであなたの取引を追跡することで、レビュープロセスが最も効果的になります。 手動取引またはEAの取引を分析します。 3つの一般的なビューを使用してください。ボタンをクリックするだけで切り替えることができます。 クローズド・トレード オープントレード クローズ+オープントレード すべての取引は、各シンボルごとに表示されます。他のシンボルに移動するには、シンボル名のボタンをクリックします。 新規にオープンした取引とクローズした取引にはAlertを使用します。オープントレードを監視するのに非常に便利です。EA、シグナル、または手動で開始されるかもしれません。 利益またはPIPsの結果を切り替えるには、ボタンをクリックするだけです。 利益 PIPs 次に、3つの分析タイプを切り替えます。ボタンを
Auto SLTP Maker MT4  is an assistant for all those who forget to set StopLoss and/or TakeProfit in deal parameters, or trade on a very fast market and fail to place them in time. This tool automatically tracks trades without StopLoss and/or TakeProfit and checks what level should be set in accordance with the settings. The tool works both with market and pending orders. The type of orders to work with can be set in the parameters. It can track either trades for the instrument it runs on, or all
AW Grids Maker
AW Trading Software Limited
4.33 (3)
AW_Grids_Makerは、保留注文からグリッドを構築するために使用されます。このユーティリティは汎用性が高く、柔軟な設定と直感的なパネルインターフェースを備えています。このプログラムは、必要なステップでSTOP注文とLIMIT注文からネットワークを構築し、ポジションボリューム乗数を使用します。 MT5版は こちら / 問題解決は こちら 利点: すべてのタイプの保留注文を使用します。 シンプルで柔軟な構成。 優れたデザインと多機能を備えたユーティリティ パネル。 よく考えられた情報モジュール 作品の特徴: ピラミッディング、クラシック平均化、マーチンゲールに適しています。 グリッドの開始、注文の追跡、終了を自動化します。 これは、取引システムの不可欠な部分になることも、独立した戦略になることもできます。 調整可能な距離と取引量増加係数を備えた、あらゆるタイプの注文のネットワークを構築します。 パネルの詳細な説明: トレーダーは、「Open_Buy」ボタンを使用して、保留中の買い指値注文と買い逆指値注文を開くことができます。 保留中の売りストップ注文と売りリミット注文を開くには
TradePanel MT4
Alfiya Fazylova
4.85 (91)
Trade Panel は、多機能の取引アシスタントです。このアプリケーションには手動取引用の 50 を超える取引機能が含まれており、ほとんどの取引操作を自動化できます。 注意、アプリケーションはストラテジー テスターでは動作しません。購入する前に、デモアカウントでデモ版をテストできます。デモ版 ここ 。 完全な手順 こちら 。 取引。 ワンクリックで取引操作を実行できます: 自動リスク計算を使用して未決の注文とポジションをオープンします。 ワンクリックで複数の注文とポジションをオープンします。 注文グリッドを開きます。 未決の注文とポジションをグループごとにクローズします。 ポジション反転 (買いを閉じて売りを開く、または売りを閉じて買いを開く)。 ポジションをロックします(買いポジションと売りポジションの量を均等にする追加のポジションをオープンします)。 ワンクリックですべてのポジションを部分的にクローズします。 すべてのポジションのテイクプロフィットとストップロスを同じ価格レベルに設定します。 すべてのポジションのストップロスをポジションの損益分岐点レベルに設定します。 注文とポ
Exp SafetyLock PRO
Vladislav Andruschenko
4.57 (28)
SAFETYLOCKを使用すると、トレーダーはすでにオープンしているポジションに対して反対の注文を設定することで、強い市場の反転を回避できます。 トレーダーまたはEAがポジションをオープンすると、SAFETYLOCKは自動的に反対の保留中の注文を設定します。 ポジションが損失に転じた場合、その保留中の注文がアクティブになり、ロックを作成して損失を最小限に抑えます。 このEAは、初期のポジションを閉じる、トレーリングストップを使用して利益を最大化する、またはロットを増やしてリスクを調整するなど、さまざまな操作を可能にします。 さらに、ポジションの価格に合わせて、保留中の注文の始値を変更することもでき、市場の動きに柔軟に対応することができます。 完全な説明 +DEMO +PDF 購入する方法 インストールする方法     ログファイルの取得方法     テストと最適化の方法     Expforex のすべての製品 基本的なパラメーター(ブログのパラメーターの完全な説明) MilliSecondsTimerForMonitoring – アルゴリズムの実行時間をミリ秒単位で指定します
これは、トレンドラインPROインジケーターの自動パラメータオプティマイザです 簡単かつ迅速に、あなたのお気に入りのトレンドラインプロインジケーターに最適なパラメータを選択します。 最適化には数秒しかかかりません。 オプティマイザでは、振幅、TP1-TP3、StopLoss、および選択した履歴セクション(日)の時間フィルタとHTFフィルタの値など、各ペアと期間に最適なパラメータを見つ 異なる時間枠を最適化するには、異なる範囲の履歴が必要です: M5-M15計算範囲パラメータ(日)=60(三ヶ月)を設定します。 M30-H1計算範囲パラメータ(日)=120(6ヶ月)を設定します。 H4パラメータの計算範囲(日数)を設定する=240(1年) D1-W1パラメータ計算範囲(日)=720(三年)を設定します。 MN1パラメータ計算範囲(日)=1200(五年)を設定します。 最適化後、パラメータはmql4>Files>T R E N D Lineoptimizedsettingsフォルダ内の既製のセットファイルに自動的に保存されます オプティマイザユーティリティの使用方法: 最適化
特定のストップロス レベルに基づいてポジション サイズやリスクを即座に計算できるツールは、プロのトレーダーと初心者のトレーダーの両方にとって重要です。 TRADE PRO 取引ユーティリティは、高速かつ正確な計算を提供し、時間的制約のある不安定な市場状況での意思決定を支援します。 MT5バージョン      /   追加の設置資材 主な機能: オリジナル。シンプル。効果的。 メインの取引パネルを開くためのユニークで便利な方法: チャートの右側にマウスを移動し、適切な方向をクリックして将来の注文を配置します。 市場注文のクイックセットアップ TRADE PROを使用して、残高または資本の割合でリスクレベルを設定するか、具体的なリスク額を指定します。チャート上でストップロスレベルを視覚的に定義することで、ツールが各通貨ペアの最適なポジションサイズを自動計算します。また、指定されたリスクリワード比率に基づいて、利益目標(テイクプロフィット)を自動的に設定することもできます。 複数の指値注文を出し、総リスクを分散します (グリッド モード)。 複数の売買取引を行う場合でも、グリッド戦略に従
Practice Simulator は、バックテスト、トレード練習、本番トレードを一つのツールで行えるオールインワンのトレードシミュレーターです。練習が必要な初心者から、分析を行う熟練トレーダーまで、あらゆるレベルのユーザーをサポートします。 Forexトレード、市場分析、または戦略最適化にフォーカスしましょう。Practice Simulator は、シンプルながらも豊富なリスク管理・トレードアシスト機能を備え、マーケットの休日でもいつでもシミュレーショントレードが可能です。 詳しくは、 セットアップ & ユーザーガイド をご覧ください。 主な機能 シミュレーショントレード – 休日でもいつでも取引可能。複数チャート(MTF)に同期対応。 バックテスト – 過去のデータを用いた戦略検証、トレードのリプレイ。 本番トレード – 同じインターフェースでスムーズにリアルトレードへ移行。 ユーザーフレンドリーなインターフェース – ワンクリック注文、TP/SLのドラッグ&ドロップ、まとめ決済。 高度なリスク管理 – 自動ロット計算、ダイナミックTP/SL、トレーリングストップでリスクをコン
The indicator has three main tools: Magnifier (Zoom chart), Ruler  ( Time and Price scales ),   and Crosshair. You can move it all around with your mouse and customize different formats for  displaying , customize   size and color of each element. The Magnifier (zoom chart) allows you to display candles from any time frame and at different scales. Hotkeys: 'Q' - higher timeframe, 'A' - lower timeframe, 'W' - decrease candle size, 'S' - increase candle size, 'Z' - show/hide zoom chart You can
EASY Insight AIO – スマートで手間いらずな取引のオールインワンソリューション 概要 数秒で市場全体——FX、ゴールド、暗号資産、指数、さらには株式まで——を、手作業のチャート確認や複雑なセットアップ・インジケーター導入なしにスキャンできたらどうでしょうか? EASY Insight AIO はAIトレードのための究極のプラグ&プレイ型エクスポートツールです。市場全体のスナップショットを、クリーンなCSVファイルで一括出力。ChatGPT、Claude、Gemini、Perplexityなど、さまざまなAIプラットフォームで即座に解析できます。 ウィンドウの切り替えやグラフのごちゃごちゃしたオーバーレイはもう不要。自動エクスポートされる純粋で構造化されたインサイトだけで、無駄なチャート監視に悩まされず、スマートなデータ主導の判断に集中できます。 なぜEASY Insight AIOなのか? 本当のオールインワン • セットアップ不要、インジケーターのインストール不要、チャートへのオーバーレイ不要。インストールして起動し、エクスポートするだけです。 マルチアセット対
PnL Calendar MT4
Keni Chetankumar Gajanan -
PnL Calendar ... analyse to profit PnL Calendar transforms your trading history into a clear calendar view, helping you spot profitable days, monitor risk in real time, and unify accounts with the new Multi‑Broker data export feature. Core Features Calendar Panel: Profit breakdowns by day, week, month, and year Account Panel: Balance, equity, margin alerts, multi‑timeframe summaries, overnight gap adjustments Risk Dashboard: Leverage, drawdown, profit factor, consistency ratio, holding time, ri
Unlimited Trade Copier Pro is a tool to copy trade remotely to multiple MT4, MT5 and cTrader accounts at different computers/locations over internet. This is an ideal solution for you if you are a signal provider and want to copy your trades to other receivers globally on your own rules. One provider can copy trades to multiple receivers and one receiver can get trade from multiple providers as well. The provider can even set the subscription expiry for each receiver, so that receiver will not b
Exp Averager
Vladislav Andruschenko
4.82 (22)
Exp-Averager は、 平均化取引を開始することで、特定のドローダウンを受けた取引を平均化するように設計されています。 アドバイザーは、現在のトレンドに沿って、または逆に新しいポジションを開くことができます。 一連のポジションに適用されるスマート トレーリング ストップ機能も含まれています。 アドバイザはポジションのロットサイズを増減できます。 これは、損失ポジションを平均価格に近づけるために広く使用されている戦略です。 MT5のバージョン 完全な説明 +DEMO +PDF 購入する方法 インストールする方法     ログファイルの取得方法     テストと最適化の方法     Expforex のすべての製品 リンク TickSniper スキャルパー の平均化システムの例 平均化機能を備えたユニバーサル取引アドバイザー The X Expert Advisor は、チャートが関連付けられている通貨ペアで動作します。 たとえば、EURUSD の平均化を有効にするには、EURUSD チャートを開いて Expert Advisor を実行します。 注記 このシステムは
EchoTrade Telegram to MT5 Copier Seamless, Instant, and Reliable Signal Copying - Direct from Telegram to MetaTrader 4! The product does not run in the strategy tester but you can get free trial version   here  for testing before purchase. Tired of manually executing trades from Telegram signals? EchoTrade automates the process, instantly copying trades from any Telegram channel or group directly into your MT5 account—accurately, efficiently, and without delay. Key Features: Universal Compatib
作者のその他のプロダクト
The utility copies trades from the signal provider accounts (master accounts, one or multiple providers) to unlimited number of receiver accounts (slave accounts).  Attention! Y ou need to use identifiers (Provider number) of the same length if you use several master copiers. For example. 1, 2, 3 or 11, 13, 22. The copying can be set in the opposite direction. The comments with all the recently performed actions are displayed on the screen to monitor the utility actions in slave mode. To avoid p
The utility copies trades from the signal provider accounts (master accounts, one or multiple providers) to unlimited number of receiver accounts (slave accounts). The provider is defined by the 'provider' parameter (any combination of numbers and letters). For example, there are two providers. Run the utility in master mode on them, and set different values to the provider parameter. On the account designated for copying these signals, run two utilities in slave mode in different windows, setti
The Expert Advisor receives signals from an artificial neural network that uses the RSI indicator. Trades are closed by the opposite signals. Presence of a signal is checked at the closing of the bar. The EA also has the following functions: changing a position volume in proportion to the change in balance (function for the tester); transfer of unprofitable trades into breakeven; Parameters Start with lot - initial position volume increased in proportion to the balance change; Lotsize by balanc
FREE
The indicator analyzes the change in the minimum and maximum prices of the previous bars fixing the entrance of the big players. If the change (delta) increases, a signal is displayed on the graph in the form of an arrow. At the same time, virtual trade on history is carried out. In the free version, virtual trade is performed without refills in case of a repeat of the signal. The results of virtual trading in the form of losses / losses, profitability, drawdown and transaction lines are display
FREE
The indicator displays on a chart trading results. You can configure the color and font of displayed results, as well as filter trades based on the magic number. If multiple trades were closed within one bar of the current timeframe, the result is summed and output in one value. Utility parameters Plot profit in - the format of output results: wither in deposit currency taking onto account commission and swap, or in points. Start from - start processing data at the specified time. Plot last dea
FREE
The indicator displays the trading statistics of the analyzed Market signal on the chart. Signal transaction data is presented in an excel (csv) file and can be taken from the Signal>Trading history ( Export to CSV:  History ). The copied file must be saved to the directory MT4>File>Open Data Folder>MQL4>Files.  Available color management and font output.  If the currency names are different on the Signal and User accounts, use the Prefix and Suffix parameters. Utility options Prefix at Signal -
FREE
The indicator reads the current spread and displays it on the chart. The maximum value, the minimum value, the value at the time of opening the bar and the maximum value divided by 10 are displayed separately.  The indicator does not remember these values so the data will be lost if there is a change in the timeframe. The indicator is useful for analyzing market volatility, comparing the spread between brokers and different types of accounts. By default: Red line - maximum spread; Green bar -
FREE
This EA trades support/resistance levels which were placed by a trader (Trend Line from toolbar). The direction of a trade is set graphically by arrows: ↑ - buy; ↓ - sell; - buy or sell in case of crossing support/resistance level. The level is off if inconsistent directions were set, like: ↑↓, ↑, or ↓. If the price is lower than a level it is a resistance level. And opposite is true for support level. There are a few methods available for levels defining, for testing with visualization as
The Expert Advisor trades the signals from an artificial neural network. Network with one hidden layer. Presence of a signal is checked at the closing of the specified period, which significantly increases the optimization and testing speed. It differs from the previous version by a number of additional features: works with pending orders; subsequent trades are opened with a lot increased by the specified step; moves the trade to breakeven a specified time after it was opened; closes trades at t
The Expert Advisor trades the signals from an artificial neural network with one hidden layer. Presence of a signal is checked at the closing of the specified period. MAIN PARAMETERS Net option - setting the order grid. When placing a market (not pending, Pending order offset=0 ) order according to a signal, the grid order is set. The following direction are available: follow the trend , against the treand and both directions . The number of placed orders is taken from the ...maximum deals with
This utility searches the history for price patterns, which are similar to those present in the intervals selected by trader (there are several intervals, see the screenshot). The length of the pattern and selected intervals is the same and is given by the number of bars. The similarity is estimated by comparing the colors of bar bodies, sizes of bars' bodies and wicks. For all identified patterns, further movement of the price is visualized as lines. The color of lines determines the degree of
The Expert Advisor opens a trade in the direction of the previous price movement or in the opposite direction (selectable). The previous direction is determined based on the chosen time interval. The interval can be set to trading session hours and thus to check the theory that the price is inactive after session close. Multiple trades can be open at a time depending on input parameters. The Expert Advisor trails the stop loss order, and is provided with multiple breakeven and trade closing func
The Expert Advisor opens a trade in the specified direction at the specified time. If the price moves in the profit direction, additional trades are opened after a preset step. Trade are closed by a Stop Loss or upon reaching a target profit. The Expert Advisor trails the stop loss order, and is provided with multiple breakeven and trade closing functions (See the description of the parameters). Test and optimize the EA in the Tester using M1 open prices. The EA parameters can be controlled via
The indicator calculates the number of times the price crossed the levels and bounced off the levels in history. The levels are defined by horizontal lines (Horizontal lines element from the Toolbar). In the free version, the levels are set manually. To calculate the number of crosses and rebounds, the indicator uses the specified tolerance to touching a level. This tolerance is sensitive to the timeframe of the bars. For example: for M5 use a tolerance about 10 pips, for М30 - 30 pips, for D1 -
The indicator calculates the historic price statistics: the number of intersections of a level and the number of rollbacks. The levels are set as horizontal lines (the 'Horizontal lines' element on the Toolbar) manually, are are drawn automatically by the indicator with the specified step. Only strong levels are drawn in the automated mode. There are two options for the automated mode: 1. Strong levels of intersection and support/resistance; 2. Strong support/resistance levels. The indicator use
The indicator analyzes the change in the minimum and maximum prices of the previous bars fixing the entrance of the big players. If the change (delta) increases, a signal is displayed on the graph in the form of an arrow. At the same time, virtual trade on history is carried out. In case of a repeat of the signal, the positions are increased (refilling). Thus the lot of positions can differ. The results of virtual trading in the form of losses / losses, profitability, drawdown and transaction li
The cut release of Top Signals Strategy EA for less price. With default parameters EA works in Assian session and scalps market. EA opens trades by RSI indicator signals in a specified time interval. In the case of a repetition of the signal opens a unidirectional transaction. The number of transactions per day can be limited. Revolves trades on the opposite signal. Displays information on trade and its results. Also you can set virtual stop loss and take profit. Telegram channel for discation p
The cross-correlation indicator calculates the relationship between the specified pairs for the previous period. Automatically selects the instruments with the highest and the lowest correlation, and then simulates trading on the selected pairs on the same test period. Then indicator displays the pairs that have shown the best trading results. Visualizes the PAC (Pairs Arbitrage Correlation) criterion for the pairs selected by the trader. The signal to open trades is set by the PAC levels. When
EA trades pairs selected by correlation criterion. The choice is made in such a way that there are pairs with negative and neutral correlation to the main pair. The PAC indicator is used to automate the selection of pairs  https://www.mql5.com/en/market/product/41985 Expert is multycurrency, thus it is no use to test it in the MT4 terminal. So, watch for real signal and joing to telegram channel. After setting the pairs, the expert Advisor simulates trading for the previous period with visualiz
Simplified release of PACman EA. Expert is multycurrency, thus it is no use to test it in the MT4 terminal. So, watch for real signal and joing to telegram channel. After setting the pairs, the expert Advisor simulates trading for the previous period with visualization of the results. The user can interactively change the signal levels and observe their impact on the simulation result. In this way, you can select the optimal level values. By manually moving the vertical boundary lines to the ri
Simple and fast trade duplicator that copies trades on the same account with the reverse function. The reverse can be used for locking. You can choose to duplicate transactions for the current or all instruments.  Parameters Duplicate in reverse - the direction of duplication; Duplicate symbol - duplicate the selected tool; Manual lot size - hand size of the volume; Do not duplicate if spread > - do not duplicate a trade if the current spread is larger; List of magic to be duplicated - filte
Indicator shows the price history. The history is read for vertical lines and output for the main line. Those lines are the time cursors. You can use the indicator to analyze the price cycle over time, thereby predicting its movement. The duration of the forecast and the number of time cursors can be set in the indicator parameters. Additionally, you can link the main line to a new bar. Lines can be moved manually. Analyze the cyclical nature of the market using this indicator. Indicator para
This expert Advisor uses the saved trading history to repeat trades in the strategy tester. Meanwhile you can set other values for take profit, stop loss, and closing time. Thus, you can check how the results of trading with other parameters would look like. The best set of parameters can be obtained using the strategy optimizer in the MT4 terminal. In addition, you can find out how the results of trading would be affected by the later opening of trades when the price went to the loss side. You
フィルタ:
Matthew Todorovski
13132
Matthew Todorovski 2018.06.12 16:28 
 

ユーザーは評価に対して何もコメントを残しませんでした

レビューに返信