Currency Progression Meter

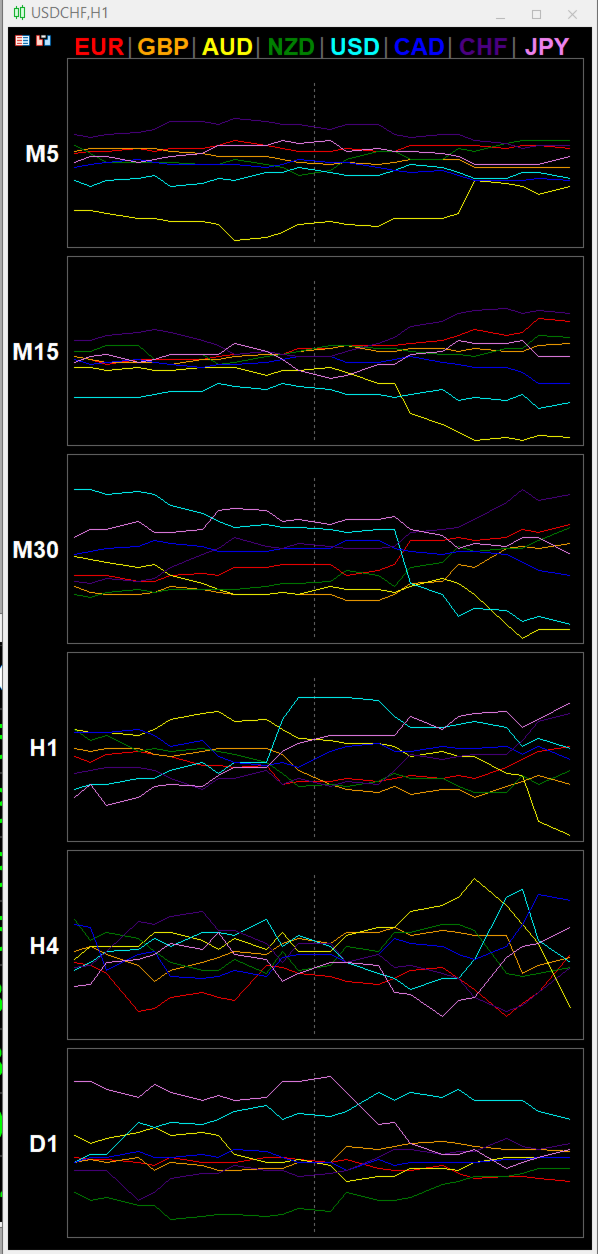
is a multi-timeframe visual matrix that tracks the relative linear progression (log-return strength) of the eight major currencies — EUR, GBP, AUD, NZD, USD, CAD, CHF, and JPY — across selected timeframes in a single responsive panel.

Motive

Traders often struggle to quickly see which currencies are gaining or losing strength relative to one another across multiple timeframes. This indicator condenses that information into color-coded progression lines so you can immediately identify strong versus weak currencies and align your pair selection and direction with the dominant force.

Functionality

For every enabled timeframe the indicator:

  • Scans available broker symbols for every unique pair combination among the eight currencies (direct or inverse).
  • Calculates the logarithmic return of each pair over the defined lookback period (LinearLookback).
  • Assigns the movement positively to the base currency and negatively to the quote currency.
  • Averages the results and centers them so the eight currencies sum to approximately zero.
  • Plots the last LinePoints values of each currency as a continuous colored line inside its timeframe cell.

A vertical zero line marks the neutral point. Currencies above zero are relatively strong; currencies below zero are relatively weak. The classic rule of thumb is: buy the strong currency against the weak currency.

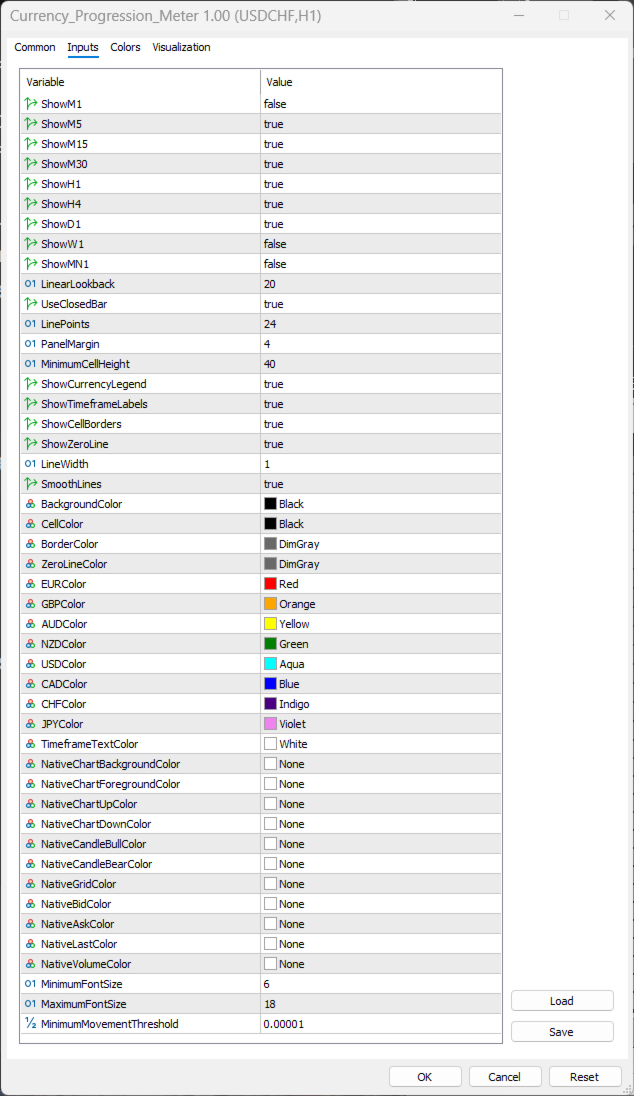
The panel is fully responsive. Cell height, font size, and spacing automatically adapt to chart size. You can toggle individual timeframes, the currency legend, timeframe labels, cell borders, and the zero line. Native chart elements are suppressed so the matrix occupies the full chart area cleanly.

Benefits for the Trader

  • Instant multi-timeframe currency strength overview without switching charts or using multiple indicators.
  • Clear visual separation of strong and weak currencies helps filter high-probability pair combinations.
  • Historical progression lines show whether strength is accelerating, decelerating, or reversing.
  • Customizable colors, line width, and visual elements make the display easy to read under different lighting and monitor setups.
  • Lightweight object-based drawing that updates only when data or chart dimensions change.

Limitations

  • Accuracy depends on the broker offering a sufficient number of the cross pairs. Missing symbols reduce the number of inputs used for that currency.
  • The calculation is a relative linear progression over a fixed lookback, not a volume-weighted or session-based strength index.
  • On very low timeframes (M1/M5) with a large number of line points and many enabled timeframes, object count rises and redraws can become heavier.
  • The indicator is designed for the eight listed currencies only; exotic or emerging-market currencies are not included.
  • Results are sensitive to the chosen lookback length and whether closed or forming bars are used.

Recommended Use

Enable the timeframes you actively trade, set LinearLookback to match your style (shorter for scalping, longer for swing), and watch for alignment: a currency that is positive and rising on several higher timeframes while its counterpart is negative and falling offers a higher-probability directional bias.

The indicator is intended as a decision-support tool. Always confirm signals with price action, structure, and your own risk rules.
추천 제품
Apex Point
Marco Engstermann
Apex Point is a trend-following indicator for MetaTrader 5, transforming complex market data into signals for traders. It displays blue dots for uptrends, red dots for downtrends, and yellow crosses at potential reversals, helping users identify momentum shifts quickly. Key features include a confirmation system requiring multiple bars (default: 3) to validate changes, reducing false signals; dynamic ATR-based offsets for adaptive trailing, with instant ratcheting in the trend direction and smo
FREE
Gold Venamax MT5
Sergei Linskii
3.5 (2)
Gold Venamax - 이것은 최고의 주식 기술 지표입니다. 지표 알고리즘은 자산의 가격 변동을 분석하고 변동성과 잠재적 진입 영역을 반영합니다. 표시기 기능: 이것은 편안하고 수익성 있는 거래를 위한 매직과 두 개의 추세 화살표 블록을 갖춘 슈퍼 지표입니다. 블록 전환을 위한 빨간색 버튼이 차트에 표시됩니다. 매직은 표시기 설정에서 설정되므로 서로 다른 블록을 표시하는 두 개의 차트에 표시기를 설치할 수 있습니다. Gold Venamax는 서로 다른 화살표 버퍼(GV 및 SD)를 사용하여 두 개의 차트에 배치할 수 있습니다. 이렇게 하려면 설정에서 다른 Magic을 선택해야 합니다. 예를 들어 하나는 Magic = 999이고 다른 하나는 Magic = 666입니다. 다음으로 차트의 빨간색 버튼으로 화살표 버퍼를 선택할 수 있습니다. 지표 설정의 각 화살표 버퍼(GV 및 SD)에는 편안하고 수익성 있는 거래를 위한 별도의 화살표 필터가 있습니다(UseFiltrGV = true;
MarketPro toolkit
Johannes Hermanus Cilliers
Start earning profits by copying All trades are sent by our successful Forex trader & are extremely profitable. You can earn profits by copying trades daily Trial Period included You'll also get access to extremely powerful trading education which is designed in a simple way for you to become a profitable trader, even if you have no trading experience. https://ec137gsj1wp5tp7dbjkdkxfr4x.hop.clickbank.net/?cbpage=vip
FREE
표시기는 현재 시세를 작성하여 과거 시세와 비교할 수 있으며 이를 바탕으로 가격 변동을 예측합니다. 표시기에는 원하는 날짜로 빠르게 이동할 수 있는 텍스트 필드가 있습니다. 옵션: 기호 - 표시기가 표시할 기호 선택. SymbolPeriod - 지표가 데이터를 가져올 기간 선택. IndicatorColor - 표시기 색상. HorisontalShift - 지시자가 그린 따옴표를 지정된 막대 수만큼 이동합니다. Inverse - true는 인용 부호를 반대로, false - 원래 보기를 반전합니다. ChartVerticalShiftStep - 차트를 수직으로 이동합니다(키보드의 위/아래 화살표). 다음은 날짜를 입력할 수 있는 텍스트 필드의 설정으로, '엔터'를 누르면 즉시 이동할 수 있습니다.
Modern Dark Chart Theme for MT5 Upgrade your MetaTrader 5 chart into a clean, dark, professional trading workspace. Your chart is your trading office. It is where you analyze the market, test Expert Advisors, review setups, record videos, share screenshots, and make trading decisions. If your MT5 chart looks old, bright, noisy, or unprofessional, your trading environment can feel distracted before you even start your analysis. Modern Dark Chart Theme for MT5 helps you create a cleaner, darker,
FREE
TrendVision AI
Murtadha Majid Jeyad Al-Khuzaie
TrendVision AI – Smart Trend Channels & Price Forecasting for MetaTrader 5 Discover market structure and explore potential future price direction with TrendVision AI, an advanced technical indicator for MetaTrader 5 that combines automatic trendline analysis with a machine-learning-based price forecasting model. How Does TrendVision AI Work? TrendVision AI analyzes historical candlestick data within a configurable lookback window. It automatically draws two trendlines directly on the chart:
FREE
Price Magnet — Price Density and Attraction Levels Indicator Price Magnet is a professional analytical tool designed to identify key support and resistance levels based on statistical Price Density. The indicator analyzes a specified historical period and detects price levels where the market spent the most time. These zones act as “magnets,” attracting price action or forming a structural base for potential reversals. Unlike traditional Volume Profile tools, Price Magnet focuses on price-time d
GDS Renko Pip ST Chart - Pip-Based Renko Chart Indicator for MetaTrader 5 GDS Renko Pip ST Chart is a pip-based Renko chart indicator for MetaTrader 5. It helps traders build and study cleaner Renko price movement using a practical fixed pip or point-based brick structure. This tool is designed as a Renko chart foundation for manual analysis. It does not predict the market, does not generate buy or sell signals and does not decide whether a trade should be opened. Renko EDGE EA Golden Delta | A
PositionMap Pro — Account Overview Panel for MT5 A real-time panel that groups all open positions by symbol and shows Buy lots, Sell lots and net profit/loss directly on your chart — the whole account at a glance. Instead of counting lots symbol by symbol in the Terminal tab, PositionMap Pro groups everything automatically. You instantly see how much exposure you have on each symbol, split by direction. Panel example Symbol Buy Lot Sell Lot Net P/L EURUSD 0.50 — +12.30 XAUUSD — 1.00 −45.00 GBPUS
FREE
Aroon Trend
Adrian Lara Carrasco
Aroon 지표 - 완전 설명 Aroon 지표 — 개념과 활용법 Aroon 지표는 트렌드의 강도, 시작 시점, 그리고 추세의 약화를 파악하기 위해 설계된 기술 분석 도구입니다. 이 지표는 Aroon Up 과 Aroon Down 두 개의 선으로 구성되며, 가격이 마지막으로 고점 또는 저점을 기록한 이후의 시간을 기반으로 계산됩니다. Aroon Up 이 100 근처에서 유지되고 Aroon Down 이 낮게 유지될 경우 강한 상승 추세로 해석됩니다. 반대로 높은 Aroon Down 수치는 강한 하락 추세를 의미합니다. Aroon 지표는 추세 추종, 돌파 전략, 스윙 트레이딩에 매우 효과적입니다. Aroon 지표가 제공하는 신호 추세 전환의 조기 감지 현재 추세 강도의 확인 횡보 구간 식별 추세 약화의 징후 포착 돌파 전략 보조 신호 Darwinex Zero 할인 코드 아래의 20% 할인 코드 를 사용하세요: DWZ2328770MGM_20 회원가입 또는 결제 화면에 입력하면 할인이 적용됩니
FREE
FibRetrace Zones 최근 스윙 구간의 피보나치 되돌림 영역 FibRetrace Zones는 FibRetrace EA의 무료 시각화 보조 지표입니다. 피보나치 되돌림 수준을 그리고 최근 스윙 구간의 눌림 영역을 강조하여, 거래 전에 진입 위치를 확인할 수 있습니다. 영역은 방향에 따라 색상이 지정됩니다. 상승 셋업은 녹색, 하락 셋업은 빨간색. 모든 심볼과 모든 타임프레임에서 작동합니다. 주요 기능 조정 가능한 룩백으로 자동 스윙 감지 클래식 피보나치 수준(23.6%, 38.2%, 50%, 61.8%, 78.6%), 각각 개별 설정 가능 색상 설정 가능한 눌림 영역 강조 방향별 색상: 녹색 = 상승, 빨간색 = 하락 봉 마감 시 확정, 형성 중인 봉의 실시간 갱신 옵션 사용 방법 아무 차트에나 적용하세요. 가격이 색상 영역으로 되돌아오는 곳이 바로 FibRetrace가 진입을 찾는 위치입니다. 피보나치 선을 이용해 직접 지정가 주문을 넣을 수 있습니다. 자동화 FibRetr
FREE
LT Rainbow Trend
Thiago Duarte
5 (1)
== LT RAINBOW TREND - 36개의 이동평균선을 탑재한 추세 지표 == 개요 LT Rainbow Trend는 스마트 컬러 시스템(Rainbow)을 적용하여 36개의 이동평균선(Moving Averages)을 동시에 처리하는 고급 기술적 추세 분석 지표입니다. 최고의 시각적 명확성을 바탕으로 주 추세 방향으로 거래하고자 하는 트레이더를 위해 개발되었으며, 멀티 타임프레임 분석의 복잡함을 심플하고 다채로우며 매우 직관적인 시각 효과로 전환해 줍니다. "추세는 당신의 친구(The trend is your friend)"라는 격언을 이해하는 트레이더에게 가장 이상적인 도구이며, 추세의 강도, 방향 및 잠재적 반전 신호를 미리 확인할 수 있도록 도와줍니다. 작동 원리 본 지표는 4개의 추세 구역에 분산된 36개의 이동평균선을 모니터링합니다: 빨간색 (추세 전환 구역) 31~20번째 이동평균선 추세가 반전될 수 있음을 나타내는 강한 신호 주황색 (추세 약화 구역)
Donchian Breakout And Rsi
Mattia Impicciatore
4.5 (2)
개요 이 지표는 클래식 돈치안 채널(Donchian Channel) 의 향상된 버전으로, 실전 트레이딩을 위한 다양한 기능이 추가되었습니다. 표준 세 개의 선(상단, 하단, 중앙선) 외에도 브레이크아웃 을 감지하여 차트에 화살표로 시각적으로 표시하며, 차트를 깔끔하게 보기 위해 현재 추세 방향의 반대 라인만 표시 합니다. 지표 기능: 시각적 신호 : 브레이크아웃 시 컬러 화살표 표시 자동 알림 : 팝업, 푸시 알림, 이메일 RSI 필터 : 시장의 상대 강도를 기반으로 신호 검증 사용자 맞춤 설정 : 색상, 선 두께, 화살표 코드, RSI 임계값 등 동작 원리 돈치안 채널은 다음을 계산합니다: 상단선 : 최근 N개의 종가 완료 캔들에서 가장 높은 고가 하단선 : 최근 N개의 종가 완료 캔들에서 가장 낮은 저가 중앙선 : 고가와 저가의 평균값 상방 브레이크아웃 은 종가가 상단선을 돌파할 때 발생하며, 하방 브레이크아웃 은 종가가 하단선 아래로 내려갈 때 발생합니다. 이 지표는: 세 개의
FREE
GOM Trade Manager
Wannapach Chinnaprapa
GOM Trade Manager helps you execute trades the way you want it. Works on all instruments Forex, Commodities, & Crypto. It helps you with lot calculations, spread addition and balance calculations so you can just focus on actual trading. For full automatic planned management, stackable triggers and spread widening protection >> check out GOM Trade Manager Pro . ------------------------------------------NOTABLE FEATURES------------------------------------------ You set everything based on bid
FREE
GDS Renko Pip ST - Fixed Brick Renko Chart Tool for MetaTrader 5 GDS Renko Pip ST is a Renko chart tool for MetaTrader 5 designed for traders who want to build and study fixed brick Renko movement using a practical pip or point-based setup. The purpose of this tool is simple: create a cleaner Renko structure so the trader can observe direction, brick runs, pullbacks, support and resistance behavior without normal candle noise. This is not a signal indicator and it does not predict the market. It
Moving Spread
Jose Maria Molina Sanchez
Moving Spread – 실시간 시장 비용 모니터 평균 스프레드를 실시간으로 모니터링하고 고비용 기간의 거래를 피하세요. 이 지표의 기능 Moving Spread 는 시간이 지남에 따라 시장의 평균 스프레드(포인트 단위) 를 측정하여 그 변동을 보여줍니다. 이는 진입 비용이 너무 높을 때를 파악하는 데 필수적인 도구입니다. 이러한 상황에서는 거래 시작 전에 이미 수익이 줄어들 수 있습니다. 왜 이것이 중요한가요? 높은 스프레드는 시장 진입 및 청산 시 더 많은 비용을 지불한다는 것을 의미합니다. 이 지표는 이러한 순간을 식별하고 비용이 과도할 때 거래를 피하는 데 도움을 줍니다. 작동 방식 별도의 창에서 현재 스프레드를 표시 하며, 평균값을 나타내는 빨간색 선이 있습니다. 스프레드가 정의된 임계값(예: > 0)을 초과하면 자동 알림 을 제공합니다. 스캘퍼 및 당일 트레이더에게 이상적 이며, "블리딩"(지속적인 손실)로 인한 숨겨진 손실을 방지하는 데 도움이 됩니
FREE
The Horizontal Ray Tool is a lightweight, professional charting utility designed to streamline support and resistance mapping on MetaTrader 5. It brings rapid, one-click horizontal level placement directly to your live chart, eliminating the workspace clutter associated with infinite horizontal lines or manually drawn trendlines. Key Features: Interactive On-Screen Button: Spawns a clean, responsive "DRAW RAY" button docked directly on your chart canvas. A single click drops an independent hor
FREE
Deviation Trend Profile Overview Deviation Trend Profile is a MetaTrader 5 chart indicator that combines three visual layers in a single chart window: a moving average with momentum-based coloring, deviation bands calculated from volatility, and a horizontal distribution profile drawn to the right of the current price. The indicator is an analytical tool. It does not open, modify or close trades, and it is not a complete trading system. It is designed to help the user observe trend direction, mo
FREE
High Low Open Close
Alexandre Borela
4.98 (45)
이 프로젝트를 좋아한다면 5 스타 리뷰를 남겨주세요. 이 지표는 열리고, 높은, 낮은 및 마감 가격을 지정합니다. 기간과 그것은 특정한 시간대를 위해 조정될 수 있습니다. 이들은 많은 기관 및 전문가에 의해 보는 중요한 수준입니다 상인은 당신이 더 많은 것일 수있는 장소를 알고 도움이 될 수 있습니다 이름 * 사용 가능한 기간: 이전 날. 이전 주. 지난 달. 이전 분기. 이전 연도. 또는: 현재 날. 현재 주. 현재 달. 현재 분기. 현재 년.
FREE
Volatility Ratio Mt5
Noiros Tech
5 (2)
YOU CAN NOW DOWNLOAD FREE VERSIONS OF OUR PAID INDICATORS . IT'S OUR WAY OF GIVING BACK TO THE COMMUNITY ! >>>    GO HERE TO DOWNLOAD The   Volatility Ratio   was developed by Jack D. Schwager to identify trading range and signal potential breakouts. The volatility ratio is defined as the current day's true range divided by the true range over a certain number of days N (i.e. N periods).  How to Use Volatility Ratio The use of a volatility ratio helps to identify situations where the price of
FREE
Order Book, known also as Market Book, market depth, Level 2, - is a dynamically updated table with current volumes of orders to buy and to sell specific financial instument at price levels near Bid and Ask. MetaTrader 5 provides the means for receiving market book from your broker, but in real time only, without access to its history. The indicator OrderBook Cumulative Indicator accumulates market book data online and visualizes them on the chart. In addition, the indicator can show the market
RSI Currency Strength Meter is a powerful and elegant multi-currency indicator that measures the real-time relative strength of the 8 major currencies using RSI logic. By calculating the smoothed performance of each currency across its major pairs and applying the RSI formula, it delivers clean and responsive strength lines that make it easy to spot which currencies are truly strong or weak at any moment. This indicator is particularly useful for visualizing currency correlations and divergence
INTRODUCING MML Data Bridge The demand for bridging external data and machine learning with trading platforms is higher than ever. MetaTrader 5 is a powerful environment for trading and back testing, but without a data bridge, MT5 is largely isolated from using any external data. MML Bridge is a developer tool that allows users to bridge external data into MT5 for back testing, live trading, and optimization. It's built for ease of use, providing users with a simple function API that drip-feeds
FREE
Mirror Chart MT5
Andrej Hermann
5 (1)
The Mirror Chart MT5 is a overlay indicator specifically designed to project a second financial instrument directly onto the main chart window. This tool is invaluable for traders who rely on correlation analysis, as it visualizes the price movements of two different instruments in real time. Unlike traditional overlays, this indicator utilizes intelligent, dynamic centering and scaling logic. It continuously analyzes the visible price range in the current window for both symbols and calculates
FREE
CosmiCLab FIBO
Kirils Subins
CosmiCLab SMC FIBO CosmiCLab SMC FIBO is a professional trading indicator designed for traders who use Smart Money Concepts (SMC), market structure analysis and Fibonacci retracement levels. The indicator automatically detects market swings and builds Fibonacci levels based on the latest impulse movement. It also identifies market structure changes such as BOS (Break of Structure) and CHOCH (Change of Character), helping traders understand the current market direction. CosmiCLab SMC FIBO also pr
The Dynamic Market Profile allows you to analyze the volume of any specific chart region manually and instantly. No more being restricted to fixed daily or weekly profiles: you choose the exact move, consolidation, or trend leg you want to analyze . The indicator lets you draw up to 5 independent areas at the same time using interactive rectangles . How It Works on a Daily Basis Create the zone: Press keys 1, 2, 3, 4, or 5 on your keyboard (or use the on-screen buttons) to plot a rectangle . A
FREE
RatingMeter
Evgeniy Zhdan
Rating Meter: 26개 지표를 하나의 종합 레이팅으로 Rating Meter 는 인기 있는 26개 지표의 신호를 자동으로 계산해 "매도 / 중립 / 매수"라는 간단한 레이팅으로 종합해 줍니다. 지표 창을 하나하나 열어 수치를 직접 비교할 필요가 없습니다. 패널을 한 번만 보면 선택한 시간대에서 시장이 어느 쪽으로 기울어 있는지 알 수 있습니다. Our products: https://www.mql5.com/en/users/trendhunter/seller 패널에 표시되는 내용 Oscillators 게이지: 11개 오실레이터 그룹의 레이팅입니다. RSI, Stochastic, CCI, ADX, Awesome Oscillator, Momentum, MACD, Stochastic RSI, Williams %R, Bulls/Bears Power, Ultimate Oscillator가 포함됩니다. Moving Averages 게이지: 15개 추세 지표 그룹의 레이팅입니다. 기간 10
FREE
Fabii Half Trend Baseline
Fabien Georges Andre Guillemaud
상위 시간대 추세에 맞서는 거래를 멈추세요. 기준선 두 개, 차트 하나. 리페인트 없음. 모든 통화쌍, 모든 시간대. 2분 안에 차트에 적용. Strategy Tester에서 무료 데모를 사용해 볼 수 있습니다. Get more indicators here Baselines, volatility filters and oscillators. No repaint. 필요한 이유 차트의 선이 초록색으로 바뀌어서 진입합니다. 그런 다음 상위 시간대를 열어 보니 더 큰 추세는 반대 방향입니다. 신호는 진짜였습니다. 하지만 그 뒤의 추세는 당신 편이 아니었습니다. 더 큰 추세에 맞서는 거래는 그때마다 진입의 우위를 깎습니다. 제공하는 것 Fabii Half Trend Baseline은 현재 시간대의 추세와 상위 시간대의 추세를 한 차트에 보여 주므로, 창을 바꿔 가며 큰 그림을 확인할 필요가 없습니다. 상위 시간대의 두 번째 기준선이 메인 선 뒤에 그려져서, 다른 차트를 열지 않고도 더 큰
Premium level Pro
Dmitriy Kashevich
Premium level is a unique indicator with more than 80% accuracy of correct predictions! This indicator has been tested for more than two months by the best Trading Specialists! The author's indicator you will not find anywhere else! From the screenshots you can see for yourself the accuracy of this tool! 1 is great for trading binary options with an expiration time of 1 candle. 2 works on all currency pairs, stocks, commodities, cryptocurrencies Instructions: As soon as the red arrow app
Hourly Spread Map
Vasilii Makarenko
Hourly Spread Map answers one question: at which hours does this symbol cost more to enter, and by how much. It reads the spread field that the terminal stores in every closed M1 bar of your own broker feed, sorts those measurements into 24 hours by 7 days of the week, and shows the result as a grid in the indicator sub-window. What It Measures Every closed M1 bar carries one spread measurement. The indicator collects them over the period you choose, groups them by the hour and weekday of the ba
FREE
이 제품의 구매자들이 또한 구매함
Trade Assistant MT5
Evgeniy Kravchenko
4.43 (216)
거래당 위험 계산, 라인을 사용한 손쉬운 신규 주문, 부분 청산 기능을 통한 주문 관리, 7가지 유형의 트레일링 스탑 및 기타 유용한 기능을 제공합니다. 추가 자료 및 지침 설치 지침   -   애플리케이션 지침   -   데모 계정용 애플리케이션 평가판 라인 기능       - 차트에 개시선, 손절매, 차익실현을 표시합니다. 이 기능을 사용하면 새로운 주문을 쉽게 하고 개봉 전에 추가 특성을 볼 수 있습니다. 위기 관리       -       위험 계산 기능은 설정된 위험과 손절매 주문의 크기를 고려하여 새 주문의 볼륨을 계산합니다. 이를 통해 손절매 크기를 설정하고 동시에 설정된 위험을 존중할 수 있습니다. 로트 계산 버튼 - 위험 계산을 활성화/비활성화합니다. 필요한 위험 값은 위험 필드에 0에서 100 사이의 백분율 또는 예금 통화로 설정됩니다. 설정 탭에서 위험 계산 옵션을 선택합니다. $ 통화, % 잔액, % 지분, % 자유 마진, % 사용자 정의, % AB 이전
Trade Manager EA에 오신 것을 환영합니다. 이 도구는 거래를 보다 직관적이고 정확하며 효율적으로 만들기 위해 설계된 궁극적인 리스크 관리 도구 입니다. 단순한 주문 실행 도구가 아닌, 원활한 거래 계획, 포지션 관리 및 리스크 제어를 위한 종합 솔루션입니다. 초보자부터 고급 트레이더, 빠른 실행이 필요한 스캘퍼에 이르기까지 Trade Manager EA는 외환, 지수, 상품, 암호화폐 등 다양한 시장에서 유연성을 제공합니다. Trade Manager EA를 사용하면 복잡한 계산은 이제 과거의 일이 됩니다. 시장을 분석하고 진입, 손절 및 익절 수준을 차트의 수평선으로 표시한 후 리스크를 설정하면, Trade Manager가 이상적인 포지션 크기를 즉시 계산하고 SL 및 TP 값을 실시간으로 표시합니다. 모든 거래가 간편하게 관리됩니다. 주요 기능: 포지션 크기 계산기 : 정의된 리스크에 따라 거래 크기를 즉시 결정합니다. 간단한 거래 계획 : 진입, 손절, 익절을 위한
Local Trade Copier EA MT5
Juvenille Emperor Limited
4.94 (149)
Local Trade Copier EA MT5는 동일한 Windows 컴퓨터 또는 Windows VPS에서 여러 MetaTrader 5 계정 간에 거래를 복사하고 관리할 수 있는 빠르고 유연한 거래 복사기입니다. 로컬 거래 동기화 기능과 함께 Receiver 측에서 로트 크기, 리스크 관리, 거래 필터링, 심볼 매핑, 거래 관리 및 계정 보호를 독립적으로 설정할 수 있습니다. Transmitter와 Receiver 터미널을 약 1분 안에 설정하고, 동일한 브로커 또는 서로 다른 브로커의 계정 간에 수동 거래 또는 EA 거래를 복사할 수 있습니다. 적절한 조건에서는 로컬 MetaTrader 터미널 간의 거래 정보가 0.5초 이내 에 동기화될 수 있습니다. 실제 체결 속도는 브로커 지연 시간, 네트워크 상태, 컴퓨터/VPS 성능 및 터미널 부하에 따라 달라집니다. 구매 전에 무료 데모를 사용해 보세요 MT5 데모 계정에서 Local Trade Copier EA MT5의 모든 기능을
Telegram to MT5 Multi-Channel Copier   는 Telegram 및 Discord 채널의 트레이딩 시그널을 MetaTrader 5로 자동 복사합니다. 봇도, 브라우저 확장도, 수동 복사도 필요 없습니다. Telegram이나 Discord에 시그널이 도착하면 EA가 몇 초 안에 터미널에서 주문을 실행합니다. 그리고 채널을 복사하기 전에, 내장 백테스터가 그 채널이 내 계좌에서 어떤 결과를 냈을지 보여줍니다. 제품은 두 가지 구성 요소로 이루어집니다: Telegram 채널을 수신하는 Windows 애플리케이션과, MT5 터미널에서 시그널을 실행하는 본 EA입니다. MT4 버전도 제공됩니다   여기 . 설정 가이드와 앱 다운로드:   https://www.mql5.com/en/blogs/post/768988 텔레그램 시그널 채널을 백테스트하는 방법 을 확인하세요. 현재 가격은 향후 인상될 예정입니다. 작동 방식 앱은 여러분 자신의 Telegram 계정으로 연결되므
================================================================================ POC BREAKOUT - V20.72. Full Professional Grade Toolkit ================================================================================ POC Breakout is a full MetaTrader 5 trading dashboard for discretionary traders who want breakout signals, Point of Control (POC) context, volume profiles, order flow, market structure, news, alerts, and advanced trade planning in one professional workspace. Attached directly to you
Strategy Ledger Pro
Abdullah Uygar Tuna
5 (11)
이제 한국어로 이용할 수 있습니다. Strategy Ledger Pro 는 MetaTrader 5용 읽기 전용 계좌 분석 패널입니다. 계좌 성과를 전문가 어드바이저(EA), 전략, 심볼, 매직 넘버별로 나누어 각각이 실제로 얼마나 기여하는지 보여줍니다. 패널은 11개 언어를 지원합니다: English, Français, Deutsch, Español, Italiano, Português, Русский, Türkçe, 中文, 日本語, 한국어. 데모를 다운로드하기 전에. Market은 모든 유료 제품의 데모를 전략 테스터에서만 실행합니다. 이 패널은 사용자 자신의 계좌 거래를 분석하는데, 전략 테스터에는 읽을 계좌 기록이 없으므로 데모는 빈 패널로 열리고 그 사실을 표시합니다. 이는 데모 방식에 따른 것이며 제품의 제약이 아닙니다. 이 설명의 동영상에서 실계좌에서 작동하는 패널을 확인할 수 있습니다. 모든 기능을 설명한 자세한 매뉴얼 (영문)과 토론 및 공지를 위한 AureusAI
TradePanel MT5
Alfiya Fazylova
4.88 (170)
Trade Panel은 다기능 거래 도우미입니다. 이 애플리케이션에는 50개 이상의 수동 거래 기능이 포함되어 있으며 대부분의 거래 작업을 자동화할 수 있습니다. 앱 사용 설명서: https://www.mql5.com/en/blogs/post/756482 데모 계정용 앱 체험판: https://www.mql5.com/en/blogs/post/750865 앱 설치 방법: https://www.mql5.com/en/blogs/post/756239 시각 모드에서 앱 테스트 방법: https://www.mql5.com/en/blogs/post/770277 VPS MetaTrader에 앱 설치 방법: https://www.mql5.com/en/blogs/post/770190 거래. 한 번의 클릭으로 거래를 수행할 수 있습니다: 리스크 자동 계산과 함께 예약 주문 및 포지션 열기. 한 번의 클릭으로 여러 주문 및 포지션 열기. 주문 그리드 열기. 예약 주문 및 포지션을 그룹별로 닫기. 포지션
The Patch
Mian Rameez Ali
The Patch It never opens a trade. It walks behind the ones that did. Every open position, every pending order — checked twice a second for the one thing that's easy to forget: a stop, a target. Found bare, it doesn't ask. It writes the missing number in, measured in points from wherever the position began, and moves on to the next. No strategy, no opinion on direction. Just the quiet assumption that nothing should ever sit on the market unprotected — not because someone decided it shouldn't,
내 거래 규칙에 맞춰 Telegram 신호 복사 Telegram to MT5 Signal Trader 는 공개 및 비공개 Telegram 채널과 그룹의 텍스트 기반 거래 신호를 MetaTrader 5로 자동 복사합니다. 하나의 데스크톱 앱에서 여러 신호 제공자와 MT5 계좌를 관리하고, 제공자마다 위험 관리 및 거래 설정을 개별적으로 지정 할 수 있습니다. 신호 복사에는 Telegram 봇이나 API 설정이 필요하지 않습니다. 전화번호 또는 QR 코드로 본인의 Telegram 계정에 로그인한 후, 이미 가입한 채널이나 그룹을 선택하면 됩니다. 봇을 만들거나 Telegram API 토큰, API ID 또는 API 해시를 입력할 필요가 없습니다. 포지션 크기를 선택하고, 여러 익절 목표에 청산 물량을 배분하며, 손익분기점 이동과 트레일링 스톱을 자동화하세요. 제공자의 신호를 따르면서도 실제 거래 방식은 직접 설정할 수 있습니다. 이 제품은 MT5 Expert Advisor와 필수 Win
Floor Watch
Syed Tauqeer Hussain Shah
Floor Watch One number, watched every thirty seconds: how far equity has fallen since the day began — or since its highest point, if it's told to trail the peak instead of the open. Cross the line and it doesn't argue. Every open position closes, every pending order vanishes, and anything that slips through afterward gets shut the moment it appears. Not asked. Removed. The floor holds until the clock turns 5 AM Pakistan time — then, and only then, does the day start over. One rule. No except
파워 캔들 전략 스캐너 - 자체 최적화 다중 종목 설정 찾기 도구 파워 캔들 전략 스캐너는 마켓 워치에 등록된 모든 종목에 대해 파워 캔들 지표와 동일한 자체 최적화 엔진을 동시에 실행합니다. 하나의 패널에서 현재 통계적으로 거래 가능한 종목, 각 종목별 최적의 전략, 최적의 손절매/익절 조합을 알려주며, 새로운 신호가 발생하면 즉시 알림을 전송합니다. 이 도구는 Stein Investments 에코시스템의 일부입니다. 18개 이상의 도구와 함께 당신의 1대1 AI 트레이딩 멘토 Max.  항상 대기 중, 모든 인디케이터를 깊이 있게 이해, 무언가를 차근차근 생각해보고 싶은 순간에 도움을 줍니다.  https://stein.investments 에서 만나보세요 완벽한 시장 모니터링. 종목당 3,000건 이상의 자동 최적화. 2가지 알림 유형. 한 번의 클릭으로 차트를 전환하고 바로 거래하세요. 이 도구가 필요한 이유 대부분의 다중 종목 스캐너는 가격 변동만 보여줍니다. 티커별
The product will copy all telegram signal to MT5 ( which you are member) , also it can work as remote copier.  Easy to set up, copy order instant, can work with almost signal formats, image signal,  s upport to translate other language to English Work with all type of channel or group, even channel have "Restrict Saving Content", work with  multi channel, multi MT5 Work as remote copier: with signal have ticket number, it will copy exactly via ticket number. Support to backtest signal. How to s
한 번 구매하면 현재 제공 중이거나 앞으로 출시할 제 모든 MT4 및 MT5 지표를 추가 비용 없이 받을 수 있습니다. 구매 후 수령 방법을 안내받으려면 저에게 연락해 주세요. 10회 구매마다 가격을 50$씩 인상하여 최대 999$ 까지 올릴 예정입니다. 결제 시점의 Market 가격이 적용됩니다. 신뢰하는 지표는 그대로 사용하고, 관련 작업을 자동화하세요. 당신의 신호. 당신의 규칙. 당신의 거래 실행. 신뢰하는 MT5 지표가 있지만 여전히 차트를 지켜보고, 신호를 기다리고, 랏을 계산하고, 주문을 넣고, 각 포지션을 직접 관리하고 계신가요? Stratiora Signal Engine MT5는 이러한 단계를 연결합니다. 호환되는 매수·매도 버퍼 신호를 진입, 거래량 계산, Stop Loss, Take Profit, 필터, 포지션 관리 및 계좌 보호까지 이어지는 자동화 과정으로 전환할 수 있습니다. 지표나 거래 아이디어를 바꿀 때마다 별도의 EA를 의뢰하는 대신, 하나의 유연한 엔
Quant AI Agents
Ho Tuan Thang
5 (1)
Quant AI Agents are independent trading Expert Advisors. Instead of trading using a fixed strategy like other conventional EAs, Quant AI Agents   is a   multi-agent AI trading framework   that turns natural-language strategy prompts into live.  WANT THE SAME RESULTS AS MY LIVE SIGNAL?   Use the exact same brokers I do:   IC MARKETS , IC TRADING   .  Unlike the centralized stock market, Forex has no single, unified price feed.  Every broker sources liquidity from different providers, creating un
Exp COPYLOT CLIENT for MT5
Vladislav Andruschenko
3.97 (35)
MetaTrader 5용 전문 트레이드 복사기 MetaTrader 용 빠르고 전문적이며 신뢰할 수 있는 트레이드 복사기 입니다. COPYLOT 은 MT4와 MT5 터미널 간의 Forex 거래 복사를 지원하며, Hedge 및 Netting 계좌를 모두 지원합니다. COPYLOT MT5 버전 지원 구성: - MT5 Hedge → MT5 Hedge - MT5 Hedge → MT5 Netting - MT5 Netting → MT5 Hedge - MT5 Netting → MT5 Netting - MT4 → MT5 Hedge - MT4 → MT5 Netting MT4 버전 전체 설명 + DEMO + PDF 구매 방법 설치 방법 로그 파일 확인 방법 테스트 및 최적화 방법 Expforex의 모든 제품 MT4 터미널로도 거래를 복사할 수 있습니다(MT4 → MT4, MT5 → MT4): COPYLOT CLIENT for MT4 COPYLOT은 2개, 3개, 심지어 10개의 터미널과 동시에 작동할
Welcome to ENTRY IN THE ZONE with SMC MULTI TIMEFRAME Entry In The Zone with SMC Multi Timeframe is a real-time market analysis tool based on Smart Money Concepts (SMC), designed to analyze market structure, price direction, and key trading zones. It supports both Single-Timeframe and Multi-Timeframe Analysis, providing a clearer view of overall market structure across multiple timeframes, with real-time BUY / SELL signals designed with a strict focus on No-Repaint principles.  The signals are d
Grid Manual MT5
Alfiya Fazylova
4.73 (22)
"Grid Manual"은 주문 그리드 작업을 위한 거래 패널입니다. 이 유틸리티는 보편적이며 유연한 설정과 직관적인 인터페이스를 제공합니다. 그것은 손실을 평균화하는 방향뿐만 아니라 이익을 증가시키는 방향으로 주문 그리드와 함께 작동합니다. 거래자는 주문 그리드를 만들고 유지할 필요가 없으며 유틸리티에서 수행합니다. 거래자가 주문을 시작하는 것으로 충분하며 "Grid Manual"는 자동으로 그를 위한 주문 그리드를 생성하고 거래가 마감될 때까지 그와 동행할 것입니다. 전체 설명 및 데모 버전 여기 . 유틸리티의 주요 기능: 모바일 터미널을 포함하여 어떤 방식으로든 열린 주문과 함께 작동합니다. "제한" 및 "중지"의 두 가지 유형의 그리드와 함께 작동합니다. 고정 및 동적(ATR 표시기 기반)의 두 가지 유형의 그리드 간격 계산과 함께 작동합니다. 오픈 오더 그리드의 설정을 변경할 수 있습니다. 차트에서 각 주문 그리드의 손익분기점 수준을 표시합니다. 각 주문 그리드에 대한 이익
Telegram To MT5 Ultra
Mirel Daniel Gheonu
5 (5)
Telegram To MT5 — 시그널 카피어 텔레그램 채널의 트레이딩 콜을 실제 MT5 주문으로 바꿔 드립니다 — 자동으로, 원하는 만큼의 계좌에서, 리스크와 규칙을 완전히 당신의 통제 아래 둡니다. Telegram To MT5는 이미 텔레그램에서 팔로우하고 있는 VIP / 시그널 채널을 당신의 MetaTrader 5 터미널에 연결합니다. 무료 동반 데스크톱 앱이 메시지를 읽고(봇을 차단하는 채널에서도 가능), 이 EA가 당신의 계좌에서 이를 실행합니다 — 당신만의 리스크 설정, 심볼 매핑, 익절(TP) 처리, 세션 및 뉴스 필터를 적용합니다. 이것은 블랙박스 전략이 아니라 시그널 카피어입니다. 어떤 채널을 신뢰할지, 각 거래의 수량과 관리 방식을 당신이 결정합니다. 단계별 설정 및 동반 앱 설치 가이드 작동 방식 [당신의 텔레그램 채널] -> [동반 데스크톱 앱] -> [MT5 + 이 EA] -> 주문 동반 데스크톱 앱(무료, 포함)은 당신의 텔레그램 계정으로 로그인하여 선택한
Signal TradingView to MT5 Pro Automator TradingView와 MetaTrader 5 간의 즉각적인 전문 실행 TradingView 알림과 MT5의 실제 실행을 연결하는 가장 강력한 커뮤니케이션 브리지로 거래 전략을 자동화하세요. 속도, 유연성 및 완벽한 위험 관리를 요구하는 트레이더를 위해 설계된 이 Expert Advisor는 모든 알림 메시지를 정확한 시장가 또는 지정가 주문으로 변환합니다. 강점 및 이점 범용 파싱 엔진(독점 기술): 모든 알림 형식에서 데이터를 자동으로 인식하고 추출할 수 있는 고급 기술입니다. 단일하고 엄격한 형식에 얽매일 필요가 없습니다. 시스템은 심볼, 액션, 가격, SL 및 TP를 자동으로 이해합니다. 실시간 실행: 지연 시간을 최소화하도록 최적화된 1초 미만의 초고속 폴링 기술. 신호 수신 후 몇 밀리초 내에 주문 실행이 이루어집니다. 기관 수준의 위험 관리: 다음 기준에 따른 자동적이고 정확한 로트(Lot) 크기 계
Trade Dashboard MT5
Fatemeh Ameri
4.94 (135)
Trade Dashboard simplifies how you open, manage, and control your trades, with built-in lot size calculation. It allows you to execute trades, manage risk, and control positions directly on the chart, with tools such as partial close, breakeven, and trailing stop. Designed to reduce manual work and help you stay focused on your trading decisions. A demo version is available for testing. Detailed explanations of features are provided within the MQL5 platform. Installation instructions are include
Seconds Chart MT5
Boris Sedov
4.61 (18)
Seconds Chart - MetaTrader 5에서 초 단위 차트를 생성하는 독특한 도구입니다. Seconds Chart 를 사용하면 초 단위로 설정된 타임프레임으로 차트를 작성할 수 있어, 표준 분 또는 시간 단위 차트에서는 불가능한 유연성과 정밀한 분석이 가능합니다. 예를 들어, S15 타임프레임은 15초 동안의 캔들로 구성된 차트를 의미합니다. 사용자 정의 심볼을 지원하는 모든 인디케이터와 전문가 어드바이저를 사용할 수 있습니다. 이를 사용하는 것은 표준 차트에서 거래하는 것만큼 편리합니다. 표준 도구와 달리, Seconds Chart 는 초고속 타임프레임에서도 높은 정확도와 지연 없이 작업할 수 있도록 지원합니다. 무료 데모: Seconds Chart v2.29 Demo.ex5 무료 데모를 다운로드하고 직접 확인하십시오: 완전한 기능 - 모든 기능 사용 가능 24시간 테스트 - 정확성과 편리성을 평가하기에 충분한 시간 데모 계정만 - 대부분의 브로커에서 쉽게 개설 가능
VirtualTradePad PRO SE MT5 — MetaTrader 5용 전문 트레이딩 컨트롤 센터 VirtualTradePad PRO SE 는 MetaTrader 5 용 프리미엄 차트 기반 트레이딩 패널이자 거래 관리 워크스페이스입니다. 더 빠른 주문 실행, 더 명확한 포지션 관리, 구조화된 거래 관리, 시각적인 레벨 계획, 그리고 차트에서 직접 작업하는 전문적인 워크플로를 원하는 트레이더를 위해 설계되었습니다. 이 제품은 단순한 BUY / SELL 패널이 아닙니다. PRO SE는 수동 트레이딩, 예약 주문, 포지션 관리, 부분 청산, 바스켓 손익 관리, 평균가 레벨, ATM 규칙, 신호 모니터링, 실시간 시장 정보, 전략 테스터 (Strategy Tester) 워크플로, VPS 중심 운용을 하나의 연결된 인터페이스로 통합합니다. MT4 버전 | 전체 설명 및 스크린샷 | 구입 방법 | 설치 방법 | 로그 파일을 얻는 방법 | 테스트 및 최적화 방법 | Expforex의 모든
FUTURES ORDERFLOW FOOTPRINT CHART Professional OrderFlow EA for MetaTrader 5 Version 1.01| Professional tool for real traders | Institutional-Grade Visualization STRATEGY TESTER USERS - PLEASE SELECT EVERY REAL TICK WHEN TESTING AND YOU HAVE DOWNLOADED HISTORICAL DATA. IF YOU SEE A WAITING SCREEN AND IT IS NOT DOWNLOADING, IT MEANS YOU HAVE LOW HISTORICAL DATA. TRY 1 MIN AND 5 MIN FIRST ON 1 DAY DATA. ONE DAY DATA SHOULD BE THE NEWEST AND MOST CURRENT DATE. PLEASE WAIT UNTIL THE MARKET HAS ROL
Anchor Trade Manager
Kalinskie Gilliam
5 (9)
Your EAs cannot see each other, but Anchor can. Anchor gives you one place to coordinate your EAs, manage risk, and decide when trading is allowed. It works alongside the trading bots you already use without any changes to them. The Problem One EA opens a trade. Then another starts trading. The next thing you know, you wake up to multiple grids built across your account. Each EA may be doing exactly what it was designed to do, but together they can place far more risk on your account than you in
HINN MagicEntry Extra
ALGOFLOW OÜ
4.74 (19)
HINN MAGIC ENTRY – the ultimate tool for entry and position management! SIMPLE. FASTEST. INTUITIVE. MAX AUTOMATED. Place orders by selecting a level directly on the chart! full description   ::  demo-version  :: 60-sec-video-description Key features: - Market, limit, and pending orders - Automatic lot size calculation - Automatic spread and commission accounting - Unlimited partitial take-profits  - Breakeven and trailing stop-loss and take-profit  functions - Invalidation leves - Intuitive, a
Trade copier MT5
Alfiya Fazylova
4.61 (57)
Trade Copier는 거래 계정 간의 거래를 복사하고 동기화하도록 설계된 전문 유틸리티입니다. 복사는 공급자의 계정/단말기에서 동일한 컴퓨터 또는 vps에 설치된 수신자의 계정/단말기로 발생합니다. 구매하기 전에 데모 계정에서 데모 버전을 테스트할 수 있습니다. 데모 버전 여기 . 전체 지침 여기 . 주요 기능 및 이점: 복사기는 "МТ5> МТ5", "МТ4> МТ5", "МТ5> МТ4" 복사를 지원합니다. 복사기는 데모 계정 > 실 계정, 실 계정 > 데모 계정, 데모 계정 > 데모 계정 및 실제 계정 > 실 계정 복사를 지원합니다. 복사기는 읽기 전용 암호가 적용된 투자자 계정에서 복사를 지원합니다. 하나의 공급자 터미널은 여러 수신 터미널로 트랜잭션을 보낼 수 있고 하나의 수신 터미널은 여러 공급자 터미널에서 트랜잭션을 수신할 수 있습니다. 복사기는 귀하 또는 귀하의 고문이 거래하는 동일한 터미널에서 작동할 수 있습니다. 높은 복사 속도(0.5초 미만). 복사기에는 간편
Daily Trading Limiter
AL MOOSAWI ABDULLAH JAFFER BAQER
5 (8)
• Please test the product in the Strategy Tester before purchasing to understand how it works. • If you face any issues, contact me via private message—I’m always available to help. • After purchase, send me a screenshot of your order to receive a FREE EA as a gift. Daily Trading Limiter — the rule you cannot break Every trader knows the number. Three trades. Two percent. One bad day and stop. And every trader has watched themselves take the fourth trade anyway. The problem was never knowing th
The News Filter MT5
Leolouiski Gan
4.78 (23)
이 제품은 뉴스 시간 동안 모든 전문가 어드바이저 및 수동 차트를 필터링하여 수동 거래 설정이나 다른 전문가 어드바이저가 입력한 거래가 파괴될 수 있는 급격한 가격 상승으로부터 걱정하지 않아도 됩니다. 이 제품은 또한 뉴스 발표 전에 열린 포지션과 대기 주문을 처리할 수 있는 완전한 주문 관리 시스템이 함께 제공됩니다.   The News Filter  를 구매하면 더 이상 내장 뉴스 필터에 의존할 필요가 없으며 이제부터 모든 전문가 어드바이저를 여기서 필터링할 수 있습니다. 뉴스 선택 뉴스 소스는 Forex Factory의 경제 캘린더에서 얻어집니다. USD, EUR, GBP, JPY, AUD, CAD, CHF, NZD 및 CNY와 같은 어떤 통화 기준으로 선택할 수 있습니다. Non-Farm (NFP), FOMC, CPI 등과 같은 키워드 식별을 기준으로 선택할 수도 있습니다. 저, 중, 고 영향을 가지는 뉴스를 필터링할 수 있도록 선택할 수 있습니다. 차트와 관련된 뉴스만 선
Premium Trade Manager - 코치가 내장된 트레이딩 패널 Premium Trade Manager 는 차트 안에 트레이딩 코치를 심어놓은 도구입니다. 주문을 확정하기 전에, AI 트레이딩 코치 Max가 설정된 거래를 직접 읽고 명확한 판단을 내려줍니다. 스톱이 규율 있는 접근 방식에 맞는지, 리스크 크기가 합리적인지, 고영향 뉴스 이벤트가 몇 분 후에 있는지, 프롭 펌 한도에 근접했는지. 그 아래에는 완전한 실행 엔진이 있습니다. 원클릭 리스크 기반 진입, 차트에서 드래그로 세우고 거래가 진행되는 동안에도 계속 움직일 수 있는 플랜, 최대 4단계 분할 익절, 7가지 트레일링 방식, 실시간 프롭 펌 컴플라이언스, 뉴스 가드, 그리고 자체 비용을 평가하는 스프레드까지. 결정은 당신이 내립니다. Max가 두 번째 시선으로 확인합니다. 패널이 그 이후의 모든 것을 처리합니다. 구매 전에 직접 체험해 보세요. 브라우저에서 라이브 패널을 직접 클릭해볼 수 있습니다. 구매 전에 실제
YuClusters
Yury Kulikov
4.93 (43)
Attention: You can view the program operation in the free version  YuClusters DEMO .  YuClusters is a professional market analysis system. The trader has unique opportunities to analyze the flow of orders, trade volumes, price movements using various charts, profiles, indicators, and graphical objects. YuClusters operates on data based on Time&Sales or ticks information, depending on what is available in the quotes of a financial instrument. YuClusters allows you to build graphs by combining da
제작자의 제품 더 보기
Volatility Atlas
Abraham Correa
motive is to turn market volatility and selected time/session reference points into a visual price grid . Instead of claiming to predict price direction, it gives the trader a structured way to judge where current price sits relative to ATR-derived or fixed-distance ranges. Potential Volatility awareness: ATR-based spacing expands and contracts with measured price volatility. Price-range context: Multiple grid levels show how far price has traveled from a reference point. Session analysis: The f
FREE
Quote Cost Parity is  a MetaTrader 5 chart panel for forex majors and minors that share a quote currency. Pairs with the same quote have the same pip cost for a given lot. The indicator uses that correspondence directly: it calculates the cost once for the group, then shows that cost for three lot sizes. It acknowledges only these quote groups. JPY: USDJPY, EURJPY, GBPJPY, AUDJPY, NZDJPY, CADJPY, CHFJPY. Source: USDJPY. CHF: USDCHF, EURCHF, GBPCHF, AUDCHF, NZDCHF, CADCHF. Source: USDCHF. CAD: US
FREE
Synchronizes all open charts to the symbol of the chart this indicator is applied to. SyncAllCharts is a MetaTrader 5 indicator that lets one main chart control the trading symbol shown on all other open charts. Change the symbol on the main chart, and the other charts follow while keeping their own timeframes. It helps you review the same market across several timeframes without changing each chart manually. How to use it Attach the indicator to one chart that you want to use as the main contr
FREE
is designed to simplify switching between trading instruments directly from the active chart. It allows traders to cycle through symbols listed in the broker's Market Watch using on-chart navigation buttons or keyboard arrow keys . The indicator's primary motive is to make multi-symbol market analysis faster, more convenient, and more organized by reducing the need to manually locate and open individual charts. Key Features Previous / Next Navigation: Switch between Market Watch symbols using t
FREE
Displays broker-provided LONG and SHORT swap values for selected instruments in a full-chart, dynamically sized table. The Swaps Monitor Table provides a simple way to view the swap rates supplied by your broker for multiple trading instruments at once. The table can display instruments from Market Watch, all available instruments, or a manually selected list , allowing traders to monitor swap costs without opening each symbol individually. The indicator automatically adjusts the table cells an
FREE
is a panel that groups FX Major & Minor quote currencies and shows the shared pip or point cost of a trade. View that cost for three fixed lot sizes or three account-balance risk percentages. Currency Cost Constellation is a MetaTrader 4 chart panel for forex majors and minors that share a quote currency. Pairs with the same quote have the same pip cost for a given lot. The indicator uses that correspondence directly: it calculates the cost once for the group, then shows that cost for three lo
FREE
is a visual market-monitoring indicator that displays multiple trading instruments and timeframes within a single chart window. Developed using MQL5, the indicator transforms historical price data into a structured dashboard featuring custom candlesticks or price dots. Each row represents a symbol, while each column represents a selected timeframe. This arrangement allows traders to examine recent market behavior across several instruments and timeframes without continually opening and closing c
FREE
Market Watch's Symbols,  Lot Sizing choice,  Spread, & Price are shown. The app is visually customizable. Click on any Symbol for interaction with its chart!   Trader Market Watch is a display-only MetaTrader 5 board. It fills the chart tab with the symbols already in Market Watch and does not place or modify orders. Each row shows the symbol, the spread in pips, and the price. Two lot columns sit beside them: the lot size that uses your chosen percent of balance as margin, and the largest
FREE
Automated Timeframe cycling with Symbols centered.  Force every timeframe onto one clock window, so the story you see on Daily is the same story you are slicing on H4, H1, and M1.  Traders usually flip timeframes and lose the span. A Daily chart shows a few weeks, then M15 shows a few hours, and the eye treats them as different markets. TASSERACT locks the window to N bars of the highest enabled timeframe — default 10 Daily — and maps every lower timeframe to that same stretch. You stay inside o
FREE
is an on-chart pre-trade planner for the symbol on that chart. It clears the price and time scales and fills the tab with a live reading of this account against this symbol: spread, pip value, point value, an ATR stop, three ATR targets, and ten lot sizes sized from a percent of balance. Targets are reduced by the live spread. The stop is increased by it. Commission and planned swap are then applied, so the money and percent figures are net of those costs before a buy or sell. It does not place
FREE
Automated Timeframe cycling with Symbols centered.  Force every timeframe onto one clock window, so the story you see on Daily is the same story you are slicing on H4, H1, and M1.  Traders usually flip timeframes and lose the span. A Daily chart shows a few weeks, then M15 shows a few hours, and the eye treats them as different markets. TASSERACT locks the window to N bars of the highest enabled timeframe — default 10 Daily — and maps every lower timeframe to that same stretch. You stay inside o
FREE
Omnirange
Abraham Correa
is an exit manager for trades you open yourself. It does not open positions and it does not send signals. After a manual buy or sell, it gives that trade a stop and up to six exit stages based on volatility. Three stages come from Average True Range, each with its own timeframe. Three come from completed range: daily (ADR), weekly (AWR), and monthly (AMR). Each stage can be switched on or off. Enabled stages are sorted by distance. Nearer stages trail the stop. The furthest is posted as the take
FREE
Predetermination
Abraham Correa
5 (1)
Predetermination is an exit manager for trades you open yourself. It does not open positions and it does not send signals. After a manual buy or sell, it gives that trade a stop and up to six exit stages based on volatility. Three stages come from Average True Range, each with its own timeframe. Three come from completed range: daily (ADR), weekly (AWR), and monthly (AMR). Each stage can be switched on or off. Enabled stages are sorted by distance. Nearer stages trail the stop. The
FREE
is designed to enhance the visual representation of financial charts in MetaTrader 4 by dynamically altering the colors of various chart elements, including candlesticks, bars, line charts, and volume bars. Its primary purpose is to improve trader intuition and engagement during market analysis by introducing smooth, cyclical color transitions that can highlight momentum shifts, trends, or volatility without overwhelming the display. This functionality is particularly beneficial for traders who
FREE
This indicator builds a live correlation matrix from the symbols currently selected in Market Watch . It calculates Pearson correlation on simple returns over a user-defined lookback and displays the results in a clean, auto-sized grid. Positive correlations appear in green, negative in red, and near-zero values stay neutral. An optional automatic timeframe scanner cycles through only the timeframes you enable (M1, M5, M15, M30, H1, H4, D1, W1, MN1), updating the entire matrix at a set interval.
FREE
visual trade planner for MetaTrader 5. It draws multi-timeframe ATR reward and stop zones on the chart so you can judge distance and payoff before you place the trade yourself. It does not send, modify, or close orders. Motive A single ATR on the chart timeframe often hides the larger and smaller ranges a trade is actually working against. This EA stacks three take-profit slices, each from its own timeframe, period, and multiplier, then places an ATR stop and an optional fixed stop beside them.
FREE
BirdsIview
Abraham Correa
is a user-friendly MetaTrader 4 indicator that creates a centralized dashboard for traders to oversee market symbols simultaneously across different timeframes, presenting price movements through simple dots or miniature candlestick charts, complemented by volume indicators to facilitate quick assessments of market trends and fluctuations. It automatically resizes grid cells according to the number of bars shown per timeframe for better use of screen space, features adjustable color schemes fo
FREE
변동성에 적응,거래 위치를 보상 할 수있는 잠재적 인 위험은 평균 실제 범위에 따라 표시됩니다. 위험 보상-'구매 또는 판매'버튼을 클릭하면 상자가 표시됩니다! 아트리움 계산의 유틸리티,거래를 종료 할 때 어려운 결정의 일부가 아닌 문제로 기뻐. 이 문제는 위험 관리 결정에 도움이 될 것입니다.  사양: 평균 진정한 범위는 핍 또는 가격에 시장의 변동성을 측정하는 일반적으로 사용되는 지표입니다. 진정한 범위는 가장 낮은 거래 가격과 촛대의 가장 높은 거래 가격의 차이입니다,주어진 기간에. 평균 실제 범위는 모두"이전"기간의 이러한 최고치와 최저치를 평균화합니다. 예를 들어,기본 설정은 우리에게 14 일 기간을 제공합니다. 14 일로 나눈 핍 값에서 최고치와 최저치를 수집합니다. 그러나 물론 이것은 일반적인 지표를 넘어서는 것입니다. 문제 사실,세 가지 완전히 다른 주가는 전적으로 다른 핍 소비를 위해 자신의 시간대에 의존합니다. 촛대의 규칙은 각 기간에 기술적으로 다르다. 그래
FREE
Table MATR
Abraham Correa
A Market Watch multi-timeframe ATR dashboard that turns a chart into a full-screen table showing each selected symbol’s recent volatility across multiple timeframes. It calculates ATR for the symbols visible in Market Watch, then displays the result in pips, points, or raw price units. Its practical use is volatility scanning, quickly finding instruments and timeframes that are moving enough—or quietly enough—for your trading style.                                Period that is worth using Sty
FREE
Market Watch's Symbols,  Lot Sizing choice,  Spread, & Price are shown. The app is visually customizable. Click on any Symbol for interaction with its chart!   Trader Market Watch is a display-only MetaTrader 4 board. It fills the chart tab with the symbols already in Market Watch and does not place or modify orders. Each row shows the symbol, the spread in pips, and the price. Two lot columns sit beside them: the lot size that uses your chosen percent of balance as margin, and the largest
FREE
Candlestick MATR
Abraham Correa
Analyze volatility by clicking on a specific candlestick, which triggers the display of horizontal grid lines centered around the candlestick’s closing price, spaced by multiples of the calculated ATR. A vertical line highlights the selected candlestick, and an optional text label can display the ATR value in pips above the candlestick. The indicator is lightweight, using no buffers, and relies on chart objects for visualization. It includes error handling for invalid candlestick selections and
FREE
Bigger chart labels would allow the user to be entirely aware of which chart he/she is on. Each chart window is unique, containing different patterns and economic motives so acknowledging the chart window would be absolutely essential! There are well known Economic Time Zones included in clear view, by choice!    Simple does it! Use your computing mouse scroller, clicking with the right finger on the label, in order to customize the label properties. From there, choose your preferred color, fon
FREE
This script paces itself to zoom into the deepest setting of ZOOM +     You may be in tune to know a few keyboard easter eggs. Pressing the  minus <->  button has the capability to Zoom the Chart Outward! Interesting to see the price reevaluate itself in perspective. This we could see is quite contagiously useful if we wanted to be quick with analyzing, examining through your tools, in your plans and such. So, if you ever wanted to zoom IN and OUT, here is Your play around with the chart poin
FREE
Grid MATR
Abraham Correa
Grid MATR is designed to map price against dynamically measured or fixed ranges so traders can better visualize volatility, market extension, and session-based price behavior—while requiring independent analysis for direction and trade decisions.  The motive is to turn market volatility and selected time/session reference points into a visual price grid.  Instead of claiming to predict price direction, it gives the trader a structured way to judge where current price sits relative to ATR-deriv
FREE
It computes BUY and SELL lot sizing in either % of balance or in fixed intervals. In market orders, this EA contains the adaptive slippage, logs tickets for instant confirmation of opening trades, and contains every market symbol at a glance. Real-time balance/equity display keeps margin health in view without tab-switching, toggling spread if needed for liquidity checks. Compact left-panel layout minimizes screen real estate, empowering blind trades where speed trumps overanalyze—perfect for
FREE
Symbol Cycler
Abraham Correa
Symbol Cycler is a lightweight on-chart utility that lets you quickly switch between symbols in your Market Watch list using two simple arrow buttons (). With a single click, you can scroll forward or backward through your predefined symbols without leaving the chart. Key Features: One-click symbol switching from the chart Works with your Market Watch list order Buttons can be placed in any chart corner or even the center Timeframe remains locked while switching symbols Clean, responsive UI
FREE
The SyncAllCharts indicator streamlines trading by automatically aligning all open MetaTrader 4 charts to the symbol of the chart where it’s applied, saving traders time and effort when analyzing a single asset across multiple timeframes or setups. With a customizable "Main Sync" label to identify the lead chart, it ensures a clear, clutter-free workspace, enhancing workflow efficiency and consistency for traders monitoring one currency pair or symbol.
FREE
An on‑chart, data‑driven pre‑trade planner that turns your broker’s live market properties into clear, actionable numbers. It consolidates spread, commission, swaps, ATR‑based stop/targets, pip/point value and 10 risk‑profile lot sizes into one compact panel that auto‑scales to any chart size. The display is direction‑agnostic (no LONG/SHORT duplication) and emphasizes total trade cost and true risk/reward before you click “Buy/Sell.” What it shows (at a glance) Time & price context  (Local/Serv
FREE
Designed to mark a specific price and time point on an MT4 chart based on a single mouse click, synchronizing this data across all timeframes for the same symbol. Its primary purpose is to help traders pinpoint and track critical levels or events (e.g., support/resistance or entry points) with persistent visual markers. The indicator uses dashed lines for price and time crosshairs, accompanied by labels that dynamically adjust to stay within chart boundaries, ensuring clarity regardless of win
FREE
StainGlass MATR
Abraham Correa
Its primary motive is to overlay horizontal lines spaced according to multiples of the Average True Range (ATR), centered on a reference price from defined periods such as trading sessions, candlestick counts, or 12-hour intervals. This facilitates the identification of potential support and resistance levels or expected price ranges. Additionally, it marks major forex trading sessions (Sydney, Tokyo, London, and New York) with arrows to provide contextual awareness of market hours, enhancing d
FREE
필터:
리뷰 없음
리뷰 답변