Easy RR Monitor Panel

如果产品有任何问题或者您需要在此产品上添加功能,请联系我

Contact/message me if you encounter any issue using the product or need extra feature to add on the base version.


There are two critical components in a profitable trading system. One is entry (placing an order) and another one is exit (closing an order). You can exit by time: closing order after London Close, for example. You can also exit by position: closing an order when price reaches a certain support/resistance level.

Easy RR Monitor Panel is an intuitive, and handy graphical tool to help you to:

  • Locate and highlight the closest upper and lower support/resistance level (among the seven critical support/resistance levels, which are pivot S1, pivot R1, daily pivot, weekly pivot, monthly pivot, previous daily high and previous daily low) to the current price. See the screenshot.
  • Find the profitable RR ratio entry level with highlight by calculating and comparing the distance between the upper level closest to the current price and distance between the lower level closest to the current price. See the screenshot.
  • Click the buy/sell button to place buy and/or sell order with TP and SL set at the above level, which gives you a good RR ratio.


Features

  • Users are able to select support and resistance levels for RR ratio generating
  • Adjustable indicator panel position


Inputs

  • Magic Number
  • Lot Size
  • Use Pivot Support
    • Use pivot support for RR ratio calculation
    • Same rule applied to the following six support/resistance levels
  • Use Pivot Resistance
  • Use Daily Pivot
  • Use Weekly Pivot
  • Use Monthly Pivot
  • Use Previous Daily High
  • Use Previous Daily Low
  • X_axis: dashboard x position
  • Y_axis: dashboard y position
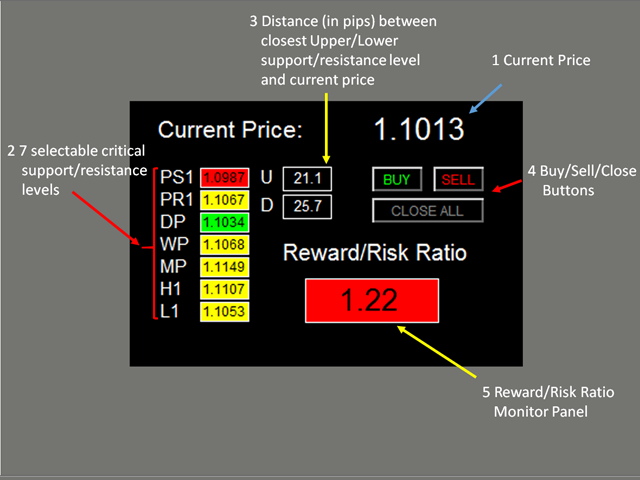

Dashboard Objects

See the screenshot:

  1. Current Price
  2. Seven selectable critical support/resistance levels: a) selected levels will be repainted to be yellow; non-selected levels will be repainted to be white; b) the closest upper level will be repainted to be green; the closest lower level will be repainted to be red
    • Pivot S1
    • Pivot R1
    • Daily Pivot
    • Weekly Pivot
    • Monthly Pivot
    • Previous Daily High
    • Previous Daily Low
  3. Distance (in pips) between the closest Upper/Lower support/resistance level and the current price
    • If the price goes beyond above all selected levels, 'U' cell will display 'NA'
    • If the price goes beyond below all selected levels, 'D' cell will display 'NA'
  4. Buy/Sell/Close buttons:
    • Click buy/sell button to place buy and/or sell order with TP and SL set at the above level
    • Click close button to close all orders with the magic number used in this EA
  5. Reward/Risk Ratio Panel
    • Number indicates the Reward/Risk Ratio. If the price goes beyond above/below all selected levels, the panel displays 'NA'
    • If (current price - closest lower level) > (closest upper level - current price), the panel will be repainted to be red
    • If (closest upper level - current price) > (current price - closest lower level), the panel will be repainted to be green

The demo version of the product is available here.

    If you have any customized request and/or suggestion, please feedback to me.

    おすすめのプロダクト
    「Auto FIBO Pro」Crypto_Forex インジケーターは、取引の補助ツールとして最適です。 - インジケーターは、フィボナッチ レベルとローカル トレンド ライン (赤色) を自動的に計算してチャート上に配置します。 - フィボナッチ レベルは、価格が反転する可能性のある重要な領域を示します。 - 最も重要なレベルは、23.6%、38.2%、50%、61.8% です。 - リバーサル スキャルピングやゾーン グリッド取引に使用できます。 - Auto FIBO Pro インジケーターを使用して、現在のシステムを改善する機会も多数あります。 - Info Spread Swap Display があり、接続されている外国為替ペアの現在のスプレッドとスワップを表示します。 - ディスプレイには、アカウントの残高、エクイティ、マージンも表示されます。 - Info Spread Swap Display は、チャートのどのコーナーにも配置できます。 0 - 左上コーナー、1 - 右上、2 - 左下、3 - 右下。 高品質のトレーディングロボットとインジケーターをご覧にな
    VR Cub
    Vladimir Pastushak
    VR Cub は、質の高いエントリーポイントを獲得するためのインジケーターです。このインジケーターは、数学的計算を容易にし、ポジションへのエントリーポイントの検索を簡素化するために開発されました。このインジケーターが作成されたトレーディング戦略は、長年にわたってその有効性が証明されてきました。取引戦略のシンプルさはその大きな利点であり、初心者のトレーダーでもうまく取引することができます。 VR Cub はポジション開始ポイントとテイクプロフィットとストップロスのターゲットレベルを計算し、効率と使いやすさを大幅に向上させます。取引の簡単なルールを理解するには、以下の戦略を使用した取引のスクリーンショットを見てください。 設定、設定ファイル、デモ版、説明書、問題解決方法は、以下から入手できます。 [ブログ] レビューを読んだり書いたりすることができます。 [リンク] のバージョン [MetaTrader 5] エントリーポイントの計算ルール ポジションをオープンする エントリーポイントを計算するには、VR Cub ツールを最後の高値から最後の安値までストレッチする必要があります。 最初
    Koala Supply Demand
    Ashkan Hazegh Nikrou
    5 (3)
    MetaTrader 4 の Koala Supply Demand Indicator をご紹介します (他のトレーダーがあなたの経験から恩恵を受けられるように、肯定的なものでも否定的なものでも、レビューやフィードバックを共有することをお勧めします)。 Koala Supply Demandインジケーターへようこそ。このインジケーターは連続したサプライとデマンドゾーンを特定するために設計されています。このインジケーターはトレーダーが市場をゾーンエリアとして表示できるようにし、いくつかの強力なゾーンがどのように価格を尊重しているかを見るのに役立ちます。このインジケーターはまた、ゾーン内で形成されたときに価格アクションのシグナルを表示することもできます。 Koala Trading Solutionチャンネル で最新のKoala製品に関する最新情報を入手するために、mql5コミュニティに参加してください。参加リンクは以下です: https://www.mql5.com/en/channels/koalatradingsolution https://www.mql5.com/en/bl
    FREE
    "The trend is your friend" is one of the best known sayings in investing, because capturing large trendy price movements can be extremely profitable. However, trading with the trend is often easier said than done, because many indicators are based on price reversals not trends. These aren't very effective at identifying trendy periods, or predicting whether trends will continue. We developed the Trendiness Index to help address this problem by indicating the strength and direction of price trend
    これは、キャンドルの終値を予測する指標です。 このインジケータは、主にD1チャートでの使用を目的としていますが. この指標は、従来の外国為替取引とバイナリオプション取引の両方に適しています。 インジケーターは、スタンドアロンのトレーディングシステムとして使用することも、既存のトレーディングシステムへの追加として機能させることもできます。 このインジケーターは、現在のキャンドルを分析し、キャンドル自体の内部の特定の強度係数と、前のキャンドルのパラメーターを計算します。 したがって、この指標は、市場の動きのさらなる方向性と現在のキャンドルの終値を予測します。 この方法のおかげで、この指標は、短期の日中取引だけでなく、中期および長期の取引にも適しています。 インジケーターを使用すると、市場の状況の分析中にインジケーターが生成する潜在的な信号の数を設定できます。 インジケーターの設定には、このための特別なパラメーターがあります。 また、インジケーターは、チャート上のメッセージの形式で、電子メールで、およびPUSH通知の形式で、新しい信号について通知することができます。 購入後は必ず私に書いて
    Smoothed Heiken Ashi with AC/AO Zones – Professional Trading Clarity Transform your Heiken Ashi analysis with intelligent smoothing that eliminates noise while preserving actionable signals. What Makes This Different? This isn't just another Heiken Ashi indicator. We've engineered a sophisticated smoothing engine that works with the Accelerator (AC) and Awesome Oscillator (AO) zone logic to give you cleaner entries and exits without sacrificing responsiveness. Four Smoothing Methods at Your Comm
    Price Magnet — Price Density and Attraction Levels Indicator Price Magnet is a professional analytical tool designed to identify key support and resistance levels based on statistical Price Density. The indicator analyzes a specified historical period and detects price levels where the market spent the most time. These zones act as “magnets,” attracting price action or forming a structural base for potential reversals. Unlike traditional Volume Profile tools, Price Magnet focuses on price-time d
    Trend PA
    Mikhail Nazarenko
    5 (3)
    The Trend PA indicator uses   Price Action   and its own filtering algorithm to determine the trend. This approach helps to accurately determine entry points and the current trend on any timeframe. The indicator uses its own algorithm for analyzing price changes and Price Action. Which gives you the advantage of recognizing, without delay, a new nascent trend with fewer false positives. Trend filtering conditions can be selected in the settings individually for your trading style. The indicator
    Rainbow Price Visualizer v1.21 See where the market really breathes. Turns your MT4 chart into an ultra-precise heatmap that highlights price zones favored by big players. Why it matters 300 price levels at 0.2‑pip resolution — microscopic detail. 8 visual themes (Rainbow, Fire, Ocean…) for instant readibility. Smart opacity: low noise fades, real zones pop. Lightweight rendering with automatic cleanup. Fully customizable: saturation, opacity, resolution, history depth. Bands project into the f
    平均方向性指数(ADX)マルチカレンシースキャナー MT4 は、複数の通貨ペアを同時に分析するために設計された高度なトレーディングインジケーターです。これは、平均方向性指数に基づいたリアルタイムのシグナルを提供することで、意思決定プロセスを強化しようとするトレーダーにとって有益です。効率的な市場トレンド分析を可能にします。 このツールは、トレンドの強さと方向の動きを簡単に特定できるようにすることで、トレーダーにとって不可欠な資産となります。ADXに基づく戦略を採用しているトレーダーにとって特に重要です。リアルタイムのアラートと使いやすいダッシュボードにより、トレーダーは市場の状況を迅速に評価し、情報に基づいた取引選択を行うことができます。 MQL製品のインストールガイド | MT4/MT5で購入したMQL製品の更新 | 一般的なトラブルシューティングガイド | インジケーター設定 / ガイド 主な機能 バッファ統合: インジケーターの値をアクセス可能なバッファとして公開し、Expert Advisorが自動取引のためにシグナルデータを利用できるようにします。 視覚的矢印シグナル: シグ
    The indicator displays the data of the Stochastic oscillator from a higher timeframe on the chart. The main and signal lines are displayed in a separate window. The stepped response is not smoothed. The indicator is useful for practicing "manual" forex trading strategies, which use the data from several screens with different timeframes of a single symbol. The indicator uses the settings that are identical to the standard ones, and a drop-down list for selecting the timeframe. Indicator Paramet
    Crypto_Forex インジケーター HTF Ichimoku for MT4。 - Ichimoku インジケーターは、最も強力なトレンド インジケーターの 1 つです。HTF は、Higher Time Frame を意味します。 - このインジケーターは、トレンド トレーダーや、プライス アクション エントリとの組み合わせに最適です。 - HTF Ichimoku インジケーターを使用すると、より高い時間枠の Ichimoku を現在のチャートに添付できます。 - 上昇トレンド - 赤い線が青い線より上 (両方の線が雲より上) / 下降トレンド - 赤い線が青い線より下 (両方の線が雲より下)。 - 価格が Ichimoku 雲の上部境界を突破した場合にのみ、買い注文を開きます。 - 価格が Ichimoku 雲の下部境界を突破した場合にのみ、売り注文を開きます。 - HTF Ichimoku インジケーターを使用すると、大きなトレンドを捉える機会が得られます。 高品質のトレーディングロボットとインジケーターをご覧になるにはここをクリックしてください! これは、この M
    Gold Venamax   - これは最高の株式テクニカル指標です。 指標アルゴリズムは資産の価格変動を分析し、ボラティリティと潜在的なエントリーゾーンを反映します。 インジケーターの機能: これは、快適で収益性の高い取引のためのマジックとトレンド矢印の 2 つのブロックを備えたスーパー インジケーターです。 チャート上にブロックを切り替えるための赤いボタンが表示されます。 マジックはインジケーター設定で設定されているため、異なるブロックを表示する 2 つのチャートにインジケーターをインストールできます。 Gold Venamax は、異なる矢印バッファー (GV と SD) を備えた 2 つのチャートに配置できます。 これを行うには、設定で異なる Magic を選択する必要があります。たとえば、あるマジック = 999、別のマジック = 666 を選択します。次に、チャート上の赤いボタンで矢印バッファを選択できます。 インジケーター設定の各矢印バッファー (GV および SD) には、快適で収益性の高い取引のための個別の矢印フィルターがあります (UseFiltrGV = tru
    The indicator shows the potential trend direction by cyclical-wave dependence. Thus, all the rays of the intersection will be optimal rays, in the direction of which the price is expected to move, taking into account the indicator period. Rays can be used as a direction for potential market movement. But we must not forget that the approach must be comprehensive, the indicator signals require additional information to enter the market.
    "Impulses and Corrections 4" is created to help traders navigate the market situation. The indicator shows multi-time frame upward and downward "Impulses" of price movements. These impulses are the basis for determining the "Base" , which is composed of zones of corrections of price movements, as well as "Potential" zones for possible scenarios of price movement. Up and down impulses are determined based on a modified formula of Bill Williams' "Fractals" indicator. The last impulse is always "U
    The main idea of this indicator is rates analysis and prediction by Fourier transform. Indicator decomposes exchange rates into main harmonics and calculates their product in future. You may use the indicator as a standalone product, but for better prediction accuracy there is another related indicator - FreqoMaster - which uses FreqoMeterForecast as a backend engine and combines several instances of FreqoMeterForecast for different frequency bands. Parameters: iPeriod - number of bars in the ma
    「調整可能なフラクタル」はフラクタル インジケーターの高度なバージョンで、非常に便利なトレーディング ツールです。 - ご存知のとおり、標準フラクタル mt4 インジケーターには設定がまったくありません。これはトレーダーにとって非常に不便です。 - 調整可能なフラクタルは、この問題を解決しました。必要な設定がすべて揃っています。 - インジケーターの調整可能な期間 (推奨値 - 7 以上)。 - 価格の高値/安値からの距離を調整可能。 - フラクタル矢印のデザインを調整可能。 - インジケーターにはモバイルおよび PC アラートが組み込まれています。 高品質のトレーディングロボットとインジケーターをご覧になるにはここをクリックしてください! これは、この MQL5 Web サイトでのみ提供されるオリジナル製品です。
    Step into the world of Forex trading with confidence, clarity, and precision using   Gold Indicator   a next-generation tool engineered to take your trading performance to the next level. Whether you’re a seasoned professional or just beginning your journey in the currency markets, Gold Indicator equips you with powerful insights and help you trade smarter, not harder. Built on the proven synergy of three advanced indicators, Gold Indicator focuses exclusively on medium and long-term trends eli
    インディケータは現在のクオートを作成し、これを過去のものと比較して、これに基づいて価格変動予測を行います。インジケータには、目的の日付にすばやく移動するためのテキスト フィールドがあります。 オプション: シンボル - インジケーターが表示するシンボルの選択; SymbolPeriod - 指標がデータを取る期間の選択; IndicatorColor - インジケータの色; HorisontalShift - 指定されたバー数だけインディケータによって描画されたクオートのシフト; Inverse - true は引用符を逆にします。false - 元のビュー。 ChartVerticalShiftStep - チャートを垂直方向にシフトします (キーボードの上下矢印)。 次は日付を入力できるテキストフィールドの設定で、「Enter」を押すとすぐにジャンプできます。
    The main idea of this indicator is rates analysis and prediction by Fourier transform. The indicator decomposes exchange rates into main harmonics and calculates their product in future. The indicator shows 2 price marks in history, depicting price range in the past, and 2 price marks in future with price movement forecast. Buy or sell decision and take profit size are displayed in a text label in the indicator window. The indicator uses another indicator as an engine for calculations - FreqoMet
    The indicator shows which trading pairs, strategies, robots and signals that you use are profitable and which are not. The statistic of trades and balance graph are displayed in the account currency and pips - to switch simply click on the graph. button "$"(top left) - minimize/expand and move the indicator panel button ">"(bottom right) - stretching and resetting to the original size Statistic of trades 1 line - account balance, current profit and lot of open trades; 2 line - the number of all
    SX Supply Demand Zones accurately identifies and draws high-probability Supply and Demand zones using a sophisticated algorithm. Unlike traditional indicators that clutter your chart, this indicator is designed with a focus on performance and a clean user experience. New Unique Feature: Interactive Legend System What truly sets this indicator apart from everything else is the Interactive Control Legend. You have a professional dashboard directly on your chart that allows you to: Show/Hide: Ins
    FREE
    SMC Venom Model BPR インジケーターは、スマート マネー (SMC) コンセプトで取引するトレーダー向けのプロフェッショナル ツールです。価格チャート上の 2 つの主要なパターンを自動的に識別します。 FVG   (フェアバリューギャップ) は、3 本のローソク足の組み合わせで、最初のローソク足と 3 番目のローソク足の間にギャップがあります。ボリュームサポートのないレベル間のゾーンを形成し、価格修正につながることがよくあります。 BPR   (バランス価格範囲) は、2 つの FVG パターンの組み合わせで、「ブリッジ」を形成します。これは、価格がボリュームアクティビティの少ない動きで動くときに、ブレイクアウトしてレベルに戻るゾーンで、ローソク足の間にギャップを作成します。 これらのパターンは、大規模な市場プレーヤーと一般参加者の相互作用が発生するチャート上のボリュームと価格動向の分析に基づいて、トレーダーが主要なサポート/レジスタンス レベル、ブレイクアウト ゾーン、エントリ ポイントを識別するのに役立ちます。 インジケーターは、長方形と矢印の形でパターンを視
    Was: $249  Now: $99   Market Profile defines a number of day types that can help the trader to determine market behaviour. A key feature is the Value Area, representing the range of price action where 70% of trading took place. Understanding the Value Area can give traders valuable insight into market direction and establish the higher odds trade. It is an excellent addition to any system you may be using. Blahtech Limited presents their Market Profile indicator for the MetaTrader community. Ins
    Alpha Trend signは私たちの取引システムを検証し、取引信号を明確に提示し、信号がドリフトすることはありません。 主な機能: •市場が活況を示している地域に応じて、指標に基づいて現在の相場がトレンド相場に属しているか、それとも揺れ相場に属しているかを直感的に判断することができる。 そして、指標の指示矢印に基づいて市場に切り込み、緑の矢印は購入を提示し、赤の矢印は販売を提示する。 •小周期変動による頻繁な取引信号の発生を回避するために、5分以上の時間周期で取引を行うことを推奨します。 •最適な取引タイミングを逃さないために、シグナルプロンプトをオンにすることもできます。 •本指標はトレンド相場をよく予測するだけでなく、幅広振動相場でも利益を得ることができる。 •本指標は大道至簡の原則に基づいており、異なる段階のトレーダーが使用するのに適している。 注意事項: •Alpha Trend signには明確な入退場信号があり、損失を与えないように逆位相操作を提案しない。 •Alpha Trend signは特に成熟した指標であり、デルのチー
    H4 GBPUSD Trend Scalper is a trend signal scalper The EA trades according to the trend strategy using original built-in indicator for opening and closing orders. The external inputs for limiting trading on Fridays and Mondays are available. The purpose of the strategy is to use the current trend with the most benefit. According to the results of testing and working on demo and real accounts, the best results achieved by using the Н4 timeframe on the GBP/USD pair Works on MetaTrader 4 Build 971+
    Candle Pattern Finder Candle Pattern Finder is a powerful MT4 indicator designed to help traders easily detect key candlestick patterns in real-time. Whether you're trading trends, reversals, or consolidations, this tool highlights important price action signals directly on the chart — helping you make faster and more confident trading decisions. Detects popular candlestick patterns: Bullish/Bearish Engulfing Hammer & Inverted Hammer Shooting Star & Hanging Man Three White Soldiers Three Black
    FREE
    Multicurrency indicator in table format. Signals appear with confirmation, do not redraw. The indicator works on the current (open) timeframe. Notifications come for an open instrument. The strategy includes: price touching the moving average in the direction of the trend, as well as an extraordinary recalculation of the classic ADX indicator to determine the trend as an additional filtering of entries. Entries are displayed on the chart as arrows and, as mentioned above, the arrows are not redr
    標準パラメーターを使用したMACDインジケーター波に基づく 最後と最後の2つのMACDウェーブで、それぞれ正と負のフィボナッチレベルを扱います。 現時点でMACDインジケーターで負の波が終了している場合、色は緑です。 現時点でMACDインジケーターの正の波が終了している場合、色は赤です。 Waveの終了基準は、MACDの符号が異なる2ティックです。 最後の4つのMACDウェーブのトレンドラインをプロットします。 専門家とうまく働く  その他のスクリーンショット: Figures MACD   https://www.mql5.com/ru/market/product/42031 https://www.mql5.com/en/charts/10581596/audusd-h1-alpari-international https://www.mql5.com/en/charts/10631979/usdjpy-m1-alpari-international https://www.mql5.com/en/charts/10628704/gbpusd-m15-alpa
    このプロダクトを購入した人は以下も購入しています
    Trade Assistant MT4
    Evgeniy Kravchenko
    4.43 (194)
    取引 ごとのリスクの 計算、新規注文 の 簡単 な 設置、部分的 な 決済機能 を 持 つ 注文管理、 7 種類 のトレーリングストップなど 、便利 な 機能 を 備 えています 。 追加の資料と説明書 インストール手順 - アプリケーションの手順 - デモアカウント用アプリケーションの試用版 ライン機能 チャート上にオープニングライン、ストップロス、テイクプロフィットを表示します。この機能により、新規注文を簡単に設定することができ、注文を出す前にその特徴を確認することができます。   リスク計算 リスク計算機能は、設定されたリスクとストップロス注文のサイズを考慮して、新規注文のボリュームを計算します。ストップロスの大きさを自由に設定できると同時に、設定したリスクを守ることができます。 Lot calc ボタン - リスク 計算 を 有効 / 無効 にします 。 Risk フィールドでは 、必要 なリスクの 値 を 0 から 100 までのパーセンテージまたは 預金通貨 で 設定 します 。 設定」 タブで 、 リスク 計算 の 種類 を 選択 します :「 $ 通貨」、「 % 残
    Trade Manager EAへようこそ。これは、取引をより直感的、正確、そして効率的にするために設計された究極の リスク管理ツール です。これは単なるオーダー実行ツールではなく、包括的な取引計画、ポジション管理、リスク管理のためのソリューションです。初心者から上級者、迅速な実行を必要とするスキャルパーまで、Trade Manager EAはあらゆるニーズに対応し、為替、指数、商品、暗号通貨などさまざまな市場で柔軟に対応します。 Trade Manager EAを使用すると、複雑な計算が過去のものになります。市場を分析し、エントリーポイント、ストップロス、テイクプロフィットのレベルをチャート上のラインでマークし、リスクを設定するだけで、Trade Managerが最適なポジションサイズを即座に計算し、SLとTPをピップ、ポイント、口座通貨でリアルタイムに表示します。すべての取引が簡単かつ効果的に管理されます。 主な機能: ポジションサイズ計算機 :定義されたリスクに基づいて取引サイズを瞬時に決定します。 簡単な取引計画 :エントリー、ストップロス、テイクプロフィットを設定するためのド
    Local Trade Copier EA MT4
    Juvenille Emperor Limited
    4.96 (109)
    Local Trade Copier EA MT4 による、驚くほど高速な取引コピーを体験してください。1分で簡単にセットアップできるこの取引コピー機は、同じWindowsコンピュータまたはWindows VPS上の複数のMetaTrader端末間で取引をコピーすることができ、0.5秒未満の高速コピースピードを実現します。 初心者であろうとプロのトレーダーであろうと、 Local Trade Copier EA MT4 には、あなたの特定のニーズに合わせてカスタマイズするための幅広いオプションが用意されています。これは、利益の可能性を高めたい人にとって究極のソリューションです。 今すぐ試してみて、これが市場で最も速くて簡単なトレードコピー機である理由を理解してください。 ヒント: デモアカウントで Local Trade Copier EA MT4 デモバージョンをダウンロードして試すことができます: ここ ダウンロードした無料のデモ ファイルを MT4 >> ファイル >> データ フォルダを開く >> MQL4 >> Experts フォルダに貼り付けて、ターミナルを再起動しま
    Exp COPYLOT CLIENT for MT4
    Vladislav Andruschenko
    4.65 (66)
    MetaTrader4のコピー機を取引します。     それは任意の口座からの外国為替取引、ポジション、注文をコピーします。 それは最高の貿易コピー機の1つです     MT4 - MT4、MT5 - MT4     のために     COPYLOT MT4     バージョン(または     MT4 - MT5  MT5 - MT5     のために     COPYLOT MT5     バージョン)。 MT5のバージョン 完全な説明   +DEMO +PDF 購入する方法 インストールする方法     ログファイルの取得方法     テストと最適化の方法     Expforex のすべての製品 のコピー機 バージョン       MetaTrader 5 ターミナル(   МТ5 - МТ5、МТ4 - МТ5   )-   コピーロットクライアントMT5 独自のコピーアルゴリズムにより、すべての取引がマスターアカウントからクライアントアカウントに正確にコピーされます。 また、動作速度が速いことでも知られています。タフなエラー処理。 強力な機能セット。 プログラムは、複数
    The product will copy all telegram signal to MT4   ( which you are member  ) , also it can work as remote copier.  Easy to set up, copy order instant, can work with almost signal formats, image signal, s upport to translate other language to English Work with all type of channel or group, even channel have "Restrict Saving Content", work with  multi channel, multi MT5 Work as remote copier: with signal have ticket number, it will copy exactly via ticket number. Support to backtest signal. How to
    Trade copier MT4
    Alfiya Fazylova
    4.58 (33)
    Trade Copierは、取引口座間の取引をコピーして同期するように設計された専門的なユーティリティです。 コピーは、同じコンピューターまたはvps にインストールされている、サプライヤーのアカウント/端末から受信者のアカウント/端末に行われます。 購入する前に、デモ アカウントでデモ バージョンをテストできます。 デモ版 こちら 。 詳細な説明は こちら 。 主な機能と利点: MT5ネッティングアカウントを含む、MT4> MT4、MT4> MT5、MT5> MT4のコピーをサポートします。 高いコピー速度(0.5秒未満)。 ベンダーモードと受信者モードは同じ製品内に実装されています。 チャートから直接リアルタイムでコピーを制御できる、簡単で直感的なインターフェイス。 接続が切断されたり、端末が再起動されたりしても、設定と位置が失われることはありません。 コピーするシンボルを選択できます。また、受信者のシンボルを置き換えることもできます(例:EURUSD> USDJPY)。 バックコピーをサポートします。 特定の注文のみのコピーを有効にする機能。 取引開始価格の最大差と最大遅延時間を
    TradePanel MT4
    Alfiya Fazylova
    4.84 (94)
    Trade Panelは多機能なトレーディングアシスタントです。アプリには手動取引用の50以上のトレーディング機能が搭載されており、ほとんどの取引作業を自動化することができます。 ご注意ください!割引は期間限定で、毎週火曜日に価格が5ドルずつ上昇します(上限90ドルまで)。 購入前に、デモアカウントでアプリのデモ版をテストすることができます。デモアカウント用のアプリの試用版をダウンロードするには、次のリンクをご利用ください: https://www.mql5.com/en/blogs/post/750865 。 完全な手順 こちら 。 取引。 ワンクリックで取引操作を行うことができます: リスクを自動計算して指値注文やポジションを開く。 複数の注文やポジションをワンクリックで開く。 注文のグリッドを開く。 保留中の注文やポジションをグループごとに閉じる。 ポジションの方向を反転(Buyを閉じてSellを開く、またはSellを閉じてBuyを開く)。 ポジションをブロックする(不足している量のポジションを開くことでBuyとSellのポジション量を等しくする)。 すべてのポジションを部分的に
    THIS EA IS A SEMI-AUTO EA, IT NEEDS USER INPUT. Manual & Test Version Please TEST this product before   BUYING  and watch my video about it. Contact me for user support or bug reports, or if you want the MT5 version! MT5 Version I do not guarantee any profits or financial success using this EA. With this Expert Advisor, you can: Implement your own   Zone Recovery   strategy to capitalize on trending markets. Create   Grid   trading strategies, to profit from ranging markets. Place orders easil
    この製品は、ニュースタイム中にすべてのエキスパートアドバイザーと手動チャートをフィルタリングするため、急激な価格変動によるマニュアルトレードのセットアップの破壊や他のエキスパートアドバイザーによって入力された取引について心配する必要はありません。この製品には、ニュースのリリース前にオープンポジションとペンディングオーダーを処理できる完全な注文管理システムも付属しています。 The News Filter  を購入すると、将来のエキスパートアドバイザーのためにビルトインのニュースフィルターに頼る必要はなく、今後はすべてのエキスパートアドバイザーをここからフィルタリングできます。 ニュース選択 ニュースソースは、Forex Factoryの経済カレンダーから取得されます。 USD、EUR、GBP、JPY、AUD、CAD、CHF、NZD、CNYなど、任意の通貨数に基づいて選択できます。 Non-Farm(NFP)、FOMC、CPIなどのキーワード識別に基づいて選択することもできます。 影響レベルによってフィルタリングするニュースを選択することができ、低、中、高の影響範囲から選択できます。
    Trading History - A program for trading and money management on the history of quotes in stratagy tester. It can work with pending and immediate orders, and is equipped with trailing stop, breakeven and take profit functions. Very good for training and testing different strategies. Manual (Be sure to read before purchasing) Advantages 1. Allows you to test any trading strategy in the shortest possible time 2. An excellent simulator for trading training. You can gain months of trading experience
    Trade Manager は、リスクを自動的に計算しながら、取引を迅速に開始および終了するのに役立ちます。 過剰取引、復讐取引、感情的な取引を防止する機能が含まれています。 取引は自動的に管理され、アカウントのパフォーマンス指標はグラフで視覚化できます。 これらの機能により、このパネルはすべてのマニュアル トレーダーにとって理想的なものとなり、MetaTrader 4 プラットフォームの強化に役立ちます。多言語サポート。 MT5バージョン  |  ユーザーガイド + デモ Trade Manager はストラテジー テスターでは機能しません。 デモについてはユーザーガイドをご覧ください。 危機管理 % または $ に基づくリスクの自動調整 固定ロットサイズを使用するか、ボリュームとピップに基づいた自動ロットサイズ計算を使用するオプション RR、Pips、または価格を使用した損益分岐点ストップロス設定 トレーリングストップロス設定 目標に達したときにすべての取引を自動的に終了するための 1 日あたりの最大損失 (%)。 過度のドローダウンからアカウントを保護し、オーバートレードを防ぎま
    Seconds Chart - MetaTrader 4で秒足チャートを作成するユニークなツールです。 Seconds Chart を使用すると、秒単位のタイムフレームでチャートを構築でき、標準的な分足や時間足チャートでは得られない柔軟性と分析精度を実現します。例えば、 S15 は15秒足を表します。あらゆるインジケーター、エキスパートアドバイザー、スクリプトを利用可能で、標準的なチャートと同様に便利に操作できます。 標準的なツールとは異なり、 Seconds Chart は超短期のタイムフレームでも高い精度と遅延なく作業できるように設計されています。 Seconds Chartの利点 1秒から900秒 までのタイムフレームをサポート。 瞬時の読み込み MT5ターミナルからのティックデータベースのインポートにより、過去データを即時利用可能。 MT5ターミナルで「 Tick Database 」ユーティリティを最初に起動する必要があります。 リアルタイムでデータが更新され、 遅延やラグなし 。 複数の秒足チャートを同時に作成可能。 Seconds Chartが最適な用途 スキャルピング
    MT4のエキスパートアドバイザーリスクマネージャーは非常に重要であり、私の意見ではすべてのトレーダーにとって必要なプログラムです。 このエキスパートアドバイザーを使用すると、取引口座のリスクを管理することができます。リスクと利益の管理は、金銭的およびパーセンテージの両方で実行できます。 エキスパートアドバイザーが機能するには、それを通貨ペアチャートに添付し、許容可能なリスク値を預金通貨または現在の残高の%で設定するだけです。 アドバイザ機能 このリスクマネージャーは、リスクの管理を支援します。 -取引のために -1日あたり - 1週間 - ひと月ほど 制御することもできます 1)取引時の最大許容ロット 2)1日あたりの最大注文数 3)1日あたりの最大利益 4)エクイティを引き受ける利益を設定する それだけではありません。設定で自動設定を指定した場合、アドバイザーはデフォルトのSLとTPを設定することもできます。 アドバイザーは各イベントにアラートを添えて、注文を削除する理由を説明します。たとえば、あなたが開封し、6番目の注文を開封し、1日あたり5つの注文のみを開封す
    MT4 to Telegram Signal Provider は使いやすく、完全にカスタマイズ可能なツールで、Telegramに信号を送信し、あなたのアカウントを信号提供者に変えることができます。 メッセージのフォーマットは 完全にカスタマイズ可能です! しかし、簡単な使用のために、あらかじめ定義されたテンプレートを選択し、メッセージの特定の部分を有効または無効にすることもできます。 [ デモ ]   [ マニュアル ] [ MT5バージョン ] [ Discordバージョン ] [ Telegramチャンネル ]  New: [ Telegram To MT5 ] セットアップ ステップバイステップの ユーザーガイド が利用可能です。 Telegram APIの知識は必要ありません。開発者が必要なものをすべて提供します。 主要機能 購読者に送信される注文の詳細をカスタマイズする機能 例えばブロンズ、シルバー、ゴールドなど、階層型のサブスクリプションモデルを作成できます。ゴールドサブスクリプションでは、すべての信号が得られますなど。 ID、シンボル、またはコメントによる注文のフ
    " Trader Evolution " - A utility designed for traders who use wave and technical analysis in their work. One tab of the utility is capable of money management and opening orders, and the other can help in making Elliott wave and technical analysis. Manual (Be sure to read before purchasing) | Version for MT5 Advantages 1. Trading in a few clicks. Immediate and pending orders are available in the panel 2. Money management. The program automatically selects the appropriate lot size 3. Simplifies
    TelegramからMT4へ: 究極のシグナルコピーソリューション Telegram to MT4 は、DLLを必要とせず、TelegramのチャンネルやチャットからMetaTrader 4プラットフォームに取引シグナルを直接コピーできる最先端のユーティリティです。この堅牢なソリューションは、比類のない精度とカスタマイズオプションにより、シグナルのシームレスな実行を保証し、時間を節約し、効率性を向上させます。 [ Instructions and DEMO ] 主な特徴 直接的なTelegram API統合 電話番号とセキュアコードで認証します。 ユーザーフレンドリーな EXE ブリッジを使用して、チャット ID を簡単に取得および管理します。 複数のチャネル/チャットを追加、削除、更新して、同時に信号をコピーします。 高度なフィルターによる信号解析 カスタム例外語 (例: 「レポート」、「概要」) を含む不要な信号をスキップします。 柔軟な SL および TP 形式 (価格、ピップ、ポイント) をサポートします。 シグナルが価格ではなくポイントを指定する場合、エントリ ポイントを自動
    Copy Cat More Trade Copier MT4 (コピー猫MT4) は単なるローカル取引コピーツールではなく、現代の取引課題に対応するために設計された完全なリスク管理と実行フレームワークです。Propファームのチャレンジから個人の資産管理まで、強力な実行力、資金保護、柔軟な設定、高度な取引処理を組み合わせ、あらゆる状況に適応します。 このコピーツールは Master(送信側) と Slave(受信側) の両モードで動作し、成行注文や指値注文のリアルタイム同期、取引修正、部分決済、Close By 操作をサポートします。デモ口座・リアル口座の両方に対応し、取引用パスワードまたは投資家パスワードでも利用可能です。Persistent Trade Memory 技術により、EA・ターミナル・VPS が再起動しても復元可能です。複数の Master と Slave を同時に管理でき、ブローカー間の違いはプレフィックス/サフィックスの自動調整やシンボルマッピングで処理されます。 マニュアル/設定: Copy Cat Trading Copier マニュアル Copy Cat Mo
    これは、トレンドラインPROインジケーターの自動パラメータオプティマイザです 簡単かつ迅速に、あなたのお気に入りのトレンドラインプロインジケーターに最適なパラメータを選択します。 最適化には数秒しかかかりません。 オプティマイザでは、振幅、TP1-TP3、StopLoss、および選択した履歴セクション(日)の時間フィルタとHTFフィルタの値など、各ペアと期間に最適なパラメータを見つ 異なる時間枠を最適化するには、異なる範囲の履歴が必要です: M5-M15計算範囲パラメータ(日)=60(三ヶ月)を設定します。 M30-H1計算範囲パラメータ(日)=120(6ヶ月)を設定します。 H4パラメータの計算範囲(日数)を設定する=240(1年) D1-W1パラメータ計算範囲(日)=720(三年)を設定します。 MN1パラメータ計算範囲(日)=1200(五年)を設定します。 最適化後、パラメータはmql4>Files>T R E N D Lineoptimizedsettingsフォルダ内の既製のセットファイルに自動的に保存されます オプティマイザユーティリティの使用方法: 最適化
    VirtualTradePad mt4 Extra
    Vladislav Andruschenko
    4.85 (61)
    ワンクリックで取引できるトレーディングパネル。ポジションと注文の操作!チャートまたはキーボードから取引。 手動取引用の取引パネル。チャート(チャートウィンドウ)またはキーボードから取引できます。開閉、リバース、ロックポジションと注文を処理する МetaТrader4のメインオーダーのトレーディングコントロールパネル:売買、売却、売却、売却、売却、閉じる、削除、修正、トレーリングストップ、ストップロス、takeproft MT5のバージョン 完全な説明   +DEMO +PDF 購入する方法 インストールする方法     ログファイルの取得方法     テストと最適化の方法     Expforex のすべての製品 シンボルウィンドウからの取引とキーボードからの取引! あなたはMetaTrader 4ターミナル - バーチャルコントロールパネルVirtualTradePadのためのユニークなプラグインを持っています。 Description on English 注意!  ストラテジーテスターの 取引方法を学びたい場合は、無料の TesterPad ユーティリティをチェックしてくだ
    EchoTrade Telegram to MT5 Copier Seamless, Instant, and Reliable Signal Copying - Direct from Telegram to MetaTrader 4! The product does not run in the strategy tester but you can get free trial version   here  for testing before purchase. Tired of manually executing trades from Telegram signals? EchoTrade automates the process, instantly copying trades from any Telegram channel or group directly into your MT5 account—accurately, efficiently, and without delay. Key Features: Universal Compatib
    Tired of complex order placement and manual calculations? Trade Dashboard is your solution. With its user-friendly interface, placing orders becomes effortless, by a single click, you can open trades, set stop loss and take profit levels, manage trade lot size, and calculate risk to reward ratios, allowing you to only focus on your strategy. Say goodbye to manual calculations and streamline your trading experience with Trade Dashboard. Download  Demo Version  right now. You can find  Details of
    MT4 to Discord Signal Provider は、Discord へ直接トレーディングシグナルを送信するために設計された、使いやすく完全にカスタマイズ可能なユーティリティです。このツールは、あなたのトレーディングアカウントを効率的なシグナルプロバイダーに変えます。 スタイルに合わせてメッセージフォーマットをカスタマイズ!利便性を考え、事前にデザインされたテンプレートから選択し、メッセージのどの要素を含めるか除外するかを選択できます。 [ デモ ] [ マニュアル ] [ MT5 バージョン ] [ Telegram バージョン ]  New: [ Telegram To MT5 ] セットアップ 簡単なセットアップのために、私たちの詳細な ユーザーガイド に従ってください。 Discord API の事前知識は必要ありません。必要なツールはすべて提供されます。 主な特徴 購読者の更新のための注文詳細をカスタマイズ。 ブロンズ、シルバー、ゴールドなど、各レベルで異なるシグナルアクセスを提供する階層的サブスクリプションモデルを実装。 注文が実行されたチャートのスクリーン
    利益追跡機能により、MetaTrader 4で総利益/損失に達した時にポジションをクローズします。 仮想ストップ(個別注文) を有効にできます。 買いと売りのポジションを別々に計算してクローズ(別々の買い/売り) します。 すべてのシンボルまたは現在のシンボルのみをクローズして計算(すべてのシンボル) します。 利益追跡(トレーリング・プロフィット) を有効にします。 預金通貨、ポイント、残高の%で総利益または損失をクローズします。 このアプリケーションは、他のEAと一緒に、または手動取引と組み合わせて、任意のアカウントで使用するために設計されています。 MT5 のバージョン 完全な説明 +DEMO +PDF 購入する方法 インストールする方法 ログファイルの取得方法 テストと最適化の方法 Expforex のすべての製品 取引ペアの全てまたは一部の合計バランスが設定された値以上になった時点で、すべてのポジションがクローズされ、注文が削除されます。 このバージョンは、指定された利益レベルでポジションをクローズできるだけでなく、より良い結果を得るために利益を追跡することも可能です。 C
    Comprehensive on chart trade panel with the unique ability to be controllable from mobile as well. Plus has a library of downloadable configuration, e.g. exit rules, extra panel buttons, pending order setup and more. Please see our product video. Works with all symbols not just currency pairs. Features On chart panel plus controllable from free app for Windows, iPhone and Android Built-in script engine with library of downloadable configuration, e.g. add 'Close All Trades in Profit' button, exit
    MT4 Professional Copy Trading System(MT4版) 工業レベルの超高速 LOCAL トレードコピア 。プロトレーダー/シグナル提供者/複数口座運用向け。 LOCALアーキテクチャ(高速・安定) 同一 Windows 環境(同一PC / 同一Windows VPS)で動作。低遅延・高同期・24/7運用。 Master / Slave / Self + Cross Copy(MT4 ↔ MT5) Master / Slave / Self-Copier 対応。 MT4→MT4、MT4→MT5、MT5→MT4、MT5→MT5。 重要:MT4↔MT5 は MT4版+MT5版の両方 が必要。 機能概要 Master の注文をリアルタイム複製(新規/変更SL・TP/決済)。ブローカー接頭辞/接尾辞のシンボル差も自動対応。 主な特長 超高速複製/ロット管理(固定・倍率・Balance/Equity比)/シンボルマッピング/任意のリスク保護/長期安定(ログ・整合性チェック)。
    Riskless Pyramid
    Snapdragon Systems Ltd
    5 (1)
    Introduction This powerful MT4 trade mangement EA offers a way potentially to aggressively multiply trade profits in a riskfree manner. Once a trade has been entered with a defined stoploss and take profit target then the EA will add three pyramid add-on trades in order to increase the overall level of profit. The user sets the total combined profit target to be gained if everything works out. This can be specified either as a multiple of the original trade profit or as a total dollar amount. Fo
    TradeMirrorはMT4/MT5プラットフォーム用のトレードコピーEAです。 なぜTradeMirrorなのか 私たちは、金融ソフトウェアのセキュリティ、安定性、プライバシーの重要性を理解しています: 操作しやすいグラフィカル・インターフェースを提供 プライバシーとセキュリティに重点を置き、注文の分配にプライバシー要件がある様々な金融シナリオに適している。 注文の正確な複製、ミリ秒単位の配信 フルプラットフォーム、MT4またはMT5をサポート; システムの状態をインテリジェントに認識し、電子メールによる通知でトランザクションのセキュリティを保護します。 コア機能リスト フォローアップ・ソフトウェアは、機能が多ければ多いほど良いというものではないので、厳密な需要分析の結果、プログラムを合理化し、最終的に以下のコア機能を維持した: 複数のコネクション メール通知 ロットスケーリング 信号フィルタリング 以下、逆順 テイクプロフィット/ストップロスのリセット 無料デモ Trademirrorを購入する前に、いつでも無料デモをお試しいただけます: このページの 無料デモ  ボタンをクリッ
    Eezeorder 2
    Tawanda Tinarwo
    5 (2)
    NEW VERSION!  NB: IF YOU ARE USING A VERY HIGH RESOLUTION MACHINE AND THE EA DISPLAY LOOKS TOO SMALL, CONTACT ME SO I CAN HELP YOU. Open Multiple Trades on MT4 in 1 click at one price. Enter the Lot size Specify the number of trades you want to open Choose whether you want TP SL or Trailing Stop Once you are done, click Buy or Sell Open Multiple Pending Orders on MT4 in 1 click at one price. Enter the Lot size Specify the gap from the current price, where you want to place the pending order Spe
    Measures the length of the selected movement in points, shows the duration of the movement, as well as the speed of movement.   Outputs the average value of each dimension. It is designed to calculate the expected target based on typical market movements. The intended goal will provide information about the ratio of the stop size to the possible profit and will allow you not to open positions with a small expected profit. It will also help you determine the point at which it is more logical to c
    Equity Protect Pro: 安心取引のための総合的な口座保護エキスパート 口座保護、資産保護、ポートフォリオ保護、マルチ戦略保護、利益保護、利益確定、取引セキュリティ、リスク管理プログラム、自動リスク管理、自動決済、条件付き決済、スケジュール決済、動的決済、トレーリングストップロス、ワンクリッククローズ、ワンクリック決済、ワンクリック復元などの機能をお探しなら、Equity Protect Pro が最適なプログラムです。 設定は簡単で、事前設定された条件に達すると、すべてのチャートを閉じることができ、シグナルサブスクリプションのキャンセルもサポートします(これは、すべての取引プログラムも停止することを意味します)。この時点で、新しい注文は生成されなくなり、最終的にすべての注文が閉じられ、予期せぬ損失を効果的に防止し、安心して取引できるようになります。 Equity Protect Pro (Technical Manual) Equity Protect Pro Demo Version for yo u to test   Equity Protect Pro MT4
    作者のその他のプロダクト
    如果产品有任何问题或者您需要在此产品上添加功能,请联系我 Contact/message me if you encounter any issue using the product or need extra feature to add on the base version. Close Button provides you an intuitive, effective, and handy way to close your orders based on their type. The utility provides seven close options: Close All: close all orders, including trading and pending ones. Close Profit: close all orders which are in profit. Close Loss: close all orders which are in loss. Close Stop: close all stop orders. Close L
    FREE
    如果产品有任何问题或者您需要在此产品上添加功能,请联系我 Contact/message me if you encounter any issue using the product or need extra feature to add on the base version. You can get the free Close Button MT4 version at LINK . Close Button provides you an intuitive, effective, and handy way to close your orders and/or positions based on their type and their profit status. The tool provides seven close options: Close All: close all pending orders and positions. Close Profit: close all positions which are in profit. Close L
    FREE
    如果产品有任何问题或者您需要在此产品上添加功能,请联系我 Contact/message me if you encounter any issue using the product or need extra feature to add on the base version. PA Touching Alert is a tool to free you from watching price to touch certain critical price levels all day alone. With this tool, you can set two price levels: upper price and lower price, which should be greater than/less than the current price respectively. Then once price touches the upper price or lower price, alert and/or notification would be sent
    FREE
    如果产品有任何问题或者您需要在此产品上添加功能,请联系我 Contact/message me if you encounter any issue using the product or need extra feature to add on the base version. There is Demo version of this panel Dashboard Babon Scalping System MT5 Demo in my product list, please try it out to get familiar with all functionalities for free. Free version: LINK MT4 version: LINK This system basically utilizes TDI, Heiken Ashi Trend, Price Trend on H1 time-frame and TMA on H1&H4 time-frame to generate the trend (big picture). Then
    如果产品有任何问题或者您需要在此产品上添加功能,请联系我 Contact/message me if you encounter any issue using the product or need extra feature to add on the base version. Floating Highest Lowest MT5 provides you an intuitive and user-friendly method to monitor the floating highest (profit) and lowest (loss) that all your trades together ever arrive. For example, I opened 3 orders, which arrived at $4.71 floating profit when trade following trend. Later when the trend is against me, these 3 orders arrive $30 in loss, and a
    FREE
    如果产品有任何问题或者您需要在此产品上添加功能,请联系我 Contact/message me if you encounter any issue using the product or need extra feature to add on the base version. Indicator Floating Highest Lowest provides you an intuitive, and user-friendly method to monitor the floating highest (profit) and lowest (loss) that all your trades together ever arrive. For example, I opened 3 orders, which arrived at $4.71 floating profit when trade following trend. Later when the trend is against me, these 3 orders arrive $30 in loss
    FREE
    如果产品有任何问题或者您需要在此产品上添加功能,请联系我 Contact/message me if you encounter any issue using the product or need extra feature to add on the base version. PA Touching Alert is a tool to free you from watching price to touch certain critical price level all day alone. With this tool, you can set two price levels: upper price and lower price, which should be greater than/ less than the current price respectively. Then once price touches the upper price or lower price, alert and/or notification would be sent
    FREE
    如果产品有任何问题或者您需要在此产品上添加功能,请联系我 Contact/message me if you encounter any issue using the product or need extra feature to add on the base version. Session TakeProfit StopLoss is basically helping to set the take profit and stop loss in dollar for the total open orders (session). Once the total profit is greater than session_tp or less than session_sl, the EA will help to close all open orders acting similarly to a take profit/stop loss for a single order. Inputs session_tp: session take profit ses
    FREE
    By applying this expert onto any char window, you are able to force download the historical data upon all time-frame (PERIOD_M1, PERIOD_M5, PERIOD_M15, PERIOD_M30, PERIOD_H1, PERIOD_H4, PERIOD_D1, PERIOD_W1, PERIOD_MN1) of 28 major pairs. The 28 major pairs are the combination of the 8 major currencies. 8 major currencies "USD", "EUR", "GBP", "JPY", "AUD", "NZD", "CAD", "CHF" 28 pairs "AUDCAD","AUDCHF","AUDJPY","AUDNZD","AUDUSD","CADCHF","CADJPY" "CHFJPY","EURAUD","EURCAD","EURCHF","EURGBP","E
    FREE
    如果产品有任何问题或者您需要在此产品上添加功能,请联系我 Contact/message me if you encounter any issue using the product or need extra feature to add on the base version. Dashboard Super Candle is an intuitive, and handy graphic tool to help you to: Have 28 pairs under control with one dashboard. Monitor candle direction, identify possible price movement and trend. Provide trading signals based on the candle direction selected by you. Automatically manage order once signal are generated. Have the ability to select which p
    如果产品有任何问题或者您需要在此产品上添加功能,请联系我 Contact/message me if you encounter any issue using the product or need extra feature to add on the base version. There is Demo version of this panel Dashboard Super MA RSI CCI Demo in my product list, pls try it out to get familiar with all functionalities free . Dashboard Super MA RSI CCI is an intuitive, and handy graphic tool to help you to: Have 28 pairs under control with one dashboard Monitor price movement, identify possible trend based on MA, RSI, and CCI i
    如果产品有任何问题或者您需要在此产品上添加功能,请联系我 Contact/message me if you encounter any issue using the product or need extra feature to add on the base version. Critical Support and Resistance is an intuitive, and handy graphic tool to help you to monitor and manage critical support and resistance price point easily with one glance to know status of all important S&R. Price is likely to pullback or breakout at important support and/or resistance. This indicator is designed to help you monitor these critical supp
    如果产品有任何问题或者您需要在此产品上添加功能,请联系我 Contact/message me if you encounter any issue using the product or need extra feature to add on the base version. Dashboard Super Currency Strength is an intuitive, and handy graphic tool to help you to: Have 28 pairs under control with one dashboard. Monitor price movement, identify possible trend based on currency strength gap of two currency on 3 timeframe. Provide trading signals based on the CSM (currency Strength Meter) selected. Manage order automatically onc
    如果产品有任何问题或者您需要在此产品上添加功能,请联系我 Contact/message me if you encounter any issue using the product or need extra feature to add on the base version. To access the free demo version, please re-direct to this LINK . To access the single pair version, please re-direct to this LINK . Price is likely to pullback or breakout at important support and/or resistance. This dashboard is designed to help you monitor these critical support and resistance area. Once price moves close to these important support and
    如果产品有任何问题或者您需要在此产品上添加功能,请联系我 Contact/message me if you encounter any issue using the product or need extra feature to add on the base version. Please re-direct to LINK for free demo version. There are two critical components in a profitable trading system, one is entry (place an order), and another one is exit (close an order). You can exit by time: closing order after London Close for example. You can also exit by position: closing an order when price reaches a certain support/resistance level
    Contact/message me if you encounter any issue using the product or need extra feature to add on the base version. There is a demo version of this panel Dashboard Trading Made Simple Demo in my product list, please try it out to get familiar with all functionalities free, LINK . This system basically utilizes TDI as the main indicator to generate trading signal mainly on H1 and H4 timeframes. The signal will be further filtered and trimmed. Stochastic; Heiken Ashi candle direction and candle siz
    如果产品有任何问题或者您需要在此产品上添加功能,请联系我 Contact/message me if you encounter any issue using the product or need extra feature to add on the base version. There is a Demo version of this panel Dashboard Currency Strength Meter AdvancedDemo in my product list, please try it out to get familiar with all functionalities free, LINK . The Dashboard Currency Strength Meter Advanced gives you a quick visual guide to which currencies are strong, and which ones are weak over the customized 4 time-frames and period.
    如果产品有任何问题或者您需要在此产品上添加功能,请联系我 Contact/message me if you encounter any issue using the product or need extra feature to add on the base version. There is Demo version of this panel Dashboard Super Three MA Demo in my product list, please try it out to get familiar with all functionalities free, LINK . This system basically utilizes PA and three adjustable Moving Average as the main indicator set to generate trading signal. With the feature that all MA_timeframe, MA_period, MA_applied_price are ad
    如果产品有任何问题或者您需要在此产品上添加功能,请联系我 Contact/message me if you encounter any issue using the product or need extra feature to add on the base version. There is Demo version of this panel Dashboard Timeframe 15 Demo in my product list, please try it out to get familiar with all functionalities free, LINK . This system basically utilizes TDI as the core indicator to generate trading signal mainly on time-frame M15. The signal will be further filtered and trimmed by 1) 200 EMA and Price; 2) 10 EMA and Hei
    如果产品有任何问题或者您需要在此产品上添加功能,请联系我 Contact/message me if you encounter any issue using the product or need extra feature to add on the base version. There is Demo version of this panel Dashboard Genesis Matrix Trading Demo in my product list, please try it out to get familiar with all functionalities free, LINK . This system basically utilizes Genesis Indi Set (TVI, CCI, GannHilo, and T3) as the core indicators to generate trading signal mainly on time-frame M15. The signal will be further filtered a
    如果产品有任何问题或者您需要在此产品上添加功能,请联系我 Contact/message me if you encounter any issue using the product or need extra feature to add on the base version. There is Demo version of this panel Dashboard Symphonie Trader System Demo in my product list, please try it out to get familiar with all functionalities free, LINK . This system basically utilizes Symphonie Indicator Set (Extreme, Emotion, Trend, and Sentiment) as the core indicators to generate trading signal mainly on time-frame M15. The signal will b
    如果产品有任何问题或者您需要在此产品上添加功能,请联系我 Contact/message me if you encounter any issue using the product or need extra feature to add on the base version. There is Demo version of this panel Dashboard Extreme TMA System Demo in my product list, please try it out to get familiar with all functionalities free, LINK . This system basically utilizes 4 TMA (Triangular Moving Average) slope indicators on 4 time-frame and TMA Band as the core indicators to generate trading signal mainly on time-frame M15. The sig
    如果产品有任何问题或者您需要在此产品上添加功能,请联系我 Contact/message me if you encounter any issue using the product or need extra feature to add on the base version. DIBS = Daily Inside Bar Setup This system basically utilizes the popular candle pattern Inside Bar to generate trading signal mainly on time-frame H1. To facilitate you to understand and trade this system quickly and effectively, the collection of PDF manuals and tips are provided in my latest comment of this product. For who cannot access Google Drive,
    如果产品有任何问题或者您需要在此产品上添加功能,请联系我 Contact/message me if you encounter any issue using the product or need extra feature to add on the base version. This system basically utilizes two simple moving averages (10 SMA and 197 SMA) over 2 hours before Tokyo Open to generate trading signal mainly on timeframe H1. The signal will be further filtered by 1) M15 and M5 Fractals; 2) Stochastic To facilitate you to understand and trade this system quickly and effectively, the collection of PDF manuals and tips
    如果产品有任何问题或者您需要在此产品上添加功能,请联系我 Contact/message me if you encounter any issue using the product or need extra feature to add on the base version. There is Demo version of this panel Dashboard Babon Scalping System Demo in my product list, please try it out to get familiar with all functionalities for free, LINK . This system basically utilizes TDI, Heiken Ashi Trend, Price Trend on H1 time-frame and TMA on H1&H4 time-frame to generate the trend (big picture). Then the system will zoom in to genera
    This indicator helps to visualize the Bollinger Band status of 28 pairs. With the feature of color panel, alert, and notification features, user can catch the potential Bollinger Bounce opportunities from 28 main pairs on one Dashboard quickly. Dashboard Bollinger Band is an intuitive and handy graphic tool to help you to monitor all 28 pairs and provide trading signals based on the Bollinger Bounce Rules (Overbought/Oversold and Bollinger Band Cross). COLOR LEGEND: clrOrange: price is above the
    This indicator helps to visualize the Stochastic status of 28 pairs. With the feature of color panel, alert, and notification features, user can catch the potential buy and sell opportunities when the 28 main pairs cross the oversold/overbought area on one Dashboard quickly. Dashboard Stochastic is an intuitive and handy graphic tool to help you to monitor all 28 pairs and provide trading signals based on the Stochastic Classic Rules (Overbought/Oversold and Stochastic Cross). COLOR LEGEND: cl
    This indicator helps to visualize the RSI status of 28 pairs. With the feature of color panel, alert, and notification features, user can catch the potential buy and sell opportunities when the 28 main pairs cross the oversold/overbought area on one Dashboard quickly. Dashboard RSI is an intuitive and handy graphic tool to help you to monitor all 28 pairs and provide trading signals based on the RSI Rules (Overbought/Oversold and Stochastic Cross). COLOR LEGEND: clrOrange: RSI signal is above th
    This indicator helps to visualize the MACD status of 28 pairs. With the feature of color panel, alert, and notification features, user can catch the potential buy and sell opportunities when the 28 main pairs’ fast EMA cross the slow EMA on one Dashboard quickly. Dashboard MACD is an intuitive and handy graphic tool to help you to monitor all 28 pairs and provide trading signals based on the MACD Rules (Fast EMA Cross Slow). COLOR LEGEND: clrRed: MACD fast EMA down cross MACD slow EAM and MACD f
    フィルタ:
    レビューなし
    レビューに返信