Multiple Timeframe Filtered MA Crossover Indicator

BEFORE YOU PURCHASE — PLEASE READ

A free version of this indicator is available. Please purchase this paid version only if you want complete control over how the moving averages are configured, or if you simply want to support my work.

The default settings are examples only and are not guaranteed to make money. You should already have a moving-average strategy that you have tested and believe works for you. This indicator is a tool for applying that strategy without constant chart monitoring.


WHAT IS DIFFERENT ABOUT THE PAID VERSION

The free version uses a fixed library of pre-built moving averages. You select an MA such as EMA 14 or WMA 100 from a dropdown.

The paid version removes that limitation. Every MA used by the indicator — crossover MAs, validation MAs, and higher-timeframe trend-filter MAs — is fully configurable.

For every MA you can set:
• Period — any integer, such as 7, 14, 100, 350 or 999
• Shift — forward/backward shift, default 0
• Method @ Applied Price — one dropdown combining 4 smoothing methods and 7 price types (28 combinations)

Smoothing methods:
• Simple (SMA)
• Exponential (EMA)
• Smoothed (SMMA)
• Linear Weighted (LWMA)

Applied prices:
• Close
• Open
• High
• Low
• Median Price (HL/2)
• Typical Price (HLC/3)
• Weighted Close (HLCC/4)

This lets you configure combinations such as EMA 200 on High, SMA 55 on Typical Price, or LWMA 13 on Weighted Close — or create your own combination directly from the indicator inputs.

Everything else — signal timing, arrows, alerts, MTF RSI, MTF MACD, the previous-candle Fibonacci/price filter, and trading periods — works as in the free version.

WHAT MAKES THIS INDICATOR DIFFERENT

Most MA crossover indicators simply watch two MAs and fire an arrow whenever they cross. They do not necessarily consider market structure, higher-timeframe direction, momentum, or where price is trading.

This indicator is built around a different idea: a crossover can be filtered by the context surrounding it.

You can:
• Use up to 11 configurable MAs on the signal timeframe and require them to be in a specific order.
• Filter signals using an MA trend structure from another timeframe.
• Require MTF RSI and/or MACD conditions.
• Require the crossover to occur inside a defined Fibonacci/price zone based on the previous higher-timeframe candle.
• Restrict signals to selected trading periods.

Enable as many or as few filters as your strategy requires. The goal is not to produce more arrows, but to let you define exactly which conditions a signal must satisfy.

CLEAN CHART DESIGN

The indicator does not draw the moving averages that drive its calculations. It draws only the signal arrows you choose to display. This keeps the chart clean for price action, trendlines, order blocks, other indicators, and other analysis.

If you want to see the MAs, add them manually using the same period, shift, method, and applied price configured in the indicator. You can then save them in a chart template and restore them with one click.

This also gives you a simple way to visually verify the indicator: you can see the actual MA crossover and confirm that the corresponding arrow/alert appears where expected.

HOW THE INDICATOR WORKS

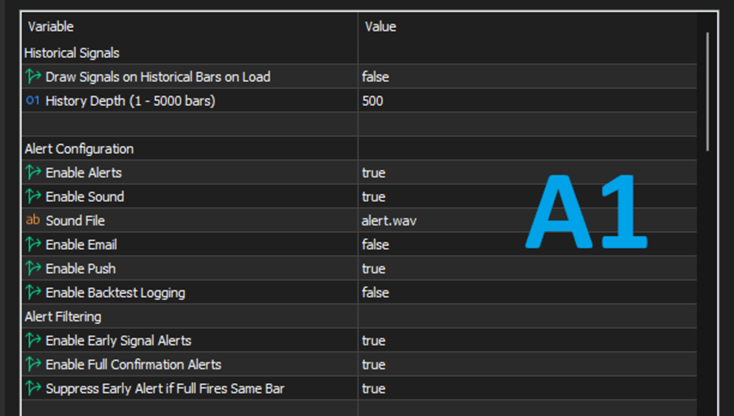
  1. ALERT CONFIGURATION (Image A1)

Each alert type can be enabled independently:
• Enable Alerts — pop-up alert window
• Enable Sound — plays your selected .wav file
• Enable Email — sends to your terminal-configured email
• Enable Push — sends to the MetaTrader mobile app
• Enable Backtest Logging — writes diagnostic values to the Experts log for tuning

  1. ALERT FILTERING

• Enable Early Signal Alerts
• Enable Full Confirmation Alerts
• Suppress Early Alert if Full Fires Same Bar — if Early and Full fire on the same bar in the same direction, only the Full alert is sent.

  1. ARROW APPEARANCE

• Draw Arrows — No Arrows, Early + Full Signals, or Full Signals Only
• Arrow Size — 1 to 5
• Arrow Distance from Candle — pixel offset

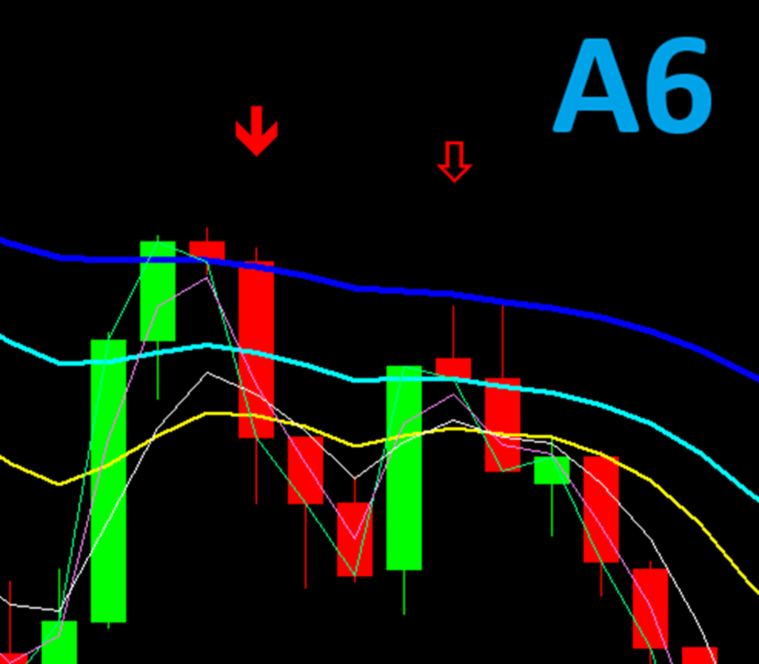
Image A6—Screenshot showing the indicator's arrow appearance, with the hollow arrows representing the early signals and the full body colored arrows representing full signals.

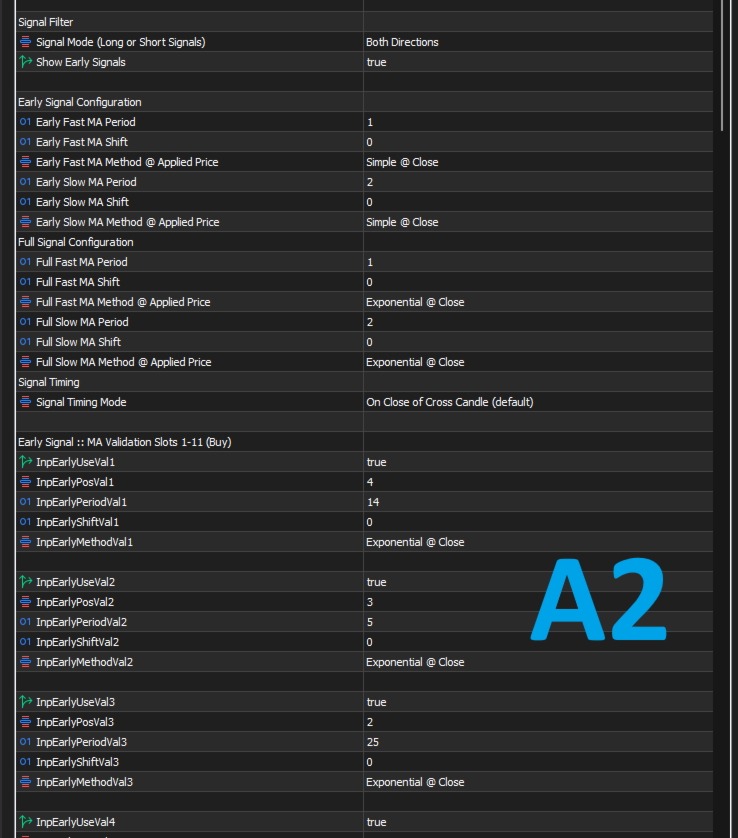
  1. SIGNAL FILTER (Image A2)

• Signal Mode — Long Only, Short Only, or Both Directions
• Show Early Signals — master switch for the Early subsystem

  1. EARLY SIGNAL CONFIGURATION

The Early signal detects the crossover earlier in its development, before the full validation stack has necessarily aligned. It provides an early indication that a Full signal may be forming.

Configure:
• Early Fast MA Period
• Early Fast MA Shift
• Early Fast MA Method @ Applied Price
• Early Slow MA Period
• Early Slow MA Shift
• Early Slow MA Method @ Applied Price

All six inputs are fully configurable. For example, you can use 1 SMA crossing 2 SMA, 9 EMA crossing 21 EMA, or 8 EMA on High crossing 21 LWMA on Typical Price.

  1. FULL SIGNAL CONFIGURATION

The Full signal is the confirmed crossover. It fires only when the crossover occurs and all enabled validation/filter conditions agree.

Configure:
• Full Fast MA Period
• Full Fast MA Shift
• Full Fast MA Method @ Applied Price
• Full Slow MA Period
• Full Slow MA Shift
• Full Slow MA Method @ Applied Price

The Full pair can be completely different from the Early pair, allowing a two-stage system: an aggressive Early crossover followed by a stricter Full confirmation.

  1. SIGNAL TIMING

• Intrabar — detects signals on the live, still-forming candle. This is the fastest but noisiest mode because the candle can change. Alerts fire, but arrows are not drawn.
• On Close of Cross Candle (default) — detects the signal after the crossover candle closes. Arrows are drawn and the signal does not repaint.
• One Candle After Close — the crossover must have occurred on the previous closed candle and the relationship must still hold on the current closed candle. This filters crosses that immediately reverse.

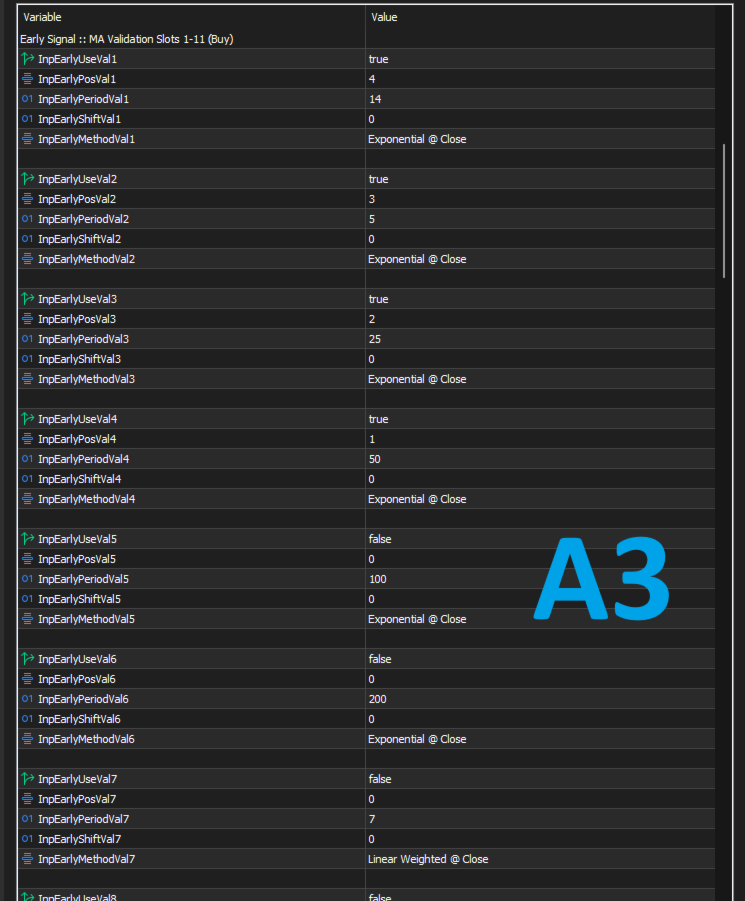
  1. MA VALIDATION ORDER — THE HEART OF THE INDICATOR (Image A3 & Image A6)

There are two validation sections:
• Early Signal :: MA Validation Slots 1–11 (Buy)
• Full Signal :: MA Validation Slots 1–11 (Buy)

Each section provides 11 configurable validation slots. Each slot has:
• Use Validation MA
• Validation MA Position — 0 to 11
• Validation MA Period
• Validation MA Shift
• Validation MA Method @ Applied Price

The Position number is not the MA period. It defines where that MA belongs in your required validation stack.

When a crossover occurs, the indicator checks the enabled MAs against the order you defined:
• Buy — MA values must be in strictly descending order.
• Sell — the same order is checked in reverse, so values must be strictly ascending.

If the required order is not present, the signal is rejected and no arrow/alert is generated.

EXAMPLE

You want a bullish stack to look like this on the chart:

text

EMA 14 (top — highest value) EMA 5 EMA 25 EMA 50 (bottom — lowest value)

You also want the early crossover to be 1SMA crossing 2 SMA  upwards for bullish  signal and 1EMA crossing 2EMA upwards for full confirmation signal.

You would set:

MA Enable Position
EMA 14 yes 4
EMA 5 yes 3
EMA 25 yes 2
EMA 50 yes 1

The indicator sorts these by position, giving [EMA 14, EMA 5, EMA 25, EMA 50] . For a Buy signal it then requires:

MA Order => EMA 14 > EMA 5 > EMA 25 > EMA 50

If that chain holds at the moment of the crossover, the Buy is valid. If EMA 14 pokes above EMA 5, or EMA 25 above EMA 14, the signal is discarded.

Image A3 — showing the indicator's MA validation ordersettings input section on the indicator's menu.

Image A6 — showing how the given example above would look like for a bearish signal. The thick dark blue line at the top is the 50 EMA and the blue aqua line following beneath it is the 25 EMA, followed by 5 EMA which is a thin white line then lastly followed by 14 EMA which is the yellow line. The green and purple lines crossing each other are 1 EMA and 2 EMA respectively. There aren't any visible moving averages on the chart representing 1 SMA and 2 SMA.

Note: If you want to include the moving averages involved in the crossover on the MA validation order section, you can but only the Slow MA, if you include the fast MA asa well, the logic would not work.

This validation layer is designed to reduce signals during choppy conditions where MAs repeatedly cross and tangle. You can use only a few MAs for a looser filter or up to 11 for a stricter structure.

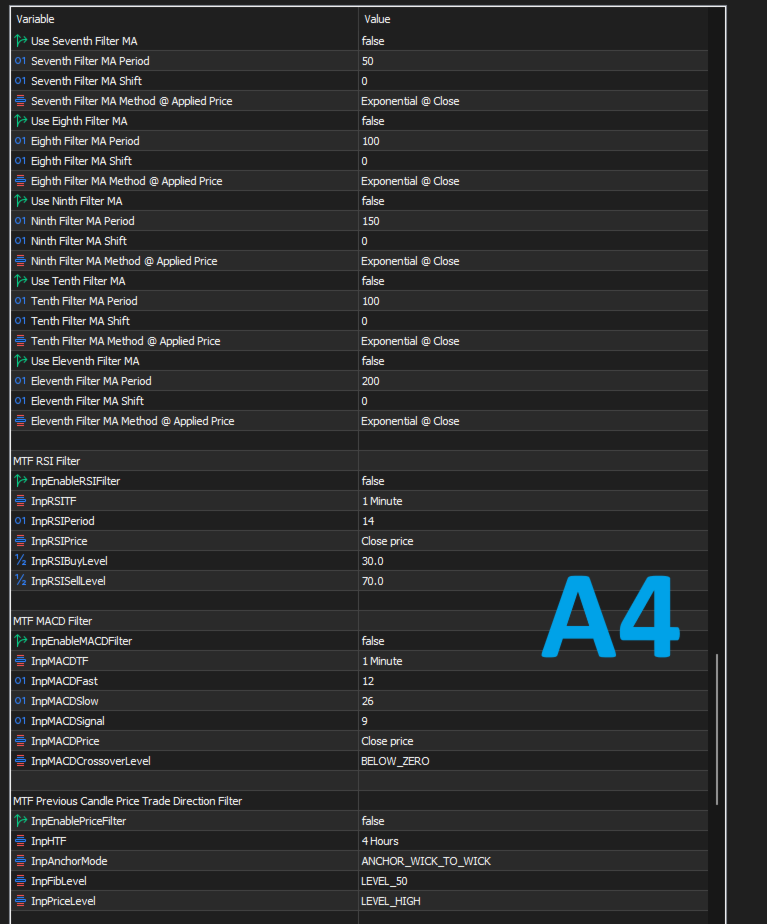
  1. SIGNALS BY MARKET DIRECTION — MTF MA TREND FILTER (Image A4)

This filter checks the trend structure on another timeframe. It is separate from the validation stack, which checks the current signal timeframe.

Settings:
• Enable Signals by Trend Direction Only
• Filter Mode:

  • Include Price — Buy requires Price > MA1 > MA2 > ... > MA11

  • MA Only — requires MA1 > MA2 > ... > MA11 and ignores price
    • MA(s) Filter Timeframe — the timeframe used for the trend filter

Up to 11 filter MAs can be configured, each with:
• Use Filter MA
• Period
• Shift
• Method @ Applied Price

Example: If you trade M5 but want signals only in the H1 trend direction, set the filter timeframe to H1 and configure your H1 MAs. An M5 Buy that conflicts with the H1 structure is rejected.

  1. MTF RSI FILTER

RSI can be evaluated on a different timeframe from the chart.

Settings:
• Enable RSI Filter
• RSI Timeframe
• RSI Period
• RSI Applied Price

• RSI Buy Threshold — Buy signals pass only when RSI is at or below this level (default 30)
• RSI Sell Threshold — Sell signals pass only when RSI is at or above this level (default 70)

  1. MTF MACD FILTER

MACD can also be evaluated on any selected timeframe.

Settings:
• Enable MACD Filter
• MACD Timeframe
• MACD Fast
• MACD Slow
• MACD Signal
• MACD Applied Price
• Crossover Level — Below Zero or Above Zero

Below Zero can be used for momentum reversals from lower levels, while Above Zero can be used for continuation within an established trend.

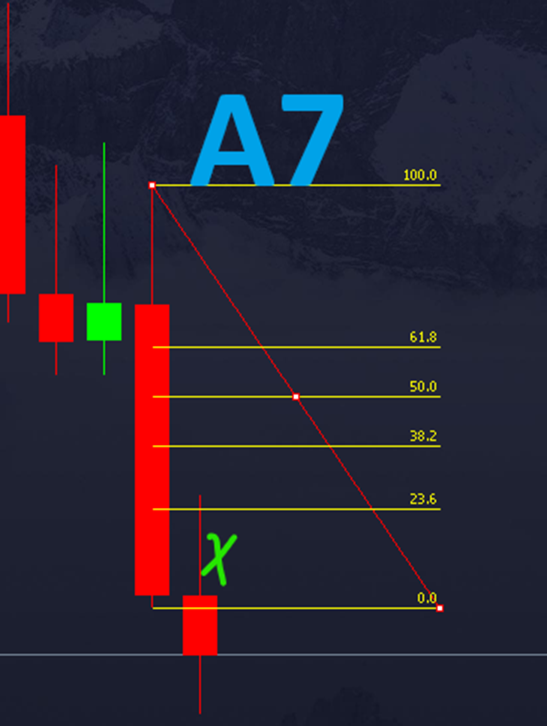
  1. MTF PREVIOUS CANDLE PRICE / FIBONACCI FILTER (Images A4, A7)

This optional filter uses the most recently completed higher-timeframe candle to define an acceptance zone. A crossover is accepted only when it occurs inside the zone you configure.

The filter is OFF by default. When enabled, a signal that does not satisfy its rules is rejected even if all other enabled filters agree.

CONFIGURATION

  1. Previous Candle Timeframe
    The timeframe whose most recently closed candle is used as the reference, typically H4, D1, or W1. It must be higher than the chart timeframe; a lower setting is blocked with an error.

  2. Fibonacci Anchor
    Choose how the Fibonacci range is anchored:
    • Wick to Wick — High (100%) to Low (0%), including wicks
    • '[ — top of body (100%) to bottom (0%), ignoring wicks

  3. Fibonacci Level
    Available levels:
    23.6%, 38.2%, 50.0%, 61.8%, 78.6%, 100.0%, and 107.0%.

The 107% level extends beyond the opposite extreme and can be used to include a sweep/stop-hunt area beyond the previous candle's high or low.

  1. Price Reference Level
    Choose Open, High, Low, or Close from the previous candle.

The selected Fibonacci price and Reference price form the acceptance zone. The indicator sorts the two prices automatically so the zone is always well-defined.

DIRECTION RULE

• Buy — the previous higher-timeframe candle must be bullish.
• Sell — the previous higher-timeframe candle must be bearish.

If the previous candle's direction does not match the signal direction, the signal is rejected before the zone is calculated.

EXAMPLE

For a bearish previous candle, the Fibonacci range can be drawn from its High (100%) to Low (0%). If a Sell crossover occurs inside the selected retracement zone, it can pass the filter. If a later crossover occurs after price has moved outside the permitted zone, it is rejected.

IMPORTANT: DIPS ARE FORGIVEN

The zone is checked at the moment the crossover occurs. Earlier price movement during the current period does not automatically disqualify the signal.

If you are new to this approach, example starting combinations are:
• H4 reference candle + M1 crossover signals
• D1 reference candle + M15 crossover signals
• W1 reference candle + H4 crossover signals

These are starting points, not fixed rules. You can combine any higher-timeframe reference candle with any lower signal timeframe, provided the reference timeframe is higher.

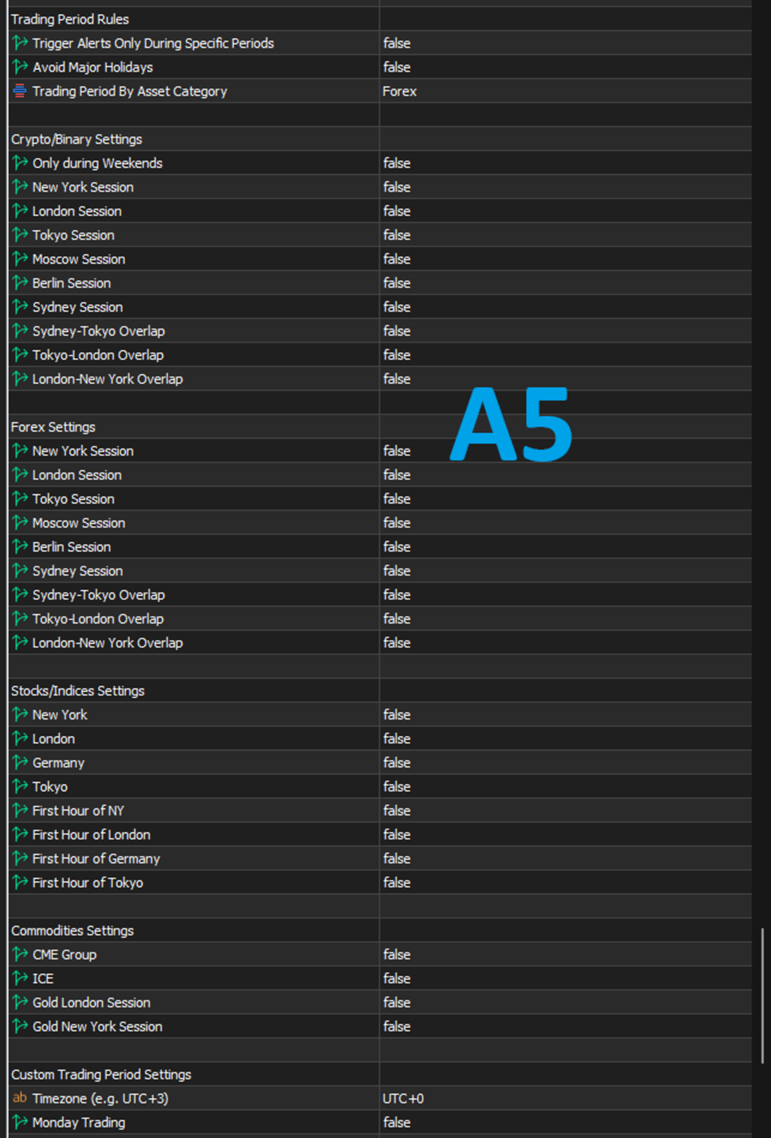
  1. TRADING PERIOD RULES

Restrict signals to selected hours or market sessions.

Options include:
• Trigger Alerts Only During Specific Periods
• Avoid Major Holidays — New Year, Christmas, US Independence Day, and US Thanksgiving
• Trading Period by Asset Category

Crypto / Binary:
• Includes a weekends-only option

Forex:
• New York, London, Tokyo, Moscow, Berlin, Sydney
• Sydney–Tokyo, Tokyo–London, and London–New York overlaps

Stocks / Indices:
• NYSE, LSE, FWB, and TSE sessions
• First-hour-after-open filters

Commodities:
• CME, ICE, London Gold, and New York Gold sessions

Custom:
• Day-by-day schedule with timezone offset, start hour, and end hour

SUMMARY — WHAT THE PAID VERSION ADDS

Compared with the free version, the paid version provides:

• Full control of every MA used by the indicator: period, shift, method, and applied price
• 28 Method @ Applied Price combinations for every configurable MA
• 11 configurable validation slots for Early signals
• 11 configurable validation slots for Full signals
• 11 configurable MTF trend-filter MA slots
• Flexible signal timing: Intrabar, On Close, or One Candle After Close
• Early and Full signal systems with independent MA configurations
• MTF RSI filter
• MTF MACD filter
• Previous higher-timeframe candle Fibonacci/price filter
• Configurable trading sessions and custom trading periods
• Alerts by pop-up, sound, email, and push notification
• Optional backtest/diagnostic logging
• Clean charts with the calculation MAs hidden

If the fixed MA library of the free version already meets your needs, the free version may be all you need. If you want to build your own exact MA configuration and control the validation and trend-filter structures — or simply want to support the work — this paid version gives you that flexibility.

IMPORTANT: This indicator is a technical tool, not financial advice and not a guarantee of profitable results. Test your configuration and understand the settings before using it in live trading.
추천 제품
This indicator works on atr with some edited . The AI ​​MACD FILTER indicator is used for confirmation. Certainly, the indicator contains an alert when the signal appears, and you use the exit of the deal on the saturation that occurs at the AI ​​MACD. The accuracy of the work is high on gold, the time frame is five minutes, while staying away from trading at the time of news that occurs on the US dollar. And using high liquidity trading times, which are two hours before the opening of the Lond
Introduction to Fractal Pattern Scanner Fractal Indicator refers to the technical indicator that makes use of the fractal geometry found in the financial market. Fractal Pattern Scanner is the advanced Fractal Indicator that brings the latest trading technology after the extensive research and development work in the fractal geometry in the financial market. The most important feature in Fractal Pattern Scanner is the ability to measure the turning point probability as well as the trend probabil
ACA Blackbird PRO MTF Market Scanner Institutional Smart Money Signal Engine | AI Confluence System         Your Ultimate Manual‑Trading Toolkit — Built for Real Traders, Not AI Consensus Hype or Dangerous Grid/Martingale Systems. TRADE WITH STRUCTURE — NOT GUESSWORK ACA Blackbird PRO is a professional-grade trading intelligence system built to detect, rank, and deliver high-probability trade setups in real time. This is not a basic indicator. It is a multi-timeframe Smart Money signal en
Pattern Builder Pro — MetaTrader 5용 커스텀 스윙 패턴 스캐너 Pattern Builder Pro는 트레이더가 원하는 스윙 패턴을 직접 손으로 그리고, Market Watch의 모든 심볼을 여러 타임프레임에 걸쳐 통계적으로 유사한 가격 형태를 스캔할 수 있게 해주는 MetaTrader 5 인디케이터 겸 마켓 스캐너입니다. 헤드앤숄더, 삼각형, 플래그 등 고정된 형태에 국한된 기존 차트 패턴 인디케이터와 달리, 이 MT5 패턴 인식 도구는 스윙 포인트 수와 형태에 제한 없이 자신만의 프라이스 액션 패턴을 정의할 수 있으며, Dynamic Time Warping(DTW)과 Procrustes 분석을 포함한 11개 가중치 지표로 구성된 유사도 엔진을 통해 실시간으로 일치하는 패턴을 찾아냅니다. 주요 기능: XY 그리드 기반의 인터랙티브 패턴 드로잉 보드 — 픽셀 단위로 스윙 포인트 배치 다중 지표 유사도 엔진: 기하학적 형태, 각도 시퀀스, 기울기, 되돌림 비율
Sloth Trader
Justus Wamswa Chemirmir
기관급 Smart-Money 개념을 거래하는 전문 Expert Advisor로, 다층 리스크 엔진을 갖추고 있습니다 — 규율 있고, 세션을 인식하며, 완전 자동화되어 있습니다. Sloth Trader — 기관급 Smart-Money 자동화 기관처럼 거래하세요 — 차트를 쳐다보지 않고도. Sloth Trader는 Smart-Money 방법론을 기반으로 구축된 완전 자동 Expert Advisor입니다. 10년의 시장 구조 연구를 하나의 규율 있는 로봇에 담아 시장을 스캔하고, 자체 거래 계획을 세우며, 모든 거래를 처음부터 끝까지 관리합니다. 이것은 지표도, 신호 서비스도, "설정하고 기도하는" 그리드도 아닙니다. 규칙 기반의 이벤트 중심 시스템으로, 자체 컨플루언스 엔진이 동의할 때만 행동하고, 그다음 기관급 리스크 관리로 당신을 보호합니다. 당신을 위해 하는 일 시장 구조 인텔리전스 기관 트레이더처럼 가격 행동을 읽습니다 고확률 기회 창이 활성화될 때만 거래합니다 — 죽은 시간대
HASuperTrendADX
Steven Wong Sing Seng
HA Supertrend ADX is a MetaTrader 5 trend Expert Advisor inspired by the TradingView Heikin Ashi Supertrend ADX concept. It combines Heikin Ashi candle alignment, Supertrend direction on HA prices, and an ADX strength filter. Features • Heikin Ashi trend confirmation • Supertrend on Heikin Ashi OHLC (TradingView-style) • ADX minimum threshold with optional DI+ / DI- filter • Supertrend flip exit and/or ATR trailing stop • Optional initial ATR stop loss • Margin cap and maximum lot limit • XAU
EventStraddle - 경제지표 발표를 사이에 둔 양방향 돌파 무엇을 하는가 지표 발표 몇 분 전에 현재가 위아래로 역지정가 주문을 동시에 걸고, 시장이 돌파한 쪽만 남기고 반대쪽은 취소한 뒤 ATR 기반 트레일링 스톱으로 끌고 갑니다. 그 외의 시간에는 거래하지 않습니다. 작동 방식 1. 발표 15분 전에 ATR(H1,14)를 읽어 ±1.0 ATR에 매수·매도 역지정가를 배치. 2. 각 주문의 손절은 진입가로부터 2.0 ATR. 3. 한쪽이 체결되면 반대쪽을 취소(OCO). 4. 평가익이 1.0 ATR에 도달하면 스톱이 가격을 0.5 ATR 뒤에서 추적. 5. 늦어도 24시간 후 청산. 발표 일정 일정은 EA에 내장되어 있습니다. 외부 파일도 인터넷 연결도 필요 없고, 판매자 로부터 계속 데이터를 받을 필요도 없습니다. 연준·ECB·영란은행·일본은행·호주 중앙은행·뉴질랜드중앙은행·캐나다중앙은행의 금리 결정과 미국 고용지표, 미국 CPI, 소매판매, 신규 실업수당, EI
제품명:   Breakthrough Tracker 트레이딩 시스템 핵심 포지셔닝 본 시스템은 수년간의 실전 트레이딩 경험을 바탕으로, 다양한 시장 환경에서 지속적으로 개선하고 최적화한 결과물입니다. 근본적인 목적은 방향성이 없는 횡보장에서 잦은 진입으로 인해 계좌가 잠식되는 만성적 문제점을 과감히 제거하는 데 있습니다. 핵심 로직은 한 문장으로 요약됩니다.   오직 돌파(breakout)에서만 매매하고, 절대 횡보(consolidation) 구간에는 참여하지 않는다.   복잡한 기술적 지표의 중첩을 배제하고, 의사 결정 과정을 간결하고 규칙 기반이며 반복 가능한 프레임워크로 압축하여, 어떤 시장 환경에서도 명확한 트레이딩 시각을 유지할 수 있도록 설계되었습니다. 적합 상품 및 시간대 본 시스템은 현물 금(XAUUSD) 및 주요 외환 통화쌍(EURUSD, GBPUSD, USDJPY 등)에 깊이 최적화되어 있으며, 여러 시간대에서도 호환됩니다. 단기 당일 매매(단타) 트레이더라면  
Automated Supply and Demand Tracker MT5. The following videos demonstrate how we use the system for trade setups and analysis.US PPI, Fed Interest Rates, and FOMC Trade Setup Time Lapse: U.S. dollar(DXY) and Australian dollar vs U.S. dollar(AUD/USD)  https://youtu.be/XVJqdEWfv6s  The EUR/USD Trade Setup time lapse 8/6/23.  https://youtu.be/UDrBAbOqkMY . US 500 Cash Trade Setup time lapse 8/6/23  https://youtu.be/jpQ6h9qjVcU .  https://youtu.be/JJanqcNzLGM ,  https://youtu.be/MnuStQGjMyg,&nbsp ;
Informative Trend
Vitalii Zakharuk
the fundamental technical indicator Informative Trend, which allows you to assess the current market situation in order to enter the market of the selected currency pair in a trend and with minimal risk. It basically uses the process of identifying the rate of change in price growth and allows you to find entry and exit points from the market. The indicator was created on the basis of the original indicators for searching for extreme points and is well suited for determining a reversal or a la
The  OBV MTF  is an Enterprise-grade On-Balance Volume indicator that transforms standard OBV into a complete trading system. It combines gradient-aware momentum analysis, divergence detection, multi-timeframe alignment, and dynamic customisable midpoint-filtering in a single intuitive professional volume analysis tool. Core Features 1. 5-State Momentum Engine Aqua (Strong Bullish) : OBV slope rising with positive acceleration SteelBlue (Weak Bullish) : OBV rising but losing momentum Gray (Neutr
Pure Diamond Trend Exhaustion Pure Diamond Trend Exhaustion 지표는 시장의 추세 소진 구간과 잠재적 가격 반전 지점을 식별하기 위해 설계되었습니다. 핵심 알고리즘은 가격의 극점과 캔들 꼬리 구조 분석을 기반으로 하며, 기존의 지연성 보조지표를 사용하지 않고도 유의미한 과매수 및 과매도 수준을 포착합니다. 기술적 특징: 신호 재분석 없음 (No Repaint): 지표 신호(다이아몬드)는 현재 캔들이 마감되는 즉시 고정됩니다. 한 번 생성된 신호는 이후의 가격 변동에 따라 사라지거나 위치가 바뀌지 않습니다. 노이즈 필터링 알고리즘: 본 프로그램은 캔들의 몸통과 꼬리 비율을 분석하여 설정된 가격 범위 내의 거짓 파동을 필터링합니다. 범용성: 외환(Forex), 암호화폐, 지수, 원자재를 포함한 모든 자산군에 최적화되어 있으며, 모든 타임프레임에서 사용 가능합니다. 미니멀한 인터페이스: 시각화가 그래픽 심볼로 구현되어 트레이더의 작업 공간을 방
이 지표는 실제 거래에 완벽한 자동 파동 분석 지표입니다! 사례... 참고:   웨이브 그레이딩에 서양식 이름을 사용하는 데 익숙하지 않습니다. Tang Lun(Tang Zhong Shuo Zen)의 명명 규칙의 영향으로 기본 웨이브를   펜   으로 명명하고 2차 웨이브 밴드를   세그먼트   로 명명했습니다. 동시에, 세그먼트에는 추세 방향이 있습니다.   주요 추세 세그먼트에는   이름이 지정되지만(이 이름 지정 방법은 향후 노트에서 사용됩니다. 먼저 말씀드리겠습니다.) 알고리즘은 굴곡 이론과 거의 관련이 없으므로 그렇게 해서는 안 됩니다. 이는 나의 시장 분석을   통해 요약된 끊임없이 변화하고 복잡한 운영 규칙을   반영합니다. 밴드는 더 이상 사람마다 다르지 않도록 표준화되고 정의되었습니다. 인위적인 간섭의 드로잉 방법은 시장 진입을 엄격하게 분석하는 데 핵심적인 역할을 합니다. 이 지표를 사용하는 것은 거래 인터페이스의 미학을 개선하고 원래의 K-line 거래를
# MT5용 스퀴즈 모멘텀 지표 MetaTrader 5용으로 전문적으로 개발된 강력한 **스퀴즈 모멘텀 지표**로 폭발적인 시장 기회를 포착하세요. 이 고급 변동성 및 모멘텀 지표는 주요 시장 움직임이 발생하기 전 변동성이 낮은 구간을 파악하는 데 도움을 줍니다. 볼린저 밴드와 켈트너 채널의 장점을 결합한 이 지표는 시장이 "압축"되어 돌파를 준비하는 시점을 보여줍니다. 내장된 모멘텀 히스토그램을 통해 추세 방향과 모멘텀 변화를 쉽게 파악할 수 있어 트레이더는 자신감 있고 정확하게 거래에 진입할 수 있습니다. ## 주요 기능 * 고급 스퀴즈 감지 시스템 * 전문적인 MT5 구현 * 급격한 돌파 전 변동성 스퀴즈 감지 * 동적 색상 변화 모멘텀 히스토그램 * 시장 상황을 쉽게 파악할 수 있는 스퀴즈 상태 표시 * 다음 지표 결합: * 볼린저 밴드 * 켈트너 채널 * 선형 회귀 모멘텀 * 추세 변화 조기 감지 * 깔끔하고 반응성이 뛰어난 별도 창 표시 * 완벽하게 사용자
Rejection Zone Predictor PRO – MT5 Indicator Identify where price is most likely to react before it gets there. Rejection Zone Predictor PRO is a price-action based MetaTrader 5 indicator designed to automatically locate and rank potential BUY rejection/support zones below the current market price and SELL rejection/resistance zones above price . Instead of relying on a single support or resistance calculation, the indicator analyzes multiple forms of price-action confluence to determine which h
Aurum mid quant pro
N'da Lemissa Kouame
AURUM MID-QUANT PRO v5.60 Quantitative Excellence for Gold (XAU/USD) & Volatility Trading Gain a professional edge over institutional markets with AURUM MID-QUANT PRO , an advanced Price Action Pattern Detection and Breakout Engine designed exclusively for MetaTrader 5 . Built specifically to capture the unique volatility of Gold (XAU/USD) and other major financial instruments, this powerful indicator combines high-precision algorithmic pattern recognition with real-time dynamic accumulation z
TradePilot MT5 Market Panel
Bartosz Andrzej Danowski
A professional MT5 trading panel designed for decision support, risk management, and trade planning — not automated execution. Helps traders plan entries, manage positions, and control risk with clarity and consistency. Overview Real-time trading decision panel that analyzes trend, momentum, and market quality directly on the chart. It provides ATR-based TP/SL levels and clear buy/sell conditions to support faster and more consistent trading decisions. This is a decision support tool only —
Favero Buy and Hold
Alexandre Favero
Indicator Description Opportunity Identification Indicator — Smart Money This indicator was developed to assist in identifying moments when prices may be reaching areas of greater interest , seeking possible signals in market behavior associated with the concept of “smart money” (Smart Money) , widely discussed in financial literature and market studies. The proposal is to create a bridge between technical analysis and fundamental analysis . The indicator uses technical analysis and price behavi
Smart Money Structure & Precision Trading Indicator (MT5) Smart Money Structure & Precision Trading Indicator  is a powerful Smart Money Concepts (SMC) indicator for MetaTrader 5, designed to help traders identify high-probability entries with institutional logic . This indicator automatically detects market structure in real time , highlights key liquidity levels , and provides clear, non-repainting signals so you can trade with confidence and precision. Whether you are a scalper, day trader, o
StrBTV Pro MTF
Marian Beceanu
STRBTV Pro MTF — Detailed Description STRBTV stands for "Sell The Rally, Buy The Valley" — an MT5 indicator (v2.10, by Marian Beceanu) built around multi-timeframe MACD convergence/divergence , with a "sniper entry" logic based on Support/Resistance and a built-in risk-management dashboard. General Concept The indicator works on two levels: Higher timeframe (HTF) — looks for convergence between price and MACD on the swing highs/lows of that timeframe. A confirmed HTF convergence is treated as t
Dynamic Trend Channel Ultimate for MT5 (M30) Professional Trend-Following & Smart Signal System Dynamic Trend Channel  is an advanced trend-following indicator designed specifically for the M30 timeframe on MetaTrader 5. It combines dynamic trend channels, adaptive volatility calculations, smart trend detection, trailing stop technology, and real-time signal generation to help traders identify high-probability market opportunities with greater confidence. Built around a dynamic EMA-based channel
Omega AI MT5
Irina Selivanevskaia
1 (4)
Omega AI Neural EA: LLM 합의 및 대화형 문맥 분석 기반 XAUUSD 인지 알고리즘 시스템 실시간 거래 모니터링: 시스템의 인지 알고리즘의 유효성은 실제 거래 계좌에서 확인되었습니다. 다음 링크에서 Omega AI Neural EA 의 운영 활동, 현재 통계 및 에퀴티 역학을 독립적으로 감사할 수 있습니다:  https://www.mql5.com/ru/signals/2361385 가격 정책 및 제한된 라이선스: 이 프로젝트는 AI 인프라와의 상호 작용 안정성을 유지하기 위해 제한된 액세스 형식으로 구현됩니다. 라이선스 비용은 판매된 복사본 수에 따라 자동으로 인상됩니다: 최초 7개: $249 (특별 얼리 액세스) 다음 단계: $349 중간 단계: $699 최종 가격: $1999 I. 인지 분석 및 의사 결정 아키텍처 Omega AI는 독점 실행 알고리즘과 ChatGPT 신경망(v5.2)으로 구동되는 분석 코어를 결합한 하이브리드 모델을 기반으로 합니다. 멀티 모델
Liquidity Sweeps and Inverse FVGs RKADEV Transform your chart into a professional Smart Money Concepts (SMC) workspace. This is not just a standard indicator; it is a mechanical trading assistant designed to keep your execution structured, objective, and emotion-free. How to Use (Quick Start Guide): Step 1 (Setup): Attach the indicator and customize your Risk/Reward (RR) targets in the Inputs tab. Step 2 (Monitor): Keep an eye on the Dynamic Dashboard at the bottom-left corner. It tracks market
WaveBreaker Pro MT5 — The leader in market momentum analysis. WaveBreaker Pro is a comprehensive, high-tech trading indicator designed for precise market structure visualization. It helps identify potential reversal zones and capture strong price momentum. The core algorithm is built on a balanced combination of classic indicators and oscillators, heavily modified and thoroughly tested. The indicator effectively adapts to any trading style—from aggressive intraday scalping to conservative mediu
This indicator is based on a mathematical formula which gives you the possibility to seek and find the right frequency of the movement, and to determine its key level; just adjust the frequency parameter! Simple and highly effective; using this indicator you can easily predict the next support and  resistance    levels of the day. Also, this indicator determines the range and the next two importants levels of the movement outside this range so far. SGFL3 and RGFL3  are levels with high certainty
XAU MAJESTY ZONE ENGINEThe Ultimate 3-Zone Range AI with God-Tier Pullback Mastery Xau Majesty Zone Engine  is an exclusive God-Tier Expert Advisor crafted explicitly for GOLD (XAUUSD, XAUUSD.m, GOLD). Unlike chaotic multi-indicator EAs, Majesty Zone Engine operates on a pure, elegant, and highly effective 3-Zone Range Architecture- coupled with a single powerful EMA line to identify high-probability pullback and rebound entries. === WHY XAU MAJESTY ZONE ENGINE? === 1. ADVANCED 3-ZONE ARCHITEC
Sigma VWAP Bands
Johannes Human
Sigma VWAP Bands Sigma VWAP Bands (Rolling) is a technical analysis indicator that plots upper and lower bands based on the statistical deviation of price from a rolling Volume-Weighted Average Price (VWAP). The indicator is designed to visualize price dispersion around VWAP using a user-defined lookback window and a configurable standard deviation multiplier. Parameters Lookback Period Number of bars used for VWAP and standard deviation calculations. Sigma Factor Multiplier applied to the cal
FVG - Fair Value Gap The FVG - Fair Value Gap is an advanced MQL5 indicator designed for traders who utilize institutional order flow and Smart Money Concepts to identify market inefficiencies. This indicator automatically detects and highlights Fair Value Gaps (FVGs) on your chart, providing a clear visual representation of potential support and resistance zones, reversal points, and high-probability trading setups. Key Features: Automated FVG Detection:   The indicator automatically identifie
TREND HARMONY MT5 – Multi Timeframe Trend and Phase and Pullback Level Visualizer indicator for Metatrader5 The TREND HARMONY indicator automates deep trend analysis and generates visualizations for you. Take control of your trades by eliminating uncertainty! Revolutionize your trading experience with precision and insight through the TREND HARMONY Multi Timeframe indicator – your ultimate MT5 trend visualization indicator. [  Features and Manual   | MT4 version |   All Products   ] Are you tir
ChanLun Ind
Jing Cheng Liu
ChanLun Ind - 缠论自动画线系统 交易辅助 • 精准绘制 • 结构清晰 产品简介 ChanLun Ind 是一款基于传奇交易理论“缠论”开发的 MT5 指标。它旨在帮助缠论学习者和交易者快速画出符合缠论形态的 上涨 、 下跌 和 中枢结构 。 本指标严格遵循缠中说禅《教你炒股票》108课中的数学定义,通过计算机算法自动、精确地处理 K 线包含关系,绘制出 “笔”与“中枢” 。无论您是缠论初学者,还是资深交易员,它都能让您从繁杂的画图中解放出来,专注于市场结构的分析与交易决策。 引言:什么是《缠论》(ChanLun)? 缠论 (缠中说禅技术分析理论)是一套系统性的技术分析方法。其核心目标只有一句话: “用严格的几何结构,描述价格运动的内在逻辑,从而实现可重复、可验证的交易决策。” 为快速上手该指标,您可以优先了解以下核心概念: 走势类型 :价格走势只表现为 上涨、下跌、盘整。 笔 (Bi/Pen) :由相邻顶分型与底分型连接而成的最小走势单位。 中枢 (Pivot/ZhongShu) :至少三段重叠的价格区间,代表市场的震荡核心(类似箱体)。 线段 (Segm
이 제품의 구매자들이 또한 구매함
UZFX {SSS} 스캘핑 스마트 시그널 v5.0 MT5는 급변하는 시장에서 정확한 실시간 시그널을 필요로 하는 스캘퍼, 데이 트레이더, 스윙 트레이더를 위해 설계된 리페인팅이 없는 고성능 트레이딩 지표입니다. (UZFX-LABS)에서 개발한 이 지표는 가격 움직임 분석, 추세 확인 및 스마트 필터링을 결합하여 모든 통화 쌍과 시간대에서 높은 확률의 매수 및 매도 신호, 경고 신호, 추세 지속 기회를 생성합니다. 거래에 대한 망설임을 멈추고, 명확성, 정밀성, 그리고 규율 있는 시장 실행을 원하는 트레이더를 위해 설계된 체계적인 신호 시스템을 따르기 시작하세요. 제 말을 믿으세요. 이 지표는 MQL5에서 구할 수 있는 최고의 지표 중 하나입니다. 그러니 절대 놓치지 마세요!! “현명한 트레이더를 위한 스마트 신호” 지금 최신 버전 5.0이 출시되었으며, 사전 공지 없이 가격이 최대 $499.99까지 인상될 수 있으니 기회를 놓치기 전에 서둘러 구매하세요!! 최종 구매 전! 무료 체
한 문장으로 이해하면 이 인디케이터는 RSI와 MACD, 두 전문가를 하나로 묶은 것 입니다. 두 지표를 따로 보며 판단할 필요 없이, 둘 다 동의할 때만 "매수" 또는 "매도" 화살표를 보여줍니다. 화살표는 다시 그려지지 않습니다 . 한 번 나타나면 그 자리에 고정됩니다. "콤보"의 의미 보통 트레이더는 RSI(가격 움직임의 힘)와 MACD(추세 방향)를 따로 봅니다. 그런데 둘의 신호가 충돌할 때가 많죠. 이 인디케이터는 두 지표가 동시에 같은 방향을 가리킬 때만 신호를 냅니다 . 덕분에 가짜 신호가 훨씬 줄어듭니다. 화면에서 보이는 것 가격 차트와 분리된 인디케이터 창 파란색과 빨간색 화살표 – 바로 쓸 수 있는 매매 신호 확대된 MACD 히스토그램 (모멘텀을 쉽게 파악하도록 더 크고 선명하게 표시) RSI와 MACD 선도 함께 표시되지만, 주목할 것은 화살표 이런 분께 적합합니다 초보자 – 두 지표를 따로 해석하고 모순을 처리할 필요 없음 경험자 – 빠른 신호 필터링, 다시
ARICoins
Temirlan Kdyrkhan
ARICoin is a powerful trading companion designed to generate high-probability entry signals with dynamic TP/SL/DP levels based on volatility. Built-in performance tracking shows win/loss stats, PP1/PP2 hits, and success rates all updated live. Key Features: Buy/Sell signals with adaptive volatility bands Real-time TP/SL/DP levels based on ATR Built-in MA Filter with optional ATR/StdDev volatility Performance stats panel (Success, Profit/Loss, PP1/PP2) Alerts via popup, sound, push, or email Cust
TrendMaestro5
Stefano Frisetti
note: this indicator is for METATRADER4, if you want the version for METATRADER5 this is the link:  https://www.mql5.com/it/market/product/108106 TRENDMAESTRO ver 2.5 TRENDMAESTRO recognizes a new TREND from the start, he never makes mistakes. The certainty of identifying a new TREND is priceless. DESCRIPTION TRENDMAESTRO identifies a new TREND in the bud, this indicator examines the volatility, volumes and momentum to identify the moment in which there is an explosion of one or more of these da
Meravith Scanner
Ivan Stefanov
5 (3)
MERAVITH SCANNER는 MetaTrader 5용 전문 금융 시장 지표로, 여러 분석 도구를 하나의 통합 시스템으로 결합합니다. 독점적인 거래량 가중 평균 가격(VWAP) 방법론을 사용하여 모든 계산을 자동으로 수행하며, 주관적인 해석을 완전히 배제합니다. 이 지표는 모든 자산 클래스(Forex, 주식, 지수, 상품, 암호화폐)와 M1부터 월간 차트까지 모든 시간 프레임에서 작동합니다. 기본 원리는 “가격은 거래량을 따른다”입니다. MERAVITH는 기관 거래량이 집중되는 위치를 식별하고, 그 집중에서 수학적으로 정확한 가격 수준을 도출합니다. 예측이나 투기를 하지 않으며, 계산만 수행합니다. MERAVITH SCANNER를 사용하면 28개의 주요 Forex 통화쌍을 모든 시간 프레임에서 단 2~3분 만에 스캔할 수 있습니다. 또한 원하는 시장을 스캔할 수도 있으며, 예를 들어 약 100개의 주식을 약 10분 안에 스캔할 수 있습니다. 지표는 소진 레벨, 균형선, 편차, 통계
Transaction Speed MT5
Ivan Stefanov
5 (4)
이 지표는 시장에서 관심이 나타나는 영역 을 강조 표시한 후, 주문이 누적되는 영역 을 보여줍니다. 이는 **대규모 오더북(호가창)**처럼 작동합니다. 이것은 거대한 자금 을 위한 인디케이터입니다. 성능은 탁월하며, 시장에서 어떤 관심이 있든 반드시 포착할 수 있습니다 . (이것은 완전히 새로 작성되고 자동화된 버전 입니다 – 이제 수동 분석은 필요하지 않습니다.) **거래 속도(Transaction Speed)**는 새로운 개념의 인디케이터로, 시장에 대규모 주문이 언제, 어디에 쌓이는지를 보여주며 , 그 이점을 분석합니다. 매우 초기 단계에서 트렌드 전환 을 감지할 수 있습니다. FX 시장에서 흔히 사용하는 "거래량(volume)"은 오해입니다. 실제로는 시간당 가격 변화량 이므로, 올바른 용어는 거래 속도 입니다. 우리가 어떻게 사고하고, 행동하며, 분석하느냐 가 가장 중요합니다. 분석 패러다임의 전환 은 필수적입니다. 이 인디케이터는 외환 시장에서의 볼륨 개념을 논리적으로
시장이 진짜로 무엇을 하고 있는지 보십시오.   세 가지 시장 국면(수축, 확장, 추세)을 눈앞에서 실시간으로 지켜보고, 추세 국면의 초기 단계에서 더 나은 진입을 잡으십시오.   추측을 멈추십시오. 기관과 스마트 머니가 하는 것처럼 시장을 읽기 시작하십시오.   MT5용 Apex Market Structure Pro는 노이즈를 걷어내고 모든 캔들 아래에 있는 진짜 구조를 보여 주는 정밀 스마트 머니 분석 도구입니다.   유동성, 구조 전환, 매집 구간, 추세 편향을 하나의 깔끔하고 전문적인 오버레이에 담았습니다. 후행 지표에 지쳐 명확함으로 매매할   준비가 된 진지한 트레이더를 위해 만들어졌습니다.      중요: 이 지표는 Heikin Ashi(하이킨 아시) 캔들에서 작동하도록 설계되었습니다. 사용 전 차트를 Heikin Ashi로 설정하여 그 잠재력을   온전히 끌어내십시오. 모든 분석은 Heikin Ashi 가격 흐름을 중심으로 설계되었습니다. Apex Market S
Title:FX-AIEA Supply and Demand Zone Indicator (MT5) — Technical Overview Version: 2.51 | Platform: MetaTrader 5 Introduction Supply and demand zones are considered a core manifestation of institutional order flow, providing a more direct reflection of buying and selling pressure than traditional support/resistance levels. This indicator attempts to automate the identification of high-probability supply and demand zones using an adaptive ZigZag algorithm, reducing the subjectivity and time asso
MasterTrend
Temirlan Kdyrkhan
MasterTrend Indicator for MT5 A powerful trend-following and signal-evaluation tool MasterTrend   is a custom MT5 indicator that combines Moving Averages and ATR-based risk/reward logic to generate clear buy/sell signals. It visualizes dynamic SL/TP levels, evaluates past trade outcomes, and displays win/loss statistics in a clean on-chart panel. Key features include: Buy/Sell signals based on MA crossovers ATR-based SL/TP1/TP2/TP3 levels with visual lines and labels Signal outcome tracking wit
SMC Sweep Fvg MT5
Daniil Sleptsov
5 (1)
SMC Sweep Fvg MT5 — 스마트 머니처럼 시장을 보세요, 차트 위에서 바로 이런 경험, 알고 계실 겁니다. 가격이 스톱을 훑고, 돌아서, 기대했던 방향으로 그대로 갑니다. 방향은 맞았습니다. 틀린 것은 진입뿐이었습니다. 이 지표는 그런 일이 덜 일어나도록 만들어졌습니다. 분석에서 가장 무거운 부분—차트 마킹—을 대신하고, 진짜 중요한 것인 결정은 당신에게 남깁니다. 차트에서 보이는 것 시장 구조 — 실제 구조적 고점·저점에 HH / HL / LH / LL 라벨과 레벨 라인. 추측 없이 추세가 바로 보입니다. 불균형 구간(FVG) — 가격이 너무 빠르게 지나갔고 나중에 자주 되돌아오는 영역. 열린 구간과 이미 메워진 구간은 다른 색으로 표시됩니다. 유동성 행동 — 반전 전에 시장이 레벨을 훑는 순간을 추적합니다. 완성된 트레이드 레이아웃 — 진입 화살표, 손절 레벨, 이익 목표. 모두 그려져 있어 머릿속 계산이 필요 없습니다. 추세 필터 — 상위 타임프레임 라인으로
AriX
Temirlan Kdyrkhan
1 (4)
AriX Indicator for MT5 A powerful trend-following and signal-evaluation tool AriX is a custom MT5 indicator that combines Moving Averages and ATR-based risk/reward logic to generate clear buy/sell signals. It visualizes dynamic SL/TP levels, evaluates past trade outcomes, and displays win/loss statistics in a clean on-chart panel. Key features include: Buy/Sell signals based on MA crossovers ATR-based SL/TP1/TP2/TP3 levels with visual lines and labels Signal outcome tracking with real-time stat
VTrende Pro
Andrii Diachenko
5 (1)
VTrende Pro - MTF indicator for trend trading with a display panel for MT5 *** Videos can be translated into any language using subtitles (video language - Russian) Although the signals of the VTrende Pro indicator can be used as signals of a full-fledged trading system, it is recommended to use them in conjunction with the Bill Williams TS. VTrende Pro is an extended version of the VTrende indicator. Difference between Pro version and VTrende: - Time zones - Signal V - signal 1-2 waves -    S
Meravith MT5
Ivan Stefanov
5 (3)
마켓 메이커를 위한 도구. Meravith는 다음과 같은 기능을 제공합니다: 모든 타임프레임을 분석하고 현재 유효한 추세를 표시합니다. 강세와 약세 거래량이 동일한 유동성 구간(거래량 균형 구간)을 강조 표시합니다. 서로 다른 타임프레임의 모든 유동성 레벨을 차트에 직접 표시합니다. 텍스트 기반 시장 분석을 생성하여 참고용으로 제공합니다. 현재 추세를 기반으로 목표가, 지지선 및 손절가를 계산합니다. 거래의 위험 대비 보상 비율(Risk/Reward)을 계산합니다. 계좌 잔고에 따라 포지션 크기를 산출하고 잠재 수익을 추정합니다. 시장에 중대한 변화가 발생할 경우 경고도 제공합니다. 지표의 주요 라인: 강세/약세 거래량 소진 라인 — 목표가로 사용됩니다. 시장 추세를 나타내는 라인. 시장이 강세인지 약세인지에 따라 색상이 변경되며 추세 지지선 역할을 합니다. 색상은 주로 시장 심리를 보여줍니다. 거래량 균형선(Eq). Eq(Volume Equilibrium) 라인은 시스템의 핵심입니
ScalpPoint
Temirlan Kdyrkhan
ScalpPoint is a powerful trading companion designed to generate high-probability entry signals with dynamic TP/SL/DP levels based on volatility. Built-in performance tracking shows win/loss stats, PP1/PP2 hits, and success rates — all updated live. Key Features: Buy/Sell signals with adaptive volatility bands Real-time TP/SL/DP levels based on ATR Built-in MA Filter with optional ATR/StdDev volatility Performance stats panel (Success, Profit/Loss, PP1/PP2) Alerts via popup, sound, push, or emai
ZIVA Signal Intelligence
Hassan Abdullah Hassan Al Balushi
ZIVA Signal Intelligence An Adaptive, Modular Market Intelligence System ZIVA Signal Intelligence is not positioned as a conventional trading indicator. It is a fully integrated, proprietary market intelligence system engineered to deliver structured, high-precision interpretation of price behavior within a controlled analytical environment. Developed through an independent architectural approach, ZIVA does not rely on, derive from, or replicate existing indicators. It represents a standalone
OmniSync Projection
Antonio-alin Teculescu
5 (1)
Chronos Fractal Engine is an innovative price projection indicator for MetaTrader 5, designed to transform your technical analysis by intelligently identifying and projecting historical price patterns. Built upon an advanced correlation algorithm and the fractal principles of the market, this powerful tool visualizes potential future price movements, giving you a unique edge in your trading decisions. What is Chronos Fractal Engine? At its core, the Chronos Fractal Engine employs a sophisticat
SMC Institutional Suite
Catur Cipto Nugroho
SMC Institutional Suite v3.7 Professional Smart Money Concept Indicator for MetaTrader 5 What is New in Version 3.7 - Visual Stability Update This release focuses entirely on one goal: making every zone, label, and line on your chart rock-solid stable. There is no more flickering, no more zones disappearing on a new candle, and no more duplicate drawings. Order Block (OB) zones no longer flicker or disappear. Once drawn, they stay permanently on the chart. Equal Highs and Equal Lows (EQH / EQL)
PrimeScalping
Temirlan Kdyrkhan
PrimeScalping is a powerful trading companion designed to generate high-probability entry signals with dynamic TP/SL/DP levels based on volatility. Built-in performance tracking shows win/loss stats, PP1/PP2 hits, and success rates — all updated live. Key Features: Buy/Sell signals with adaptive volatility bands Real-time TP/SL/DP levels based on ATR Built-in MA Filter with optional ATR/StdDev volatility Performance stats panel (Success, Profit/Loss, PP1/PP2) Alerts via popup, sound, push, or e
Binary Compound Indicator V3 Binary Compound Indicator V3 is a technical analysis indicator for MetaTrader 5 designed to help traders identify potential market opportunities using multiple confirmation filters and structured risk management concepts. The indicator combines trend analysis, momentum confirmation, and market condition filtering to provide visual trading signals directly on the chart. Main Features Triple-confirmation signal system EMA trend filtering RSI momentum analysis Stochast
Triple Crox Strategy
issam rahhal sabour
Triple Crox Strategy v4.10 Triple Crox Strategy v4.10 Professional MetaTrader 5 Indicator 13 Patterns • Fibonacci • CLUSTER ML • Multi-Filter 1. Overview Advanced MT5 indicator combining 13 Pattern Detection , Fibonacci Analysis , CLUSTER Machine Learning and Multi-Filter system for precise signals on Forex, indices, commodities, crypto. 5-step pipeline: indicators → filter → patterns → signals → levels. 2. Trading Setup Heikin-Ashi colored bars. Buy/Sell arrows with Entry, TP1(1x ATR), TP2(2x
TraderHUD
Justino Porto Neto
5 (1)
TraderHUD v2 — 전문 트레이더를 위한 완벽한 대시보드 TraderHUD v2 는 MetaTrader 5용 가장 완벽한 시각적 지표의 진화 버전입니다. 트레이더가 더 현명한 결정을 내리기 위해 차트에서 봐야 할 모든 것을 하나의 도구에 통합합니다: 시간적 맥락, 달러 강도, 통계적 범위, 피벗 레벨, 움직임 속도, 매크로 트렌드 — 모두 통합되고 설정 가능하며 차트를 어지럽히지 않습니다. 이 버전은 실제 라이브 트레이딩 사용 경험을 바탕으로 제작되었으며, 명확한 철학을 따릅니다: 더 많은 맥락, 더 적은 노이즈 . v2의 새로운 기능 8개 모듈을 단일 지표로 완전 통합 DayRange와 DollarFlow가 자동 연결된 설정 가능한 사이드 패널 정시 표시와 함께 시장 세션 마킹 레벨 간 평균선 옵션이 있는 클래식 피벗 포인트 베타로 표시된 두 개의 실험적 모듈: 변동성 및 매크로 트렌드 평균 완전히 설정 가능한 레이아웃 — 코너, 너비, 색상 및 글꼴 모듈 타이머 및 스
Pan PrizMA CD Phase
Aleksey Panfilov
The Expert Advisor and the video are attached in the Discussion tab . The robot applies only one order and strictly follows the signals to evaluate the indicator efficiency. Pan PrizMA CD Phase is an option based on the Pan PrizMA indicator. Details (in Russian). Averaging by a quadric-quartic polynomial increases the smoothness of lines, adds momentum and rhythm. Extrapolation by the sinusoid function near a constant allows adjusting the delay or lead of signals. The value of the phase - wave s
Классификатор силы тренда. Показания на истории не меняет. Изменяется классификация только незакрытого бара. По идее подобен полной системе ASCTrend, сигнальный модуль которой, точнее его аппроксимация в несколько "урезанном" виде, есть в свободном доступе, а также в терминале как сигнальный индикатор SilverTrend . Точной копией системы ASCTrend не является. Работает на всех инструментах и всех временных диапазонах. Индикатор использует несколько некоррелируемых между собой алгоритмов для класси
FFx Universal Strength Meter PRO is more than a basic strength meter. Instead of limiting the calculation to price, it can be based on any of the 19 integrated strength modes + 9 timeframes. With the FFx USM, you are able to define any period for any combination of timeframes. For example, you can set the dashboard for the last 10 candles for M15-H1-H4… Full flexibility! Very easy to interpret... It gives a great idea about which currency is weak and which is strong, so you can find the best pai
The FFx Universal MTF alerter shows on a single chart all the timeframes (M1 to Monthly) with their own status for the chosen indicator. 9 indicators mode (MACD-RSI-Stochastic-MA-ADX-Ichimoku-Candles-CCI-PSAR). Each can be applied multiple times on the same chart with different settings. Very easy to interpret. Confirm your BUY entries when most of the timeframes are showing green color. And confirm your SELL entries when most of the timeframes are showing red color. 2 Alert Options : input to s
FFx Watcher Pro MT5
Eric Venturi-Bloxs
The FFx Watcher PRO is a dashboard displaying on a single chart the current direction of up to 15 standard indicators and up to 21 timeframes. It has 2 different modes: Watcher mode: Multi Indicators User is able to select up to 15 indicators to be displayed User is able to select up to 21 timeframes to be displayed Watcher mode: Multi Pairs User is able to select any number of pairs/symbols User is able to select up to 21 timeframes to be displayed This mode uses one of the standard indicators
FFx Patterns Alerter gives trade suggestions with Entry, Target 1, Target 2 and StopLoss .... for any of the selected patterns (PinBar, Engulfing, InsideBar, OutsideBar) Below are the different options available: Multiple instances can be applied on the same chart to monitor different patterns Entry suggestion - pips to be added over the break for the entry 3 different options to calculate the SL - by pips, by ATR multiplier or at the pattern High/Low 3 different options to calculate the 2 TPs -
FFx Basket Scanner MT5
Eric Venturi-Bloxs
MetaTrader 4 version available here : https://www.mql5.com/en/market/product/24881 FFx Basket Scanner is a global tool scanning all pairs and all timeframes over up to five indicators among the 16 available. You will clearly see which currencies to avoid trading and which ones to focus on. Once a currency goes into an extreme zone (e.g. 20/80%), you can trade the whole basket with great confidence. Another way to use it is to look at two currencies (weak vs strong) to find the best single pairs
MetaTrader 4 version available here: https://www.mql5.com/en/market/product/25793 FFx Pivot SR Suite PRO is a complete suite for support and resistance levels. Support and Resistance are the most used levels in all kinds of trading. Can be used to find reversal trend, to set targets and stop, etc. The indicator is fully flexible directly from the chart 4 periods to choose for the calculation: 4Hours, Daily, Weekly and Monthly 4 formulas to choose for the calculation: Classic, Camarilla, Fibonac
Premium level Pro
Dmitriy Kashevich
Premium level is a unique indicator with more than 80% accuracy of correct predictions! This indicator has been tested for more than two months by the best Trading Specialists! The author's indicator you will not find anywhere else! From the screenshots you can see for yourself the accuracy of this tool! 1 is great for trading binary options with an expiration time of 1 candle. 2 works on all currency pairs, stocks, commodities, cryptocurrencies Instructions: As soon as the red arrow app
제작자의 제품 더 보기
What makes this indicator different? Most moving average crossover indicators on the market do one thing: they watch two moving averages cross and they fire an arrow the moment the cross happens. Every cross. Every time. Whether the market is ranging, whether the higher timeframe agrees, whether momentum supports the move, whether the price is at a logical entry point — none of that matters to them. You get arrows. Lots of arrows. Most of them useless... This indicator was built on a different p
FREE
NOTE: The EA is designed to trade the same signal engine as the companion indicator. If you want to see signals on a chart before committing capital, purchase and configure the indicator first( Multiple Timeframe Filtered Moving Average Crossover Indicator ), or try the free version of the indicator as well ( Multiple Timeframe Filtered Moving Average Crossover Signals ) verify it fires the way you expect on the symbols and timeframes you trade, then replicate those settings in the EA. The two a
필터:
리뷰 없음
리뷰 답변