Multiple Timeframe Filtered MA Crossover Indicator

Please feel free to join this Telegram group where users can share their strategies and settings that work for them using this indicator --> t.me/MTFMACS
ALSO AVAILABLE ON TRADINGVIEW
The MTFMACS family is now available on TradingView for users who prefer charting on that platform. Contact me via the Telegram group for direct access.
—————————————————————————————————

BEFORE YOU PURCHASE — PLEASE READ

A free version of this indicator is available. Please purchase this paid version only if you want complete control over how the moving averages are configured, or if you simply want to support my work.

The default settings are examples only and are not guaranteed to make money. You should already have a moving-average strategy that you have tested and believe works for you. This indicator is a tool for applying that strategy without constant chart monitoring.

———————————————————————————————————

WHAT'S NEW IN v1.50

• Independent Signal Timing: You can now set separate timing modes for Early and Full signals (e.g., Early on Intrabar for fast alerts, Full on Close for strict confirmation).
• Expanded to 17 Validation & Filter MAs: Added 6 more slots each to the validation stacks and the trend-direction filter to give you ultimate control over your market structure.
• Visual Filter MAs: The Filter MAs can now be plotted directly on your chart with fully customizable colors, widths, and a new master visibility toggle.
• Volume Weighted MA (VWMA): Added VWMA as a first-class moving average method across all slots.
• Optional Intrabar Arrows: Added a new toggle to allow arrows to be drawn on Intrabar signals (off by default to prevent repainting).
• Stability Fixes: Resolved MTF data loading bugs and chart scaling issues when higher timeframe data is still downloading.

———————————————————————————————————

WHAT IS DIFFERENT ABOUT THE PAID VERSION

The free version uses a fixed library of pre-built moving averages. You select an MA such as EMA 14 or WMA 100 from a dropdown.

The paid version removes that limitation. Every MA used by the indicator — crossover MAs, validation MAs, and higher-timeframe trend-filter MAs — is fully configurable.

For every MA you can set:
• Period — any integer, such as 7, 14, 100, 350 or 999
• Shift — forward/backward shift, default 0
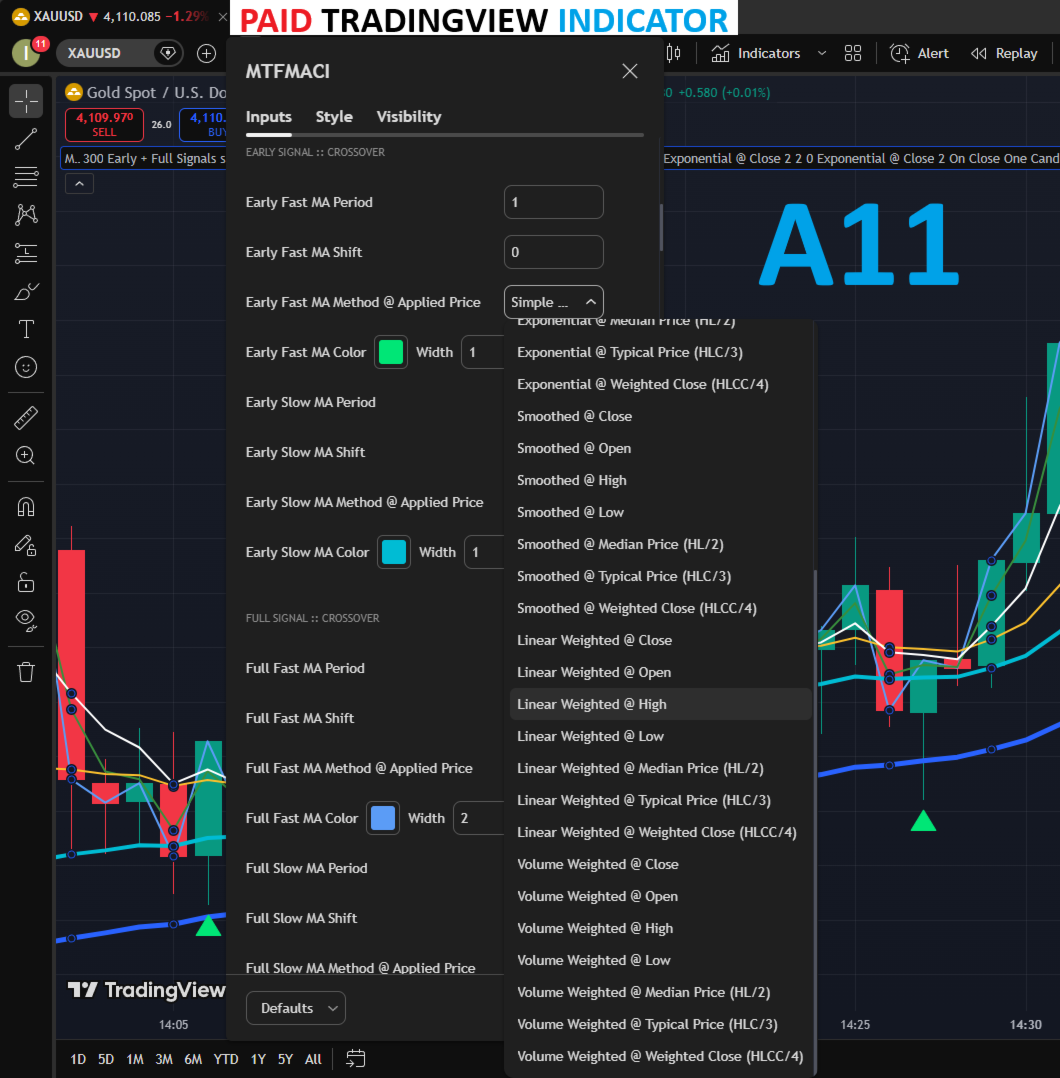
• Method @ Applied Price — one dropdown combining 5 smoothing methods and 7 price types (35 combinations)

Smoothing methods:
• Simple (SMA)
• Exponential (EMA)
• Smoothed (SMMA)
• Linear Weighted (LWMA)
• Volume Weighted (VWMA)

Applied prices:
• Close
• Open
• High
• Low
• Median Price (HL/2)
• Typical Price (HLC/3)
• Weighted Close (HLCC/4)

This lets you configure combinations such as EMA 200 on High, SMA 55 on Typical Price, LWMA 13 on Weighted Close, or VWMA 20 on Close — or create your own combination directly from the indicator inputs.

Everything else — signal timing, arrows, alerts, MTF RSI, MTF MACD, the previous-candle Fibonacci/price filter, and trading periods — works as in the free version.

———————————————————————————————————

MA VISIBILITY — FULL CHART CONTROL

The paid version lets you optionally draw any of the moving averages that drive the signal logic directly on the chart.

Five master toggles:
• Show Early Crossover MAs
• Show Full Crossover MAs
• Show Early Validation MAs
• Show Full Validation MAs
• Show Filter MAs

Each toggle controls the whole group. When a group is enabled, its MAs are plotted with the exact period, shift, method, and applied price you configured for the signal logic — no need to add them manually.

In addition, every one of the 55 MAs in the system now has its own Color and Width input. You can visually distinguish the moving averages at a glance, or match them to your existing chart template. The visibility toggles are purely cosmetic: they do not affect the signal logic, and the MAs continue to gate signals in the background whether they are drawn or not.

If you prefer a clean chart for price action, trendlines, or order blocks, leave all five toggles off and use the indicator exactly as before.

———————————————————————————————————

WHAT MAKES THIS INDICATOR DIFFERENT

Most MA crossover indicators simply watch two MAs and fire an arrow whenever they cross. They do not necessarily consider market structure, higher-timeframe direction, momentum, or where price is trading.

This indicator is built around a different idea: a crossover can be filtered by the context surrounding it.

You can:
• Use up to 17 configurable MAs on the signal timeframe and require them to be in a specific order.
• Filter signals using an MA trend structure from another timeframe (up to 17 MAs).
• Require MTF RSI and/or MACD conditions.
• Require the crossover to occur inside a defined Fibonacci/price zone based on the previous higher-timeframe candle.
• Restrict signals to selected trading periods.

Enable as many or as few filters as your strategy requires. The goal is not to produce more arrows, but to let you define exactly which conditions a signal must satisfy.

———————————————————————————————————

HOW THE INDICATOR WORKS

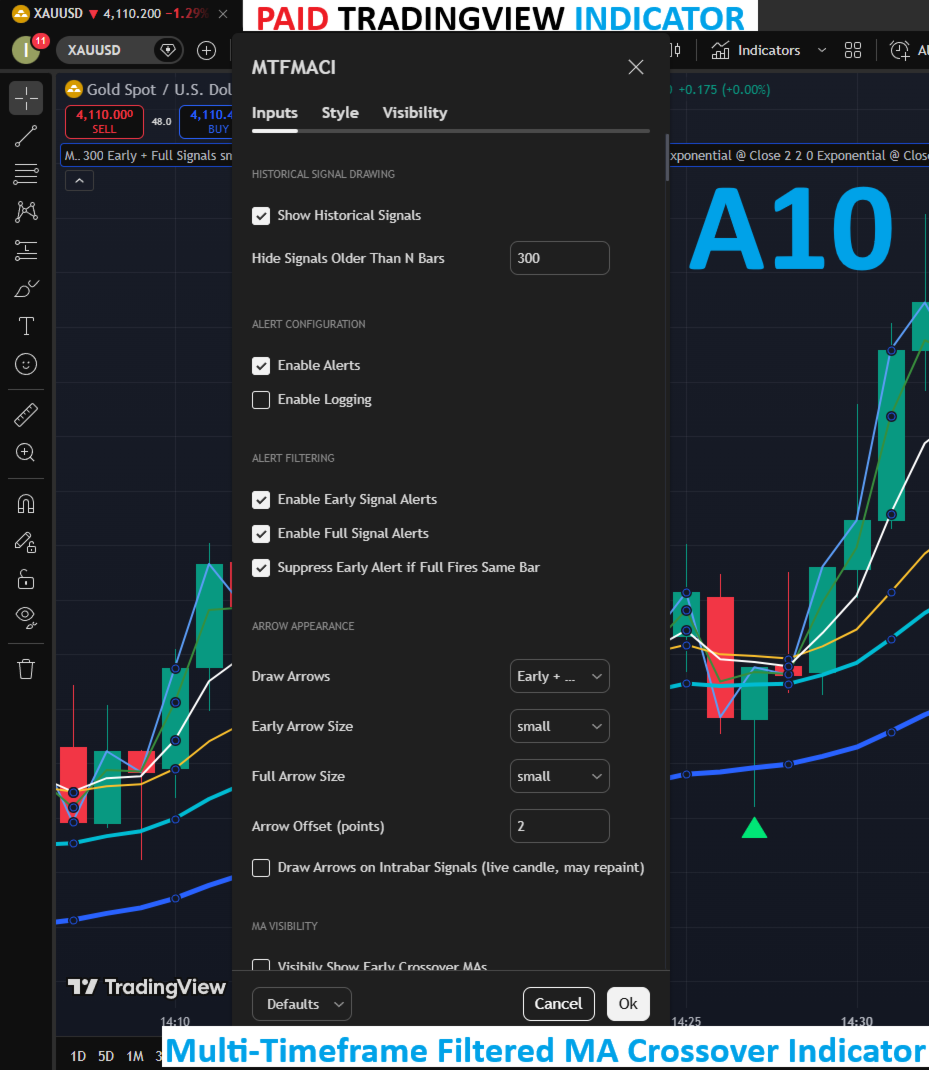
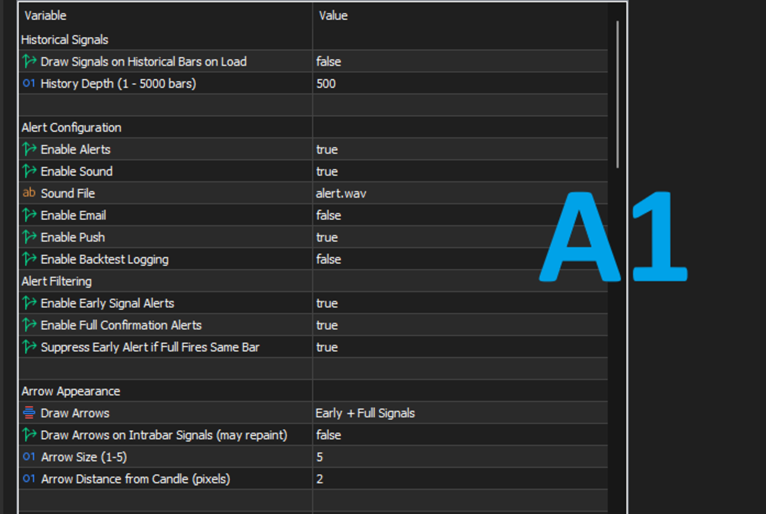
ALERT CONFIGURATION (Image A1)

Each alert type can be enabled independently:
• Enable Alerts — pop-up alert window
• Enable Sound — plays your selected .wav file
• Enable Email — sends to your terminal-configured email
• Enable Push — sends to the MetaTrader mobile app
• Enable Backtest Logging — writes diagnostic values to the Experts log for tuning

ALERT FILTERING
• Enable Early Signal Alerts
• Enable Full Confirmation Alerts
• Suppress Early Alert if Full Fires Same Bar — if Early and Full fire on the same bar in the same direction, only the Full alert is sent.

ARROW APPEARANCE
• Draw Arrows — No Arrows, Early + Full Signals, or Full Signals Only
• Arrow Size — 1 to 5
• Arrow Distance from Candle — pixel offset
• Draw Arrows on Intrabar Signals — default OFF. When enabled, arrows appear on the still-forming bar for any subsystem set to Intrabar timing. Off by default because intrabar signals can repaint.

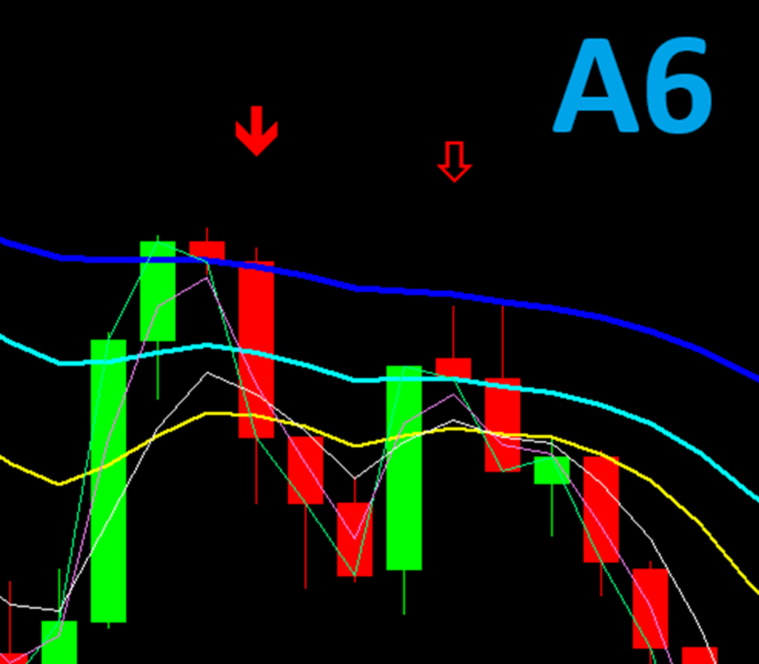
Image A6 — Screenshot showing the indicator's arrow appearance, with the hollow arrows representing the Early signals and the full-body colored arrows representing Full signals.

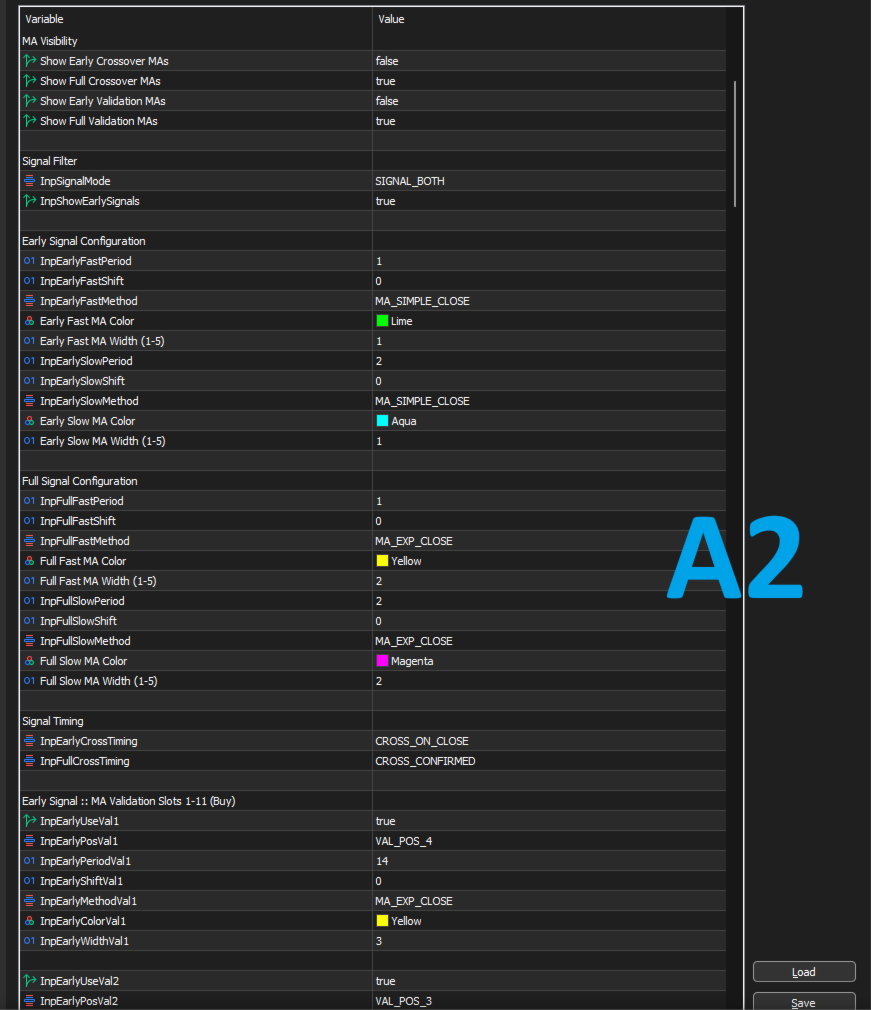
SIGNAL FILTER (Image A2)
• Signal Mode — Long Only, Short Only, or Both Directions
• Show Early Signals — master switch for the Early subsystem

EARLY SIGNAL CONFIGURATION

The Early signal detects the crossover earlier in its development, before the full validation stack has necessarily aligned. It provides an early indication that a Full signal may be forming.

Configure:
• Early Fast MA Period
• Early Fast MA Shift
• Early Fast MA Method @ Applied Price
• Early Slow MA Period
• Early Slow MA Shift
• Early Slow MA Method @ Applied Price

All six inputs are fully configurable. For example, you can use 1 SMA crossing 2 SMA, 9 EMA crossing 21 EMA, or 8 EMA on High crossing 21 LWMA on Typical Price.

FULL SIGNAL CONFIGURATION

The Full signal is the confirmed crossover. It fires only when the crossover occurs and all enabled validation/filter conditions agree.

Configure:
• Full Fast MA Period
• Full Fast MA Shift
• Full Fast MA Method @ Applied Price
• Full Slow MA Period
• Full Slow MA Shift
• Full Slow MA Method @ Applied Price

The Full pair can be completely different from the Early pair, allowing a two-stage system: an aggressive Early crossover followed by a stricter Full confirmation.

SIGNAL TIMING — INDEPENDENT FOR EARLY AND FULL

The paid version gives you two separate timing settings — one for the Early subsystem and one for the Full subsystem. The free version uses a single shared setting.

• Early Signal Timing Mode
• Full Signal Timing Mode

Each can be set to:
• Intrabar — detects signals on the live, still-forming candle. Fastest but noisiest; the candle can change. Alerts fire; arrows only if you enable Draw Arrows on Intrabar Signals.
• On Close of Cross Candle (default) — detects the signal after the crossover candle closes. Arrows are drawn, no repainting.
• One Candle After Close — the crossover must have occurred on the previous closed candle and the relationship must still hold on the current closed candle. Filters crosses that immediately reverse.

Common combinations: Early on Intrabar for fast heads-up alerts while Full waits for On Close confirmation. Or both on On Close for a clean, no-repaint workflow.

———————————————————————————————————

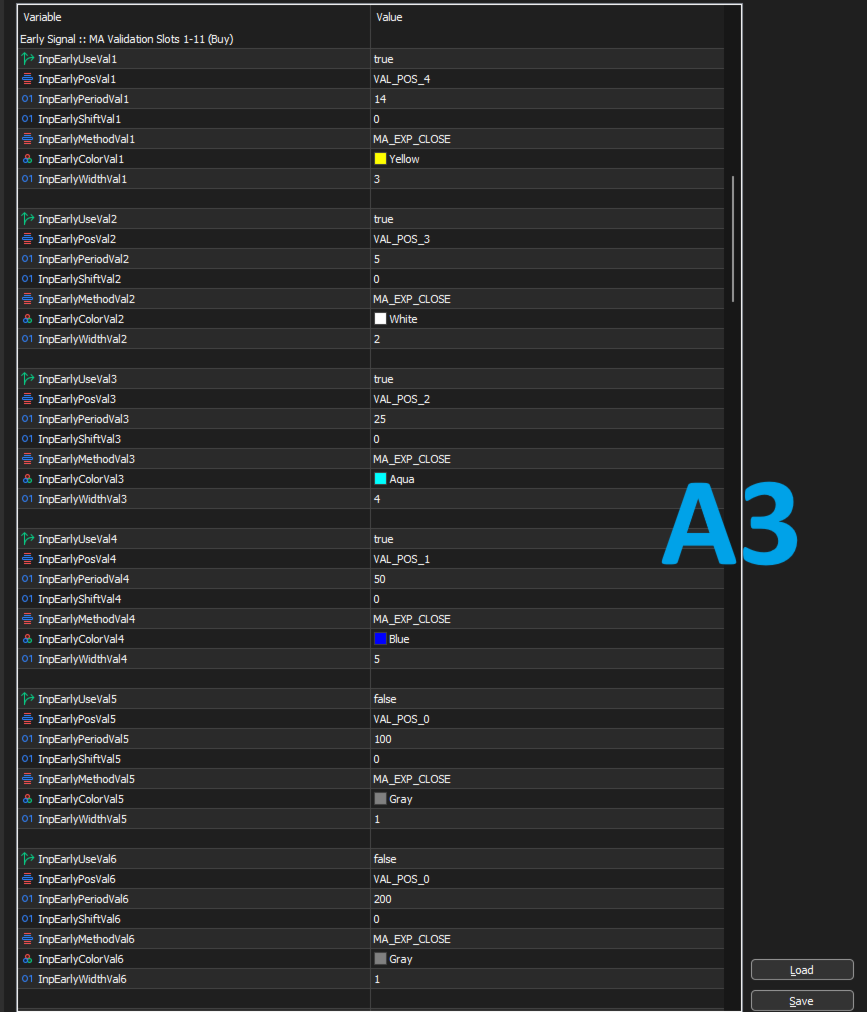
MA VALIDATION ORDER — THE HEART OF THE INDICATOR (Images A3, A6)

There are two validation sections:
• Early Signal :: MA Validation Slots 1–17 (Buy)
• Full Signal :: MA Validation Slots 1–17 (Buy)

Each section provides 17 configurable validation slots. Each slot has:
• Use Validation MA
• Validation MA Position — 0 to 17
• Validation MA Period
• Validation MA Shift
• Validation MA Method @ Applied Price
• Validation MA Color
• Validation MA Width

The Position number is not the MA period. It defines where that MA belongs in your required validation stack.

When a crossover occurs, the indicator checks the enabled MAs against the order you defined:
• Buy — MA values must be in strictly descending order.
• Sell — the same order is checked in reverse, so values must be in strictly ascending order.

If the required order is not present, the signal is rejected and no arrow or alert is generated.

EXAMPLE

You want a bullish stack to look like this on the chart:

EMA 14 (top — highest value)
EMA 5
EMA 25
EMA 50 (bottom — lowest value)

You also want the Early crossover to be 1 SMA crossing 2 SMA upwards for the bullish signal, and 1 EMA crossing 2 EMA upwards for the Full confirmation signal.

You would set:

MA Enable Position
EMA 14 yes 4
EMA 5 yes 3
EMA 25 yes 2
EMA 50 yes 1

The indicator sorts these by position, giving [EMA 14, EMA 5, EMA 25, EMA 50]. For a Buy signal it then requires:

EMA 14 > EMA 5 > EMA 25 > EMA 50

If that chain holds at the moment of the crossover, the Buy is valid. If EMA 14 pokes above EMA 5, or EMA 25 above EMA 14, the signal is discarded.

Image A3 — showing the indicator's MA validation order settings input section.

Image A6 — showing how the given example above would look for a bearish signal. The thick dark blue line at the top is the 50 EMA and the aqua line following beneath it is the 25 EMA, followed by the 5 EMA which is a thin white line, then lastly the 14 EMA which is the yellow line. The green and purple lines crossing each other are the 1 EMA and 2 EMA respectively. The 1 SMA and 2 SMA that drive the Early subsystem are not visible.

Note: If you want to include the moving averages involved in the crossover in the MA validation order section, you can — but only the Slow MA. If you include the Fast MA as well, the logic will not work, because the Fast MA and the Slow MA are already required to be in a specific relationship by the crossover condition itself.

This validation layer is designed to reduce signals during choppy conditions where MAs repeatedly cross and tangle. You can use only a few MAs for a looser filter or up to 17 for a stricter structure.

———————————————————————————————————

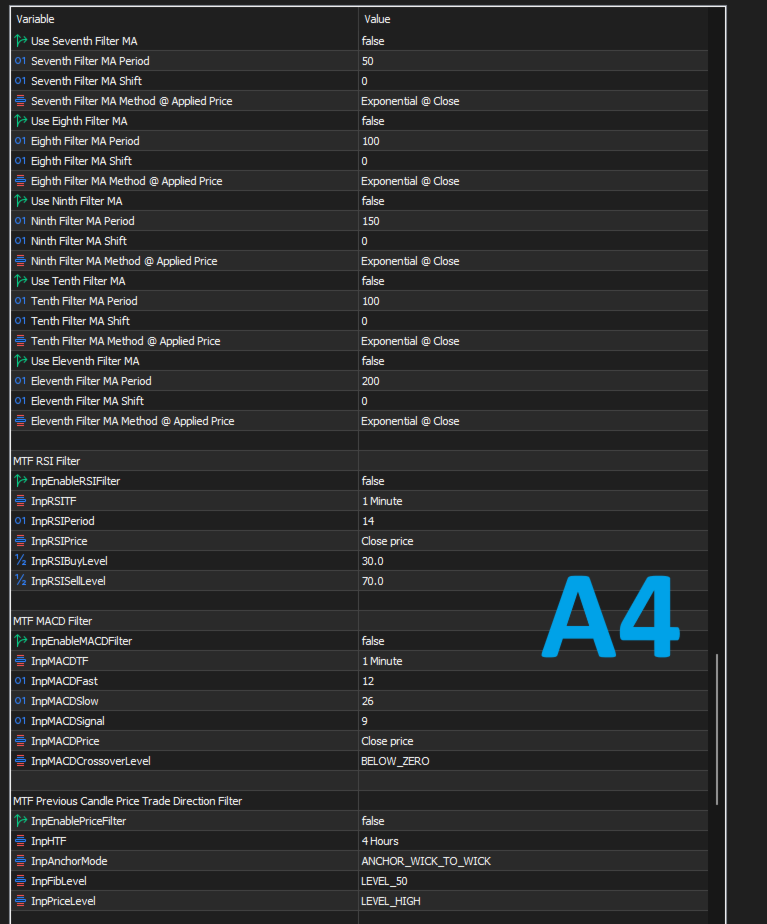
SIGNALS BY MARKET DIRECTION — MTF MA TREND FILTER (Image A4)

This filter checks the trend structure on another timeframe. It is separate from the validation stack, which checks the current signal timeframe.

Settings:
• Enable Signals by Trend Direction Only
• Filter Mode:

  • Include Price — Buy requires Price > MA1 > MA2 > ... > MA17

  • MA Only — requires MA1 > MA2 > ... > MA17 and ignores price
    • MA(s) Filter Timeframe — the timeframe used for the trend filter

Up to 17 filter MAs can be configured, each with:
• Use Filter MA
• Period
• Shift
• Method @ Applied Price
• Color & Width (for on-chart plotting)

Example: If you trade M5 but want signals only in the H1 trend direction, set the filter timeframe to H1 and configure your H1 MAs. An M5 Buy that conflicts with the H1 structure is rejected.

———————————————————————————————————

MTF RSI FILTER

RSI can be evaluated on a different timeframe from the chart.

Settings:
• Enable RSI Filter
• RSI Timeframe
• RSI Period
• RSI Applied Price
• RSI Buy Threshold — Buy signals pass only when RSI is at or below this level (default 30)
• RSI Sell Threshold — Sell signals pass only when RSI is at or above this level (default 70)

———————————————————————————————————

MTF MACD FILTER

MACD can also be evaluated on any selected timeframe.

Settings:
• Enable MACD Filter
• MACD Timeframe
• MACD Fast
• MACD Slow
• MACD Signal
• MACD Applied Price
• Crossover Level — Below Zero or Above Zero

Below Zero can be used for momentum reversals from lower levels, while Above Zero can be used for continuation within an established trend.

———————————————————————————————————

MTF PREVIOUS CANDLE PRICE / FIBONACCI FILTER (Images A4, A7)

This optional filter uses the most recently completed higher-timeframe candle to define an acceptance zone. A crossover is accepted only when it occurs inside the zone you configure.

The filter is OFF by default. When enabled, a signal that does not satisfy its rules is rejected even if all other enabled filters agree.

CONFIGURATION

Previous Candle Timeframe
The timeframe whose most recently closed candle is used as the reference, typically H4, D1, or W1. It must be higher than the chart timeframe; a lower setting is blocked with an error.

Fibonacci Anchor
Choose how the Fibonacci range is anchored:
• Wick to Wick — High (100%) to Low (0%), including wicks
• Body to Body — top of body (100%) to bottom of body (0%), ignoring wicks

Fibonacci Level
Available levels: 23.6%, 38.2%, 50.0%, 61.8%, 78.6%, 100.0%, and 107.0%.

The 107% level extends beyond the opposite extreme and can be used to include a sweep/stop-hunt area beyond the previous candle's high or low.

Price Reference Level
Choose Open, High, Low, or Close from the previous candle.

The selected Fibonacci price and Reference price form the acceptance zone. The indicator sorts the two prices automatically so the zone is always well-defined.

DIRECTION RULE
• Buy — the previous higher-timeframe candle must be bullish.
• Sell — the previous higher-timeframe candle must be bearish.

If the previous candle's direction does not match the signal direction, the signal is rejected before the zone is calculated.

EXAMPLE

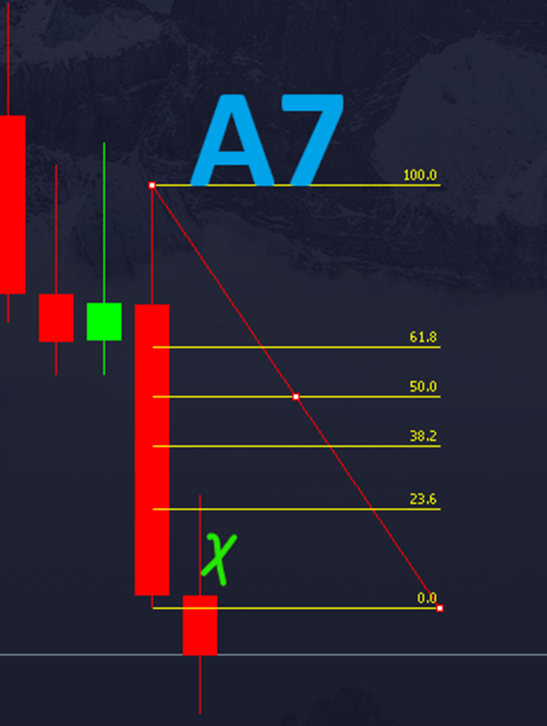
For a bearish previous candle, the Fibonacci range can be drawn from its High (100%) to Low (0%). If a Sell crossover occurs inside the selected retracement zone, it can pass the filter. If a later crossover occurs after price has moved outside the permitted zone, it is rejected.

IMPORTANT: DIPS ARE FORGIVEN

The zone is checked at the moment the crossover occurs. Earlier price movement during the current period does not automatically disqualify the signal.

If you are new to this approach, example starting combinations are:
• H4 reference candle + M1 crossover signals
• D1 reference candle + M15 crossover signals
• W1 reference candle + H4 crossover signals

These are starting points, not fixed rules. You can combine any higher-timeframe reference candle with any lower signal timeframe, provided the reference timeframe is higher.

———————————————————————————————————

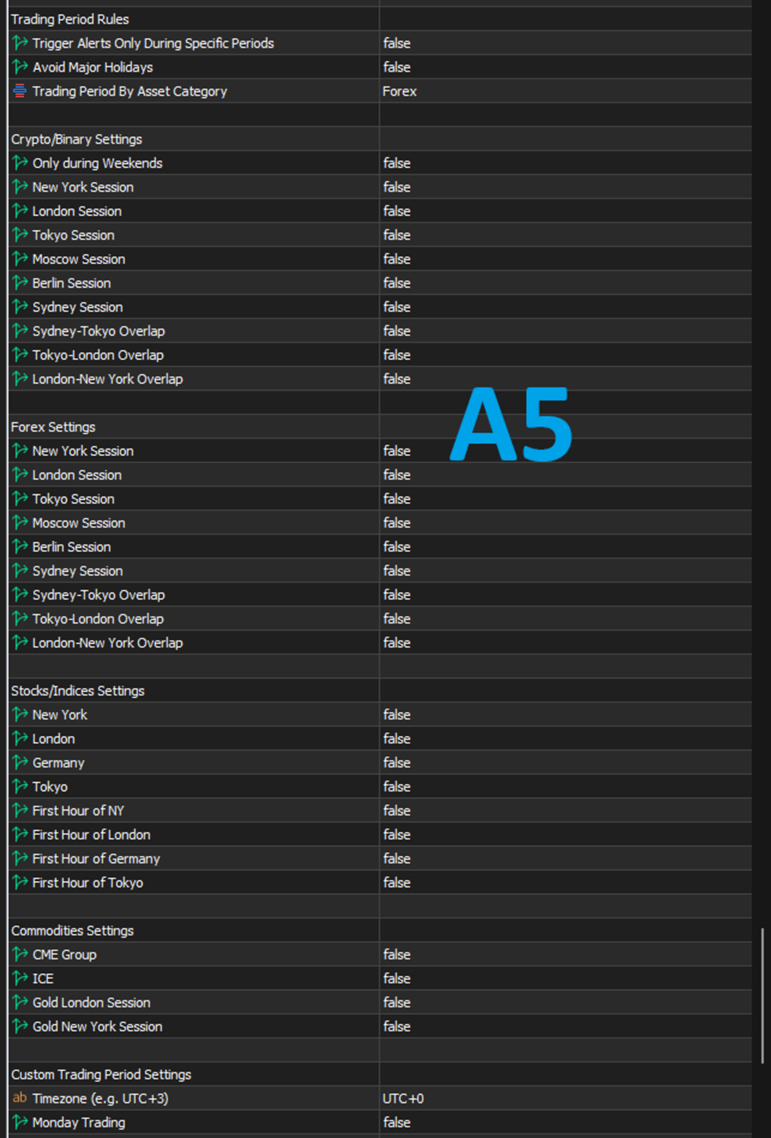
TRADING PERIOD RULES

Restrict signals to selected hours or market sessions.

Options include:
• Trigger Alerts Only During Specific Periods
• Avoid Major Holidays — New Year, Christmas, US Independence Day, and US Thanksgiving
• Trading Period by Asset Category

Crypto / Binary:
• Includes a weekends-only option

Forex:
• New York, London, Tokyo, Moscow, Berlin, Sydney
• Sydney–Tokyo, Tokyo–London, and London–New York overlaps

Stocks / Indices:
• NYSE, LSE, FWB, and TSE sessions
• First-hour-after-open filters

Commodities:
• CME, ICE, London Gold, and New York Gold sessions

Custom:
• Day-by-day schedule with timezone offset, start hour, and end hour

———————————————————————————————————

SUMMARY — WHAT THE PAID VERSION ADDS

Compared with the free version, the paid version provides:

• Full control of every MA used by the indicator: period, shift, method, and applied price
• 35 Method @ Applied Price combinations for every configurable MA (includes VWMA)
• Optional on-chart plotting of every MA in the system, with five master visibility toggles
• Per-MA color and width inputs for all 55 configurable MAs
• 17 configurable validation slots for Early signals
• 17 configurable validation slots for Full signals
• 17 configurable MTF trend-filter MA slots
• Independent Early and Full signal timing
• Optional arrow drawing on intrabar signals (off by default)
• Early and Full signal systems with independent MA configurations
• Optional backtest/diagnostic logging

If the fixed MA library of the free version already meets your needs, the free version may be all you need. If you want to build your own exact MA configuration and control the validation and trend-filter structures — or simply want to support the work — this paid version gives you that flexibility.

———————————————————————————————————

IMPORTANT: This indicator is a technical tool, not financial advice and not a guarantee of profitable results. Test your configuration and understand the settings before using it in live trading.

Please feel free to join this Telegram group where users can share their strategies and settings that work for them using this indicator --> t.me/MTFMACS
Produits recommandés
MercariaPattern1-2-3 відстежує рух ціни, знаходить трьоххвильові структури 1-2-3 та підсвічує момент, коли сценарій підтверджується пробоєм ключового рівня. MercariaPattern1-2-3 tracks price movement, detects three-leg 1-2-3 structures and highlights the moment when the scenario is confirmed by a key level breakout. Індикатор збирає локальні свінги в компактну фігуру 0–1–2–3 , чекає підтвердженого пробою та будує стрілку входу з готовими рівнями SL/TP. The indicator combines local swings into a
Seconds Charts
Aleksandr Goryachev
Micro  ******************* Секундные графики MT5 ********************** Более точного инструмента для входа в сделку вы не найдёте. Входные параметры: Timeframe, sek - период построения графика, секунды Displayed bars - отображаемые бары Step of price levels, pp, 0-off - шаг отрисовки ценовых уровней, пункты Scale points per bar, 0-off - масштаб в пунктах на бар Show lines - отображение текущих уровней Show comment - отображение комментария Standard color scheme - стандартная цветовая сх
Overview The Market Perspective Structure Indicator is a comprehensive MetaTrader indicator designed to provide traders with a detailed analysis of market structure across multiple timeframes. It identifies and visualizes key price action elements, including swing highs and lows, Break of Structure (BOS), Change of Character (CHOCH), internal structures, equal highs/lows, premium/discount levels, previous levels from higher timeframes, and trading session zones. With extensive customization opt
Un indicateur de détection de tendance propre pour MT5, basé sur la structure du marché, avec des flèches de tendance visuelles, des marqueurs de pivots valides et des zones structurelles optionnelles. STS Structure Trend Detector est un indicateur propre pour MetaTrader 5, conçu pour détecter la direction de la tendance du marché à partir de la structure du prix. STS Structure Trend Detector est conçu pour les traders qui souhaitent disposer d’un outil visuel simple afin de suivre la structure
RSI Divergence Risk Target Signals RSI Divergence Risk Target Signals is a MetaTrader 5 indicator that detects confirmed bullish and bearish RSI divergence and combines the signals with optional trend filters, ATR-based Stop Loss levels, three Take Profit targets, alerts and an internal trade statistics dashboard. The indicator compares confirmed RSI pivot structure with corresponding price highs and lows. It is designed to help traders identify momentum divergence while providing a structure
Matreshka
Dimitr Trifonov
5 (2)
Matreshka self-testing and self-optimizing indicator: 1. Is an interpretation of the Elliott Wave Analysis Theory. 2. Based on the principle of the indicator type ZigZag, and the waves are based on the principle of interpretation of the theory of DeMark. 3. Filters waves in length and height. 4. Draws up to six levels of ZigZag at the same time, tracking waves of different orders. 5. Marks Pulsed and Recoil Waves. 6. Draws arrows to open positions 7. Draws three channels. 8. Notes support and re
Gartley Projections D
Oleksandr Medviediev
3 (2)
The indicator identifies the harmonic patterns (XABCD) according to developments of H.M.Gartley ( "Profits in the Stock Market" , 1935г). It projects D-point as a point in the perspective projection (specify ProjectionD_Mode = true in the settings). Does not redraw. When a bar of the working timeframe closes, if the identified pattern point has not moved during Patterns_Fractal_Bars bars, an arrow appears on the chart (in the direction of the expected price movement). From this moment on, the ar
Trade smarter, not harder: Empower your trading with Harmonacci Patterns This is arguably the most complete harmonic price formation auto-recognition indicator you can find for the MetaTrader Platform. It detects 19 different patterns, takes fibonacci projections as seriously as you do, displays the Potential Reversal Zone (PRZ) and finds suitable stop-loss and take-profit levels. [ Installation Guide | Update Guide | Troubleshooting | FAQ | All Products  ] It detects 19 different harmonic pric
IVISTscalp5
Vadym Zhukovskyi
5 (6)
Французский [iVISTscalp5] : Un laboratoire d’étude du comportement du marché à travers le temps TLV Framework | Liquidity Activation Points ⸻ Description Générale iVISTscalp5 est un indicateur multi-niveau de timings et de structure de prix développé dans le cadre du projet VISTmany. Le système prévoit le temps, la direction et l’amplitude du mouvement à travers les Liquidity Activation Points (timings). L’indicateur iVISTscalp5 peut être utilisé avec les paramètres par défaut pou
The indicator detects and displays М. Gartley's Butterfly pattern. The pattern is plotted by the extreme values of the ZigZag indicator (included in the resources, no need to install). After detecting the pattern, the indicator notifies of that by the pop-up window, a mobile notification and an email. The pattern and wave parameters are displayed on the screenshots. The default parameters are used for demonstration purposes only in order to increase the amount of detected patterns. Parameters z
PZ Swing Trading MT5
PZ TRADING SLU
5 (5)
Protect against whipsaws: revolutionize your swing trading approach Swing Trading is the first indicator designed to detect swings in the direction of the trend and possible reversal swings. It uses the baseline swing trading approach, widely described in trading literature. The indicator studies several price and time vectors to track the aggregate trend direction and detects situations in which the market is oversold or overbought and ready to correct. [ Installation Guide | Update Guide | Tro
Zone Structure Scanner Panel for MT5 Find better setups faster — without scanning charts for hours. The Zone Structure Scanner Panel for MT5 helps you automatically scan multiple symbols, detect key weekly and daily support/resistance zones, read market structure, highlight confluence, and flag H4 rejection-confirmed setups from one powerful panel. Instead of jumping from chart to chart, you get ranked opportunities in one place so you can focus on the setups that matter most. Why it stands
The Expert Advisor and the video are attached in the Discussion tab . The robot applies only one order and strictly follows the signals to evaluate the indicator efficiency. Pan PrizMA CD Phase is an option based on the Pan PrizMA indicator. Details (in Russian). Averaging by a quadric-quartic polynomial increases the smoothness of lines, adds momentum and rhythm. Extrapolation by the sinusoid function near a constant allows adjusting the delay or lead of signals. The value of the phase - wave s
Overview Harmonic Patterns MT5 is a technical analysis indicator designed for the MetaTrader 5 platform. It identifies and displays harmonic price patterns, such as Butterfly, Cypher, Crab, Bat, Shark, and Gartley, in both bullish and bearish directions. The indicator calculates key price levels, including entry, stop loss, and three take-profit levels, to assist traders in analyzing market movements. Visual elements and customizable alerts enhance usability on the chart. Features Detects six ha
L' Indicateur de Décomposition Saisonnière pour MQL5 est un outil puissant conçu pour aider les traders à identifier et analyser les tendances sous-jacentes et les modèles saisonniers au sein des données de séries temporelles financières. En décomposant les mouvements de prix en leurs composants principaux, cet indicateur offre une image plus claire de la dynamique du marché, permettant des décisions de trading plus éclairées. Caractéristiques Clés : Ligne de Tendance : Visualise clairement la d
Harmonic Pattern Scanner — Gartley, Bat, Butterfly, Crab (Auto XABCD Detection) Stop manually plotting Fibonacci retracements on every swing. This indicator scans your chart in real time, identifies X-A-B-C-D structures, and tells you exactly which harmonic pattern is forming — Gartley, Bat, Butterfly, or Crab — with entry, stop loss, and four take-profit targets calculated automatically. What it does Detects confirmed harmonic patterns the moment a D-point swing closes, and previews forming pat
All Harmonics 26
Alexey Isavnin
3.5 (4)
Harmonic patterns are characteristic series of price movements with respect to Fibonacci levels, which statistically precede price reversals. This indicator searches for harmonic patterns. It is capable of recognising 26 classical and non-classical harmonic patterns : Classical Gartley Butterfly Alternate Butterfly Bat Alternate Bat Crab Deep Crab Three Drives Non-classical Shark Alternate Shark Cypher 5-0 Anti Gartley Anti Butterfly Anti Alternate Butterfly Anti Bat Anti Alternate Bat Anti Crab
Automated Trendlines MT5
Georgios Kalomoiropoulos
Les lignes de tendance sont l'outil d'analyse technique le plus essentiel dans le trading forex. Malheureusement, la plupart des commerçants ne les dessinent pas correctement. L'indicateur Automated Trendlines est un outil professionnel pour les traders sérieux qui vous aide à visualiser le mouvement de tendance des marchés. Il existe deux types de lignes de tendance, les lignes de tendance haussières et les lignes de tendance baissières. Dans la tendance haussière, la ligne de tendance du Fo
Primes Action trace sur le graphique les niveaux haut et bas du jour, de la semaine et du mois précédents, et signale quand le prix les casse. Chaque unité de temps a sa propre couleur, les trois références sont donc faciles à distinguer. Comment les niveaux sont trouvés Le plus haut ou le plus bas exact d'une période n'est souvent qu'une mèche courte. Primes Action examine le huitième supérieur et le huitième inférieur de la période précédente terminée. Dans chacun d'eux, il trace le niveau où
Looking for reliable levels on a price chart? Already tired of searching for similar indicators? Are the levels not working out as they should? Then this is the indicator for you. Volume Prices Universal is a reliable indicator of horizontal volumes. What does it show? First of all, the main idea of ​​the indicator is to display at which price mark the price has been for the longest time. Thus, the display of price volumes on the price chart is formed. With the help of which you can very simpl
Представлен принципиально новый индикатор ZigZag, который отличается от стандартного абсолютной легкостью, быстродействием расчетов и очень высокой точностью. В основе индикатора заложен принцип цикличности рынка с совокупностью анализа количества текущих баров и их основных ценовых уровней. Чем меньше баров для определения расчетов, тем более агрессивная постройка линий индикатора. Как и в  стандартном индикаторе перерисовывается только последняя линия, при изменении достигнутого экстремума. П
TCM Trend Indicator for MetaTrader 5 highlights trend-following setups on closed candles and shows a suggested entry, stop-loss and take-profit for the latest one. What it shows - An arrow under or over the candle when a bullish or bearish trend setup appears, on closed candles only, so arrows do not repaint - Entry, stop-loss and take-profit lines for the latest setup, with the stop based on market volatility - A title and status line showing the current state Risk : reward Choose 1:1, 1:1.5, 1
Win43 Scalper
Eadvisors Software Inc.
O novo s43 Scalper para Mini-Índice (WIN-IND) faz operações de curto prazo no timeframe 1min buscando pequenas variações do mercado, utiliza nova tecnologia de trade, os resultados no intraday são íncríveis, confira:      Após a instalação adicione no gráfico dos instrumentos win para visualizar os resultados no backteste. Recomendamos o timeframe de 1min.
Turtles Professional v2.0 The Legendary Turtle Strategy, Reimagined for the Modern Trader Turtles Pro transforms the iconic 1980s Turtle Trading System into a high-performance, multi-timeframe decision engine. It eliminates guesswork by providing institutional-grade analysis on trend structure, entry quality, and volatility all on a single chart. The Strategic Edge Turtles Professional uses a Smart Weighted Bias Engine to prioritize higher time frames, ensuring your trades align with the d
Native Channels
BeeXXI Corporation
5 (1)
This indicator recognizes all support and resistance levels. A number of unique high-performance techniques have been applied, which made the existence of this indicator possible. All formed channels are naturally visible: horizontal linear linear parabolic cubic (Polynomial 3 degrees - Wave) This is due to a bundle of approximating channels. The formed channels form "standing waves" in a hierarchical sequence. Thus, all support and resistance levels are visible. All parameter management is i
Trend-Based Trading Assistant PRO  is a professional-grade Smart Money Concepts (SMC) and Price Action toolkit designed for MT5. It automates the detection of essential market structure shifts, allowing traders to identify high-probability trend reversals and continuation patterns without manual charting. By combining institutional-level logic with a powerful EMA trend filter, this indicator helps you stay on the right side of the market while avoiding "noise" and false signals. Core Features: A
ATrend
Zaha Feiz
4.63 (19)
ATREND ATREND : Comment ça fonctionne et comment l'utiliser Comment ça fonctionne L'indicateur "ATREND" pour la plateforme MT5 est conçu pour fournir aux traders des signaux d'achat et de vente robustes en utilisant une combinaison de méthodologies d'analyse technique. Cet indicateur s'appuie principalement sur la plage vraie moyenne (ATR) pour mesurer la volatilité, ainsi que sur des algorithmes de détection de tendance pour identifier les mouvements potentiels du marché. Laissez un message ap
How it works An inducement trap is a sequence, not a candle pattern. TrapRadar's state machine requires all four legs: –   Bait — an obvious level forms (minor swing, equal highs/lows, range boundary) that retail will trade the breakout of. –   Trigger — price breaks the level and actually attracts participation; relative volume rises on the breakout bar, confirming traders took the bait. –   Trap spring — within K bars a displacement candle (range greater than 1.5× ATR, closing 70%+ through its
Unlock key market insights with automated support and resistance lines Tired of plotting support and resistance lines? This is a multi-timeframe indicator that detects and plots supports and resistance lines in the chart with the same precision as a human eye would. As price levels are tested over time and its importance increases, the lines become thicker and darker, making price leves easy to glance and evaluate. [ Installation Guide | Update Guide | Troubleshooting | FAQ | All Products  ] Boo
Renko Plus
Eadvisors Software Inc.
With Renko Plus you can use the features in the Indicator functionality, just add it to the Metatrader5 chart.             The Renko chart is a type of chart, developed by the Japanese, that is constructed using price movement rather than standardized prices and time intervals like most charts. It is believed to be named after the Japanese word for bricks, "renga", as the graphic looks like a series of bricks.             A new brick is created when the price moves a specified pri
Les acheteurs de ce produit ont également acheté
Boba Analysis Suite
Trade Ready Solutions LLC
5 (2)
Boba Analysis Suite Boba Analysis Suite est un indicateur d’analyse pour MetaTrader 5. Il réunit la structure du marché, les zones de prix pertinentes et le contexte général du marché dans une même vue graphique. Développé à partir de l’expérience pratique d’un trader et formateur en trading, il accompagne une démarche d’analyse structurée : évaluer la direction du marché, identifier les niveaux importants et analyser plusieurs unités de temps conjointement. Une analyse en contexte La significat
SQN Max indicator for MT5 by ITC
Renaud Herve Francois Candel
Sqn Max Indicator Sqn Max is an exclusive indicator to trade the market with high effectiveness. The indicator is based on price action, volatility and trend. This indicator is as simple as possible but not too simple. The indicator can generate alerts to ease the trading process. You don't have to stay all day in front of your screen. The indicator can be used with any class of assets and with any time frame. It is possible to achieve better results trading our list of selected assets. We achi
Azimuth Pro
Ottaviano De Cicco
5 (7)
Azimuth Pro V2: Synthetic Fractal Structure and Confirmed Entries for MT5 Overview Azimuth Pro is a multi-level swing structure indicator by Merkava Labs . Four nested swing layers, swing-anchored VWAP, ABC pattern detection, three-timeframe structural filtering, and closed-bar confirmed entries — one chart, one workflow from micro-swings to macro-cycles. This is not a blind signal product. It is a structure-first workflow for traders who care about location, context, and timing. 1. What Change
ARICoins
Temirlan Kdyrkhan
ARICoin is a powerful trading companion designed to generate high-probability entry signals with dynamic TP/SL/DP levels based on volatility. Built-in performance tracking shows win/loss stats, PP1/PP2 hits, and success rates all updated live. Key Features: Buy/Sell signals with adaptive volatility bands Real-time TP/SL/DP levels based on ATR Built-in MA Filter with optional ATR/StdDev volatility Performance stats panel (Success, Profit/Loss, PP1/PP2) Alerts via popup, sound, push, or email Cust
ScalpPoint
Temirlan Kdyrkhan
ScalpPoint is a powerful trading companion designed to generate high-probability entry signals with dynamic TP/SL/DP levels based on volatility. Built-in performance tracking shows win/loss stats, PP1/PP2 hits, and success rates — all updated live. Key Features: Buy/Sell signals with adaptive volatility bands Real-time TP/SL/DP levels based on ATR Built-in MA Filter with optional ATR/StdDev volatility Performance stats panel (Success, Profit/Loss, PP1/PP2) Alerts via popup, sound, push, or emai
AriFocus
Temirlan Kdyrkhan
AriFocus - Non-Repainting Buy/Sell Signals AriFocus - one clear signal. AriFocus marks buy and sell signals directly on the chart and suggests a stop-loss level for each one. Every signal is confirmed on bar close and never repaints. - Buy/sell arrows, confirmed on bar close - Suggested stop-loss level for every signal - Trend band and candle coloring to show direction at a glance - 10 ready-made presets, or your own settings (14 calculation methods) - Pop-up, push and email alerts with entr
ARIPoint
Temirlan Kdyrkhan
1 (4)
ARIPoint is a powerful trading companion designed to generate high-probability entry signals with dynamic TP/SL/DP levels based on volatility. Built-in performance tracking shows win/loss stats, PP1/PP2 hits, and success rates all updated live. Key Features: Buy/Sell signals with adaptive volatility bands Real-time TP/SL/DP levels based on ATR Built-in MA Filter with optional ATR/StdDev volatility Performance stats panel (Success, Profit/Loss, PP1/PP2) Alerts via popup, sound, push, or email Cu
Zain Gold Scalping
Ahmed Gamal Abdel Nasser Mohamed
A complete price-action analysis tool built around dual independent entry logic, each confirmed against a volatility band, combined with a configurable set of nine optional confirmation filters that let you shape exactly how conservative or aggressive the tool's signals behave. Core Strategy Two independent entry setups, each triggering only when price moves outside a dynamic volatility band — giving two distinct ways to spot potential reversal points, which can be used together or separately.
SMC Sniper Pro MT5
Jordan Steven R Machell
SMC Sniper Pro MT5 SMC Sniper Pro by QuantFlow Labs is a chart indicator for liquidity-based intraday analysis. It combines session ranges, tracked liquidity sweeps and three selectable entry models in one configurable workspace. It displays setup context and entry references; it does not open, manage or close trades. Three selectable entry models Model 1 - Inverse Fair Value Gap breakout: after an eligible liquidity sweep, the indicator waits for a confirmed close through the relevant fair valu
VTrende Pro
Andrii Diachenko
5 (1)
VTrende Pro - MTF indicator for trend trading with a display panel for MT5 *** Videos can be translated into any language using subtitles (video language - Russian) Although the signals of the VTrende Pro indicator can be used as signals of a full-fledged trading system, it is recommended to use them in conjunction with the Bill Williams TS. VTrende Pro is an extended version of the VTrende indicator. Difference between Pro version and VTrende: - Time zones - Signal V - signal 1-2 waves -    S
QNC Scalper
Yordiana Enggelina Seko
Here is a professional and engaging description for the Indikator QNC Scalper tool in English, tailored for traders and platforms: Indikator QNC Scalper Unlock precision trading in fast-paced markets with the Indikator QNC Scalper —an advanced technical analysis tool engineered specifically for scalpers and day traders. Whether you are trading forex, crypto, or indices, this indicator cuts through market noise to deliver clear, high-probability entry and exit signals. Key Features Real-Time M
TrendMaestro5
Stefano Frisetti
note: this indicator is for METATRADER4, if you want the version for METATRADER5 this is the link:  https://www.mql5.com/it/market/product/108106 TRENDMAESTRO ver 2.5 TRENDMAESTRO recognizes a new TREND from the start, he never makes mistakes. The certainty of identifying a new TREND is priceless. DESCRIPTION TRENDMAESTRO identifies a new TREND in the bud, this indicator examines the volatility, volumes and momentum to identify the moment in which there is an explosion of one or more of these da
OmniSync Projection
Antonio-alin Teculescu
5 (1)
Chronos Fractal Engine is an innovative price projection indicator for MetaTrader 5, designed to transform your technical analysis by intelligently identifying and projecting historical price patterns. Built upon an advanced correlation algorithm and the fractal principles of the market, this powerful tool visualizes potential future price movements, giving you a unique edge in your trading decisions. What is Chronos Fractal Engine? At its core, the Chronos Fractal Engine employs a sophisticat
Title:FX-AIEA Supply and Demand Zone Indicator (MT5) — Technical Overview Version: 2.51 | Platform: MetaTrader 5 Introduction Supply and demand zones are considered a core manifestation of institutional order flow, providing a more direct reflection of buying and selling pressure than traditional support/resistance levels. This indicator attempts to automate the identification of high-probability supply and demand zones using an adaptive ZigZag algorithm, reducing the subjectivity and time asso
Zain Gold ScalpingV5
Ahmed Gamal Abdel Nasser Mohamed
Zain Gold Scalping V5 is a technical analysis indicator for MetaTrader 5 designed for Forex and Gold markets. It provides chart-based market information, trend analysis, signal conditions, and an on-screen dashboard to help traders analyze price movement across multiple timeframes. Main Features The indicator supports multiple timeframes, including M1, M5, M15, M30, H1 and higher timeframes. It can be used with Gold (XAUUSD), Forex currency pairs, indices and other supported instruments. The in
The indicator is designed to close positions on the market in time. For example: to take profits ahead of schedule if the price has not reached TakeProfit, and the market is turning around. The indicator analyzes the momentum, not the trend. He does not give any information about the trend. The indicator is well suited for finding divergence. The Ershov 38 Parrots indicator dynamically adjusts to the market and detects price movement impulses of medium and high amplitude. It almost does not rea
AriX
Temirlan Kdyrkhan
1 (4)
AriX Indicator for MT5 A powerful trend-following and signal-evaluation tool AriX is a custom MT5 indicator that combines Moving Averages and ATR-based risk/reward logic to generate clear buy/sell signals. It visualizes dynamic SL/TP levels, evaluates past trade outcomes, and displays win/loss statistics in a clean on-chart panel. Key features include: Buy/Sell signals based on MA crossovers ATR-based SL/TP1/TP2/TP3 levels with visual lines and labels Signal outcome tracking with real-time stat
Meravith Scanner
Ivan Stefanov
5 (3)
MERAVITH SCANNER est un indicateur professionnel pour les marchés financiers sur MetaTrader 5, qui regroupe plusieurs outils d’analyse en un seul système intégré. Il effectue tous les calculs automatiquement en utilisant une méthodologie propriétaire de prix moyen pondéré par le volume (VWAP), éliminant ainsi toute interprétation subjective. Cet indicateur fonctionne sur toutes les classes d’actifs (Forex, actions, indices, matières premières, cryptomonnaies) et sur toutes les périodes, de M1 au
En bref Cet indicateur combine deux experts — le RSI et le MACD — en un seul système. Au lieu de regarder deux graphiques séparés et de faire des suppositions, il prend la décision pour vous : lorsque les deux indicateurs sont d'accord, il dessine une flèche (achat ou vente). Le plus important : les flèches ne sont pas repeintes . Une fois apparues, elles restent là où elles sont. Vous pouvez backtester et trader en direct en toute confiance. Que signifie "Combo" Normalement, un trader regarde l
Meravith MT5
Ivan Stefanov
5 (3)
MERAVITH est un indicateur de volume et de liquidité multi-unités de temps pour MetaTrader 5 qui montre la tendance, les zones de support et de résistance, l'entrée, les objectifs et le stop loss sur chaque unité de temps. Il vous donne une carte complète de la liquidité du marché, un outil de liquidité dans le style des hedge funds, et il fait tous les calculs automatiquement avec une méthode propre de prix moyen pondéré par le volume, donc il n'y a pas d'interprétation subjective. Fonctionne s
Cycles Plotter
Edoardo Centorame
Cycles Plotter Indicateur de Cycles Personnalisables avec Moyennes Mobiles et Date de Début Le Cycles Plotter est un indicateur technique avancé qui trace deux cycles sinusoïdaux entièrement personnalisables, uniquement sur input de l’utilisateur. Il ne génère pas de cycles automatiquement: tous les cycles sont calculés exclusivement en fonction des paramètres définis par l’utilisateur, offrant aux traders un outil visuel pour étudier les oscillations de prix et les changements potentiels de ten
Volume Arrow Signal Product Description Volume Arrow Signal is a smart trading indicator designed to help traders identify potential buy and sell opportunities using price action, volume behavior, and directional arrow signals. The indicator places clear arrows directly on the chart, making it easy to spot possible market reversals, trend continuations, and entry opportunities without spending hours analyzing charts manually. Whether you are trading Gold (XAUUSD) , Forex pairs, Indices, or Crypt
MasterTrend
Temirlan Kdyrkhan
MasterTrend Indicator for MT5 A powerful trend-following and signal-evaluation tool MasterTrend   is a custom MT5 indicator that combines Moving Averages and ATR-based risk/reward logic to generate clear buy/sell signals. It visualizes dynamic SL/TP levels, evaluates past trade outcomes, and displays win/loss statistics in a clean on-chart panel. Key features include: Buy/Sell signals based on MA crossovers ATR-based SL/TP1/TP2/TP3 levels with visual lines and labels Signal outcome tracking wit
SMC Sweep Fvg MT5
Daniil Sleptsov
5 (1)
SMC Sweep Fvg MT5 — voyez le marché comme le smart money, directement sur votre graphique Vous connaissez ce sentiment : le prix prend votre stop, se retourne et part exactement là où vous l’attendiez. Vous aviez raison sur la direction. Vous n’avez eu tort que sur l’entrée. Cet indicateur existe pour que cela arrive moins souvent. Il prend en charge la partie la plus lourde de l’analyse — le marquage du graphique — et vous laisse l’essentiel : la décision. Ce que vous voyez sur le graphique
Gold Xausd Hunter
Metin Erkamoglu
5 (2)
MATADOR GOLD XAUUSD M5 Scalp Signals for MT5 MATADOR GOLD is a decision-support indicator for MetaTrader 5, designed for traders who analyze short-term Gold movement on the M5 timeframe. The indicator does not open, close, or manage trades automatically. It provides buy and sell signal guidance so the user can make their own trading decisions according to their risk plan, broker conditions, and trade management rules. Main purpose MATADOR GOLD is built to help traders avoid noisy signal flow and
KenKem Master Volume Profiler - Brief Introduction A Display-only volume-profile cockpit for XAUUSD, BTCUSD and other liquid symbols. Draws profile structure, multi-timeframe flow, EMA trend and study-only setup markers. Places no orders. Not a signal service.  It maps where the market has actually traded and reads recent order flow, so you can see structure and lean at a glance.  What it shows: Master and local volume profiles (POC and value-area high/low) - the price shelves that matter. A liv
Классификатор силы тренда. Показания на истории не меняет. Изменяется классификация только незакрытого бара. По идее подобен полной системе ASCTrend, сигнальный модуль которой, точнее его аппроксимация в несколько "урезанном" виде, есть в свободном доступе, а также в терминале как сигнальный индикатор SilverTrend . Точной копией системы ASCTrend не является. Работает на всех инструментах и всех временных диапазонах. Индикатор использует несколько некоррелируемых между собой алгоритмов для класси
FFx Universal Strength Meter PRO is more than a basic strength meter. Instead of limiting the calculation to price, it can be based on any of the 19 integrated strength modes + 9 timeframes. With the FFx USM, you are able to define any period for any combination of timeframes. For example, you can set the dashboard for the last 10 candles for M15-H1-H4… Full flexibility! Very easy to interpret... It gives a great idea about which currency is weak and which is strong, so you can find the best pai
The FFx Universal MTF alerter shows on a single chart all the timeframes (M1 to Monthly) with their own status for the chosen indicator. 9 indicators mode (MACD-RSI-Stochastic-MA-ADX-Ichimoku-Candles-CCI-PSAR). Each can be applied multiple times on the same chart with different settings. Very easy to interpret. Confirm your BUY entries when most of the timeframes are showing green color. And confirm your SELL entries when most of the timeframes are showing red color. 2 Alert Options : input to s
The FFx Watcher PRO is a dashboard displaying on a single chart the current direction of up to 15 standard indicators and up to 21 timeframes. It has 2 different modes: Watcher mode: Multi Indicators User is able to select up to 15 indicators to be displayed User is able to select up to 21 timeframes to be displayed Watcher mode: Multi Pairs User is able to select any number of pairs/symbols User is able to select up to 21 timeframes to be displayed This mode uses one of the standard indicators
Plus de l'auteur
Please feel free to join this Telegram group where users can share their strategies and settings that work for them using this indicator --> t.me/MTFMACS ALSO AVAILABLE ON TRADINGVIEW The MTFMACS family is now available on TradingView for users who prefer charting on that platform. Contact me via the Telegram group for direct access. ABOUT THIS FREE VERSION Th
FREE
Please feel free to join this Telegram group where users can share their strategies and settings that work for them using this Expert Advisor --> t.me/MTFMACS ALSO AVAILABLE ON TRADINGVIEW The signal engine of this EA is available on TradingView as a backtesting and study tool. The TradingView version runs the same crossover, validation, and MTF filter logic and includes all 35 MA method/price combinations (including VWMA). Use it to evaluate your configuration against historical data, then re
Filtrer:
Aucun avis
Répondre à l'avis