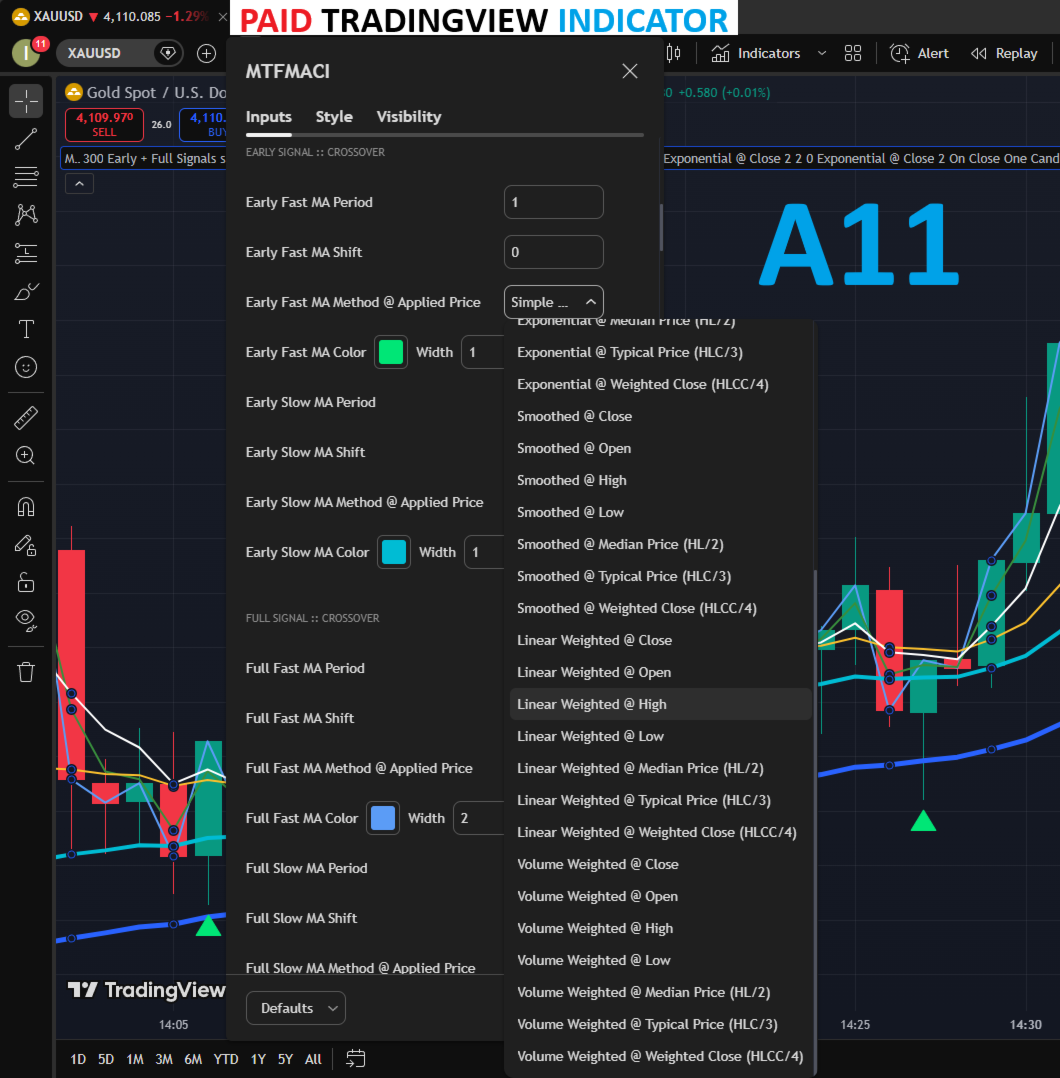
Multiple Timeframe Filtered MA Crossover Indicator

Please feel free to join this Telegram group where users can share their strategies and settings that work for them using this indicator --> t.me/MTFMACS
ALSO AVAILABLE ON TRADINGVIEW
The MTFMACS family is now available on TradingView for users who prefer charting on that platform. Contact me via the Telegram group for direct access.
—————————————————————————————————

BEFORE YOU PURCHASE — PLEASE READ

A free version of this indicator is available. Please purchase this paid version only if you want complete control over how the moving averages are configured, or if you simply want to support my work.

The default settings are examples only and are not guaranteed to make money. You should already have a moving-average strategy that you have tested and believe works for you. This indicator is a tool for applying that strategy without constant chart monitoring.

———————————————————————————————————

WHAT'S NEW IN v1.50

• Independent Signal Timing: You can now set separate timing modes for Early and Full signals (e.g., Early on Intrabar for fast alerts, Full on Close for strict confirmation).
• Expanded to 17 Validation & Filter MAs: Added 6 more slots each to the validation stacks and the trend-direction filter to give you ultimate control over your market structure.
• Visual Filter MAs: The Filter MAs can now be plotted directly on your chart with fully customizable colors, widths, and a new master visibility toggle.
• Volume Weighted MA (VWMA): Added VWMA as a first-class moving average method across all slots.
• Optional Intrabar Arrows: Added a new toggle to allow arrows to be drawn on Intrabar signals (off by default to prevent repainting).
• Stability Fixes: Resolved MTF data loading bugs and chart scaling issues when higher timeframe data is still downloading.

———————————————————————————————————

WHAT IS DIFFERENT ABOUT THE PAID VERSION

The free version uses a fixed library of pre-built moving averages. You select an MA such as EMA 14 or WMA 100 from a dropdown.

The paid version removes that limitation. Every MA used by the indicator — crossover MAs, validation MAs, and higher-timeframe trend-filter MAs — is fully configurable.

For every MA you can set:
• Period — any integer, such as 7, 14, 100, 350 or 999
• Shift — forward/backward shift, default 0
• Method @ Applied Price — one dropdown combining 5 smoothing methods and 7 price types (35 combinations)

Smoothing methods:
• Simple (SMA)
• Exponential (EMA)
• Smoothed (SMMA)
• Linear Weighted (LWMA)
• Volume Weighted (VWMA)

Applied prices:
• Close
• Open
• High
• Low
• Median Price (HL/2)
• Typical Price (HLC/3)
• Weighted Close (HLCC/4)

This lets you configure combinations such as EMA 200 on High, SMA 55 on Typical Price, LWMA 13 on Weighted Close, or VWMA 20 on Close — or create your own combination directly from the indicator inputs.

Everything else — signal timing, arrows, alerts, MTF RSI, MTF MACD, the previous-candle Fibonacci/price filter, and trading periods — works as in the free version.

———————————————————————————————————

MA VISIBILITY — FULL CHART CONTROL

The paid version lets you optionally draw any of the moving averages that drive the signal logic directly on the chart.

Five master toggles:
• Show Early Crossover MAs
• Show Full Crossover MAs
• Show Early Validation MAs
• Show Full Validation MAs
• Show Filter MAs

Each toggle controls the whole group. When a group is enabled, its MAs are plotted with the exact period, shift, method, and applied price you configured for the signal logic — no need to add them manually.

In addition, every one of the 55 MAs in the system now has its own Color and Width input. You can visually distinguish the moving averages at a glance, or match them to your existing chart template. The visibility toggles are purely cosmetic: they do not affect the signal logic, and the MAs continue to gate signals in the background whether they are drawn or not.

If you prefer a clean chart for price action, trendlines, or order blocks, leave all five toggles off and use the indicator exactly as before.

———————————————————————————————————

WHAT MAKES THIS INDICATOR DIFFERENT

Most MA crossover indicators simply watch two MAs and fire an arrow whenever they cross. They do not necessarily consider market structure, higher-timeframe direction, momentum, or where price is trading.

This indicator is built around a different idea: a crossover can be filtered by the context surrounding it.

You can:
• Use up to 17 configurable MAs on the signal timeframe and require them to be in a specific order.
• Filter signals using an MA trend structure from another timeframe (up to 17 MAs).
• Require MTF RSI and/or MACD conditions.
• Require the crossover to occur inside a defined Fibonacci/price zone based on the previous higher-timeframe candle.
• Restrict signals to selected trading periods.

Enable as many or as few filters as your strategy requires. The goal is not to produce more arrows, but to let you define exactly which conditions a signal must satisfy.

———————————————————————————————————

HOW THE INDICATOR WORKS

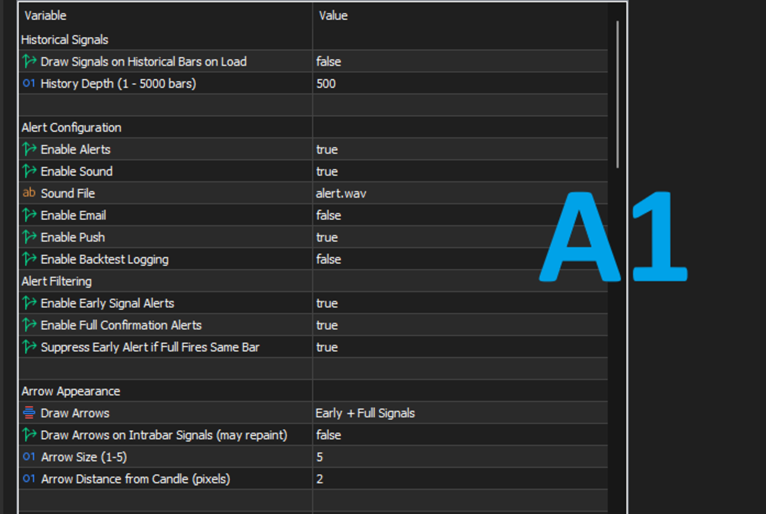
ALERT CONFIGURATION (Image A1)

Each alert type can be enabled independently:
• Enable Alerts — pop-up alert window
• Enable Sound — plays your selected .wav file
• Enable Email — sends to your terminal-configured email
• Enable Push — sends to the MetaTrader mobile app
• Enable Backtest Logging — writes diagnostic values to the Experts log for tuning

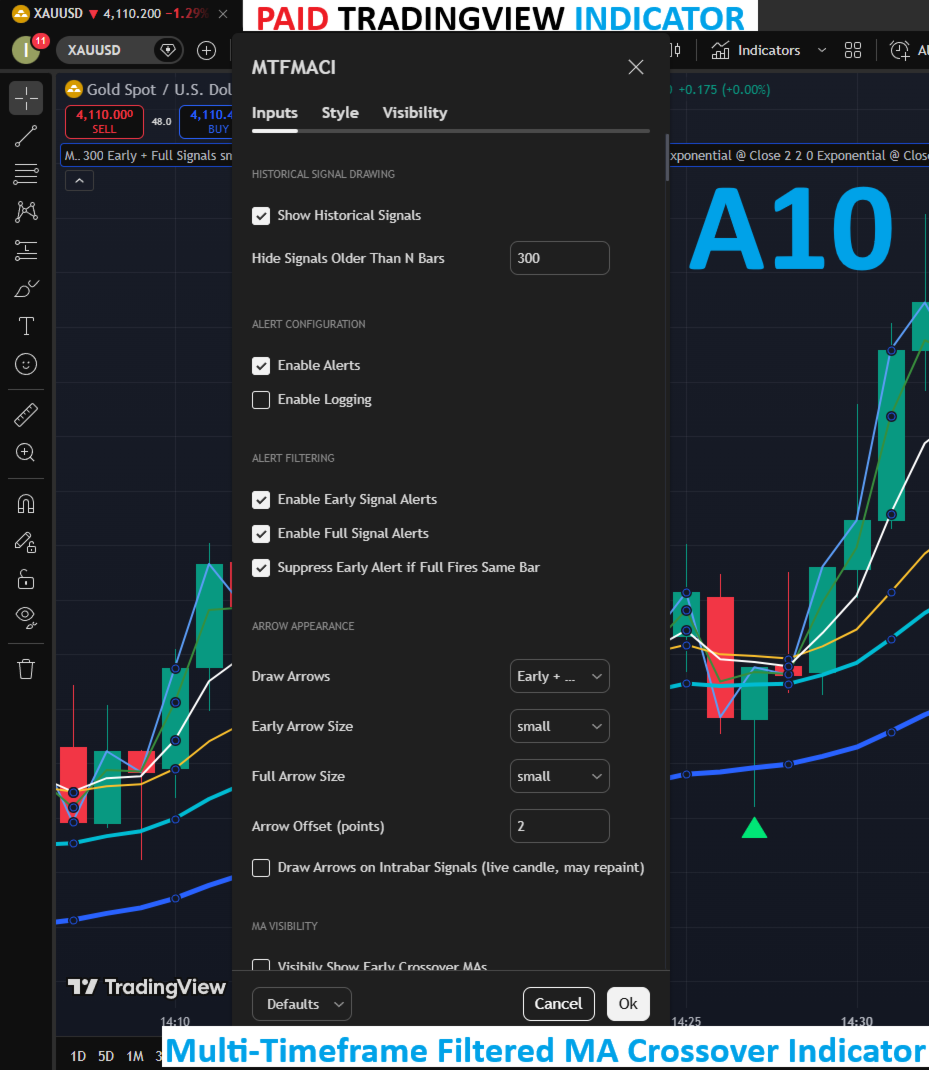
ALERT FILTERING
• Enable Early Signal Alerts
• Enable Full Confirmation Alerts
• Suppress Early Alert if Full Fires Same Bar — if Early and Full fire on the same bar in the same direction, only the Full alert is sent.

ARROW APPEARANCE
• Draw Arrows — No Arrows, Early + Full Signals, or Full Signals Only
• Arrow Size — 1 to 5
• Arrow Distance from Candle — pixel offset
• Draw Arrows on Intrabar Signals — default OFF. When enabled, arrows appear on the still-forming bar for any subsystem set to Intrabar timing. Off by default because intrabar signals can repaint.

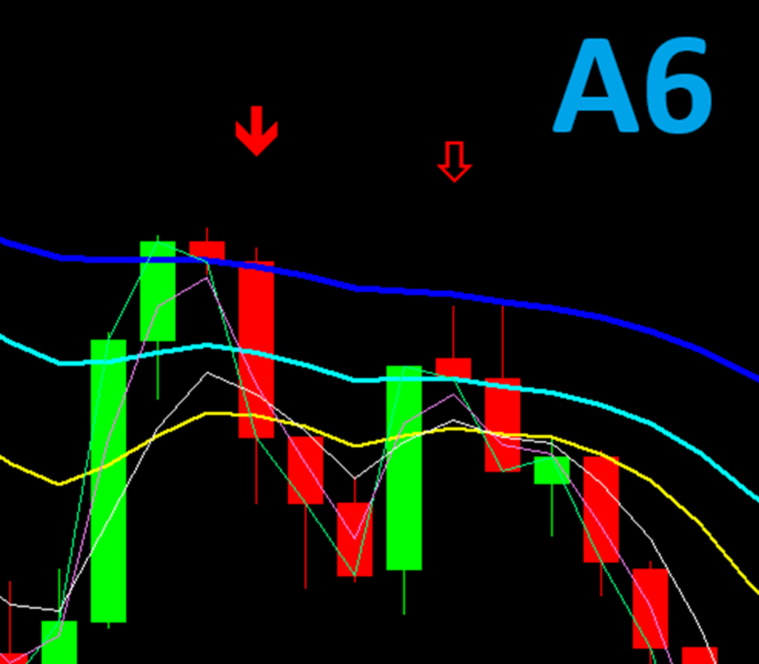
Image A6 — Screenshot showing the indicator's arrow appearance, with the hollow arrows representing the Early signals and the full-body colored arrows representing Full signals.

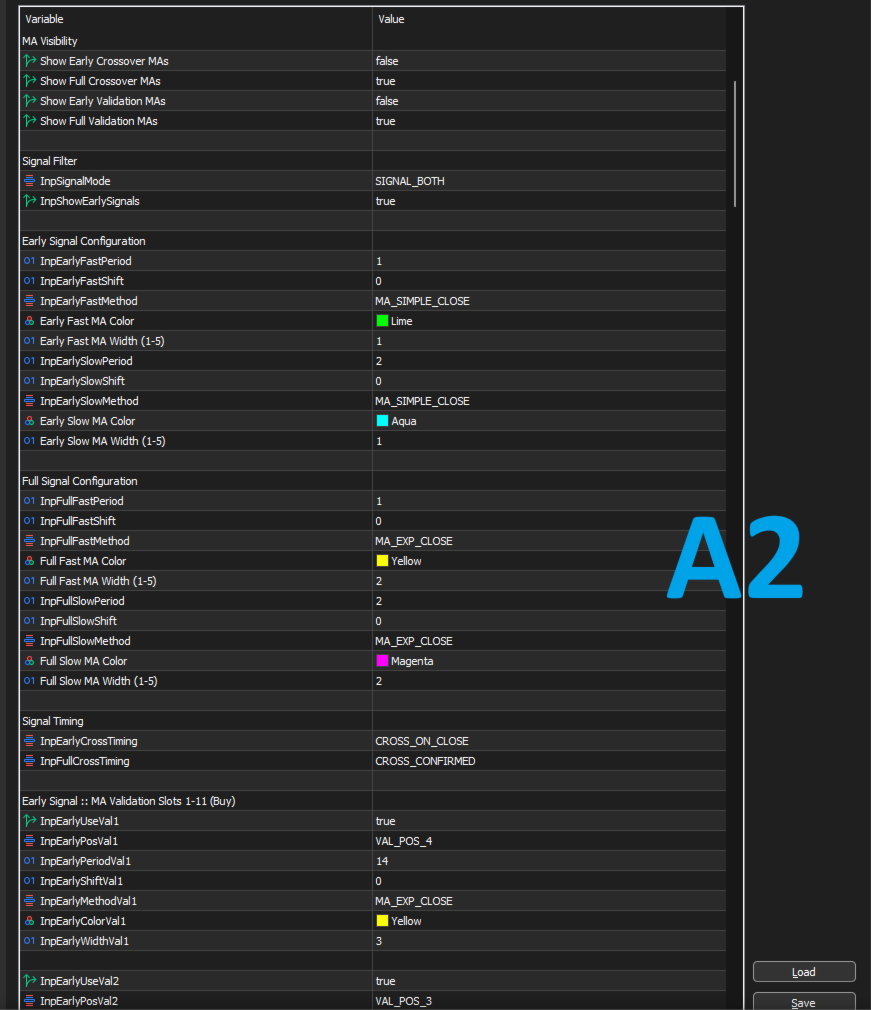
SIGNAL FILTER (Image A2)
• Signal Mode — Long Only, Short Only, or Both Directions
• Show Early Signals — master switch for the Early subsystem

EARLY SIGNAL CONFIGURATION

The Early signal detects the crossover earlier in its development, before the full validation stack has necessarily aligned. It provides an early indication that a Full signal may be forming.

Configure:
• Early Fast MA Period
• Early Fast MA Shift
• Early Fast MA Method @ Applied Price
• Early Slow MA Period
• Early Slow MA Shift
• Early Slow MA Method @ Applied Price

All six inputs are fully configurable. For example, you can use 1 SMA crossing 2 SMA, 9 EMA crossing 21 EMA, or 8 EMA on High crossing 21 LWMA on Typical Price.

FULL SIGNAL CONFIGURATION

The Full signal is the confirmed crossover. It fires only when the crossover occurs and all enabled validation/filter conditions agree.

Configure:
• Full Fast MA Period
• Full Fast MA Shift
• Full Fast MA Method @ Applied Price
• Full Slow MA Period
• Full Slow MA Shift
• Full Slow MA Method @ Applied Price

The Full pair can be completely different from the Early pair, allowing a two-stage system: an aggressive Early crossover followed by a stricter Full confirmation.

SIGNAL TIMING — INDEPENDENT FOR EARLY AND FULL

The paid version gives you two separate timing settings — one for the Early subsystem and one for the Full subsystem. The free version uses a single shared setting.

• Early Signal Timing Mode
• Full Signal Timing Mode

Each can be set to:
• Intrabar — detects signals on the live, still-forming candle. Fastest but noisiest; the candle can change. Alerts fire; arrows only if you enable Draw Arrows on Intrabar Signals.
• On Close of Cross Candle (default) — detects the signal after the crossover candle closes. Arrows are drawn, no repainting.
• One Candle After Close — the crossover must have occurred on the previous closed candle and the relationship must still hold on the current closed candle. Filters crosses that immediately reverse.

Common combinations: Early on Intrabar for fast heads-up alerts while Full waits for On Close confirmation. Or both on On Close for a clean, no-repaint workflow.

———————————————————————————————————

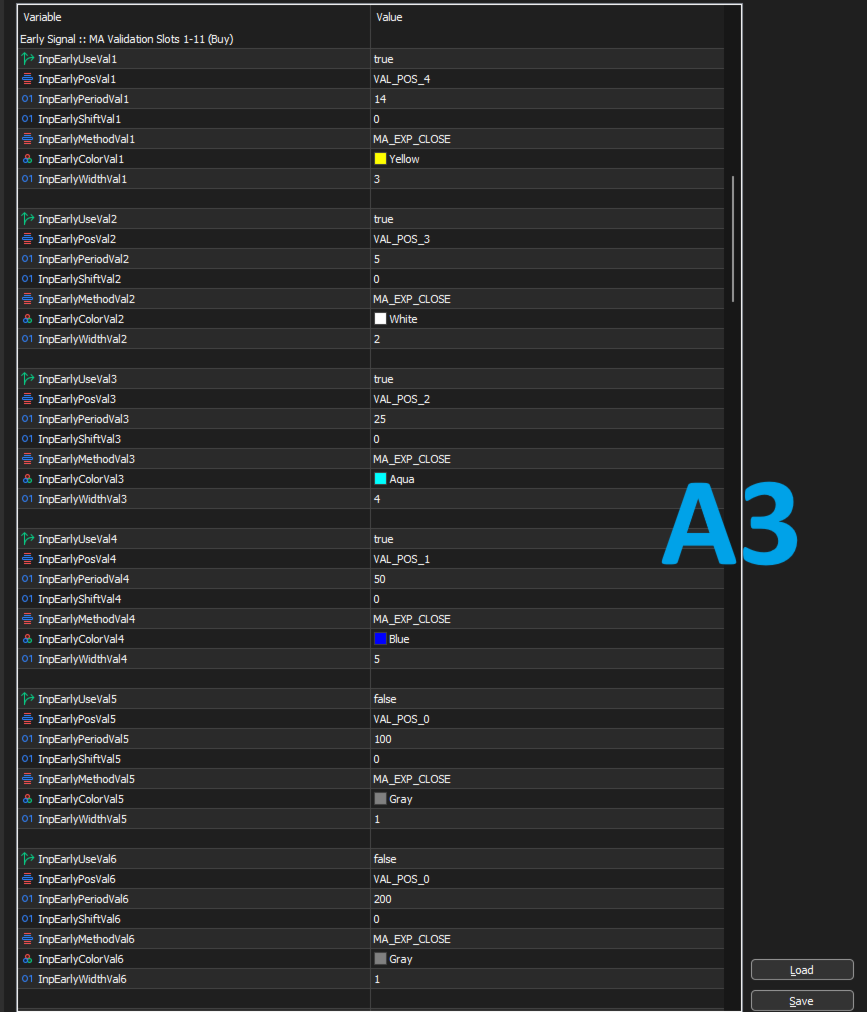
MA VALIDATION ORDER — THE HEART OF THE INDICATOR (Images A3, A6)

There are two validation sections:
• Early Signal :: MA Validation Slots 1–17 (Buy)
• Full Signal :: MA Validation Slots 1–17 (Buy)

Each section provides 17 configurable validation slots. Each slot has:
• Use Validation MA
• Validation MA Position — 0 to 17
• Validation MA Period
• Validation MA Shift
• Validation MA Method @ Applied Price
• Validation MA Color
• Validation MA Width

The Position number is not the MA period. It defines where that MA belongs in your required validation stack.

When a crossover occurs, the indicator checks the enabled MAs against the order you defined:
• Buy — MA values must be in strictly descending order.
• Sell — the same order is checked in reverse, so values must be in strictly ascending order.

If the required order is not present, the signal is rejected and no arrow or alert is generated.

EXAMPLE

You want a bullish stack to look like this on the chart:

EMA 14 (top — highest value)
EMA 5
EMA 25
EMA 50 (bottom — lowest value)

You also want the Early crossover to be 1 SMA crossing 2 SMA upwards for the bullish signal, and 1 EMA crossing 2 EMA upwards for the Full confirmation signal.

You would set:

MA Enable Position
EMA 14 yes 4
EMA 5 yes 3
EMA 25 yes 2
EMA 50 yes 1

The indicator sorts these by position, giving [EMA 14, EMA 5, EMA 25, EMA 50]. For a Buy signal it then requires:

EMA 14 > EMA 5 > EMA 25 > EMA 50

If that chain holds at the moment of the crossover, the Buy is valid. If EMA 14 pokes above EMA 5, or EMA 25 above EMA 14, the signal is discarded.

Image A3 — showing the indicator's MA validation order settings input section.

Image A6 — showing how the given example above would look for a bearish signal. The thick dark blue line at the top is the 50 EMA and the aqua line following beneath it is the 25 EMA, followed by the 5 EMA which is a thin white line, then lastly the 14 EMA which is the yellow line. The green and purple lines crossing each other are the 1 EMA and 2 EMA respectively. The 1 SMA and 2 SMA that drive the Early subsystem are not visible.

Note: If you want to include the moving averages involved in the crossover in the MA validation order section, you can — but only the Slow MA. If you include the Fast MA as well, the logic will not work, because the Fast MA and the Slow MA are already required to be in a specific relationship by the crossover condition itself.

This validation layer is designed to reduce signals during choppy conditions where MAs repeatedly cross and tangle. You can use only a few MAs for a looser filter or up to 17 for a stricter structure.

———————————————————————————————————

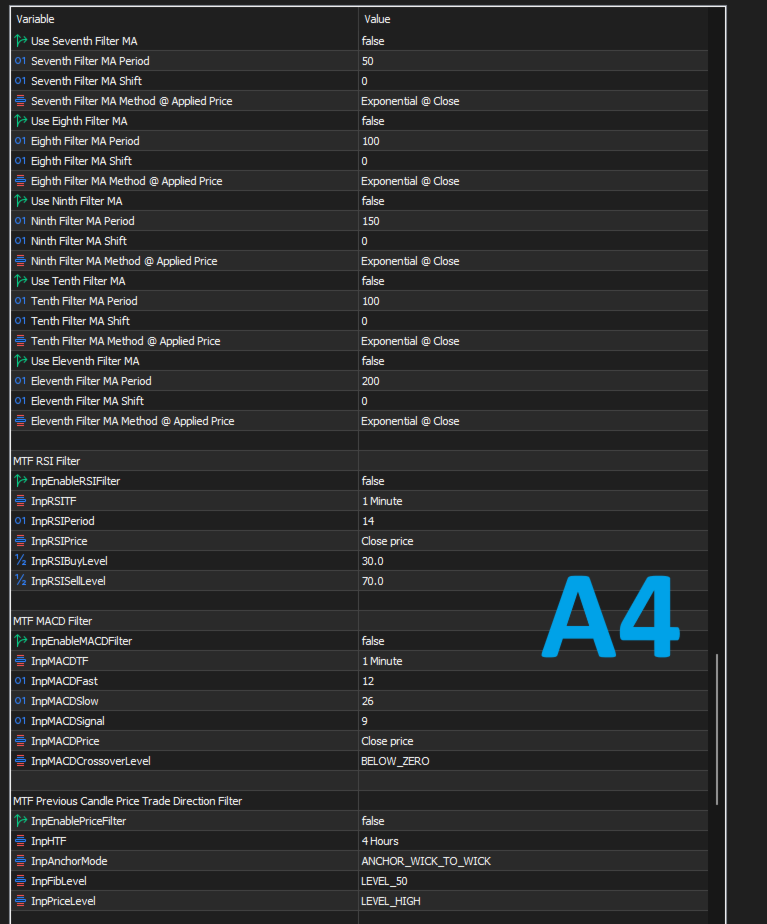
SIGNALS BY MARKET DIRECTION — MTF MA TREND FILTER (Image A4)

This filter checks the trend structure on another timeframe. It is separate from the validation stack, which checks the current signal timeframe.

Settings:
• Enable Signals by Trend Direction Only
• Filter Mode:

  • Include Price — Buy requires Price > MA1 > MA2 > ... > MA17

  • MA Only — requires MA1 > MA2 > ... > MA17 and ignores price
    • MA(s) Filter Timeframe — the timeframe used for the trend filter

Up to 17 filter MAs can be configured, each with:
• Use Filter MA
• Period
• Shift
• Method @ Applied Price
• Color & Width (for on-chart plotting)

Example: If you trade M5 but want signals only in the H1 trend direction, set the filter timeframe to H1 and configure your H1 MAs. An M5 Buy that conflicts with the H1 structure is rejected.

———————————————————————————————————

MTF RSI FILTER

RSI can be evaluated on a different timeframe from the chart.

Settings:
• Enable RSI Filter
• RSI Timeframe
• RSI Period
• RSI Applied Price
• RSI Buy Threshold — Buy signals pass only when RSI is at or below this level (default 30)
• RSI Sell Threshold — Sell signals pass only when RSI is at or above this level (default 70)

———————————————————————————————————

MTF MACD FILTER

MACD can also be evaluated on any selected timeframe.

Settings:
• Enable MACD Filter
• MACD Timeframe
• MACD Fast
• MACD Slow
• MACD Signal
• MACD Applied Price
• Crossover Level — Below Zero or Above Zero

Below Zero can be used for momentum reversals from lower levels, while Above Zero can be used for continuation within an established trend.

———————————————————————————————————

MTF PREVIOUS CANDLE PRICE / FIBONACCI FILTER (Images A4, A7)

This optional filter uses the most recently completed higher-timeframe candle to define an acceptance zone. A crossover is accepted only when it occurs inside the zone you configure.

The filter is OFF by default. When enabled, a signal that does not satisfy its rules is rejected even if all other enabled filters agree.

CONFIGURATION

Previous Candle Timeframe
The timeframe whose most recently closed candle is used as the reference, typically H4, D1, or W1. It must be higher than the chart timeframe; a lower setting is blocked with an error.

Fibonacci Anchor
Choose how the Fibonacci range is anchored:
• Wick to Wick — High (100%) to Low (0%), including wicks
• Body to Body — top of body (100%) to bottom of body (0%), ignoring wicks

Fibonacci Level
Available levels: 23.6%, 38.2%, 50.0%, 61.8%, 78.6%, 100.0%, and 107.0%.

The 107% level extends beyond the opposite extreme and can be used to include a sweep/stop-hunt area beyond the previous candle's high or low.

Price Reference Level
Choose Open, High, Low, or Close from the previous candle.

The selected Fibonacci price and Reference price form the acceptance zone. The indicator sorts the two prices automatically so the zone is always well-defined.

DIRECTION RULE
• Buy — the previous higher-timeframe candle must be bullish.
• Sell — the previous higher-timeframe candle must be bearish.

If the previous candle's direction does not match the signal direction, the signal is rejected before the zone is calculated.

EXAMPLE

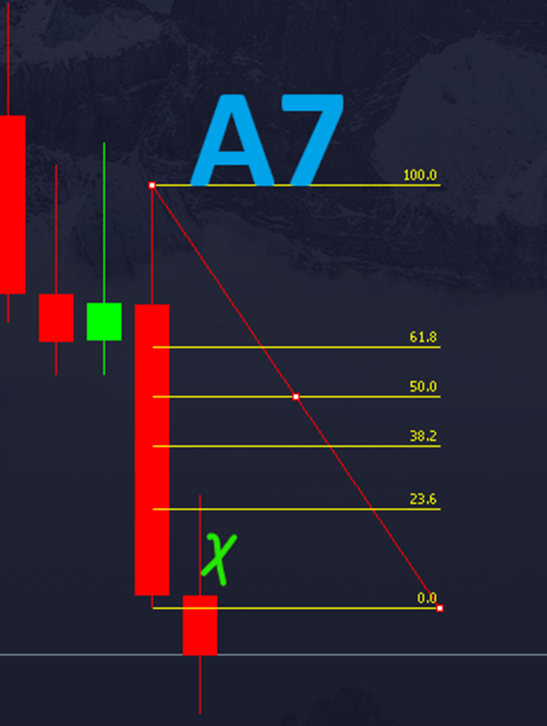
For a bearish previous candle, the Fibonacci range can be drawn from its High (100%) to Low (0%). If a Sell crossover occurs inside the selected retracement zone, it can pass the filter. If a later crossover occurs after price has moved outside the permitted zone, it is rejected.

IMPORTANT: DIPS ARE FORGIVEN

The zone is checked at the moment the crossover occurs. Earlier price movement during the current period does not automatically disqualify the signal.

If you are new to this approach, example starting combinations are:
• H4 reference candle + M1 crossover signals
• D1 reference candle + M15 crossover signals
• W1 reference candle + H4 crossover signals

These are starting points, not fixed rules. You can combine any higher-timeframe reference candle with any lower signal timeframe, provided the reference timeframe is higher.

———————————————————————————————————

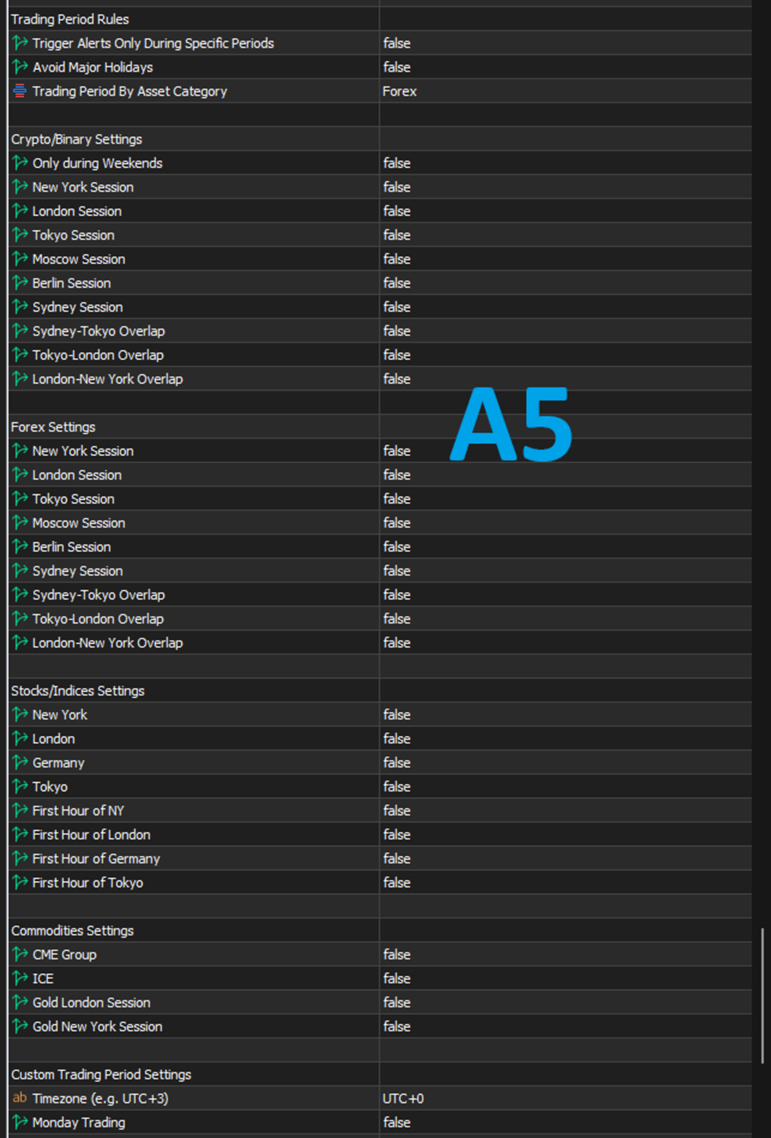
TRADING PERIOD RULES

Restrict signals to selected hours or market sessions.

Options include:
• Trigger Alerts Only During Specific Periods
• Avoid Major Holidays — New Year, Christmas, US Independence Day, and US Thanksgiving
• Trading Period by Asset Category

Crypto / Binary:
• Includes a weekends-only option

Forex:
• New York, London, Tokyo, Moscow, Berlin, Sydney
• Sydney–Tokyo, Tokyo–London, and London–New York overlaps

Stocks / Indices:
• NYSE, LSE, FWB, and TSE sessions
• First-hour-after-open filters

Commodities:
• CME, ICE, London Gold, and New York Gold sessions

Custom:
• Day-by-day schedule with timezone offset, start hour, and end hour

———————————————————————————————————

SUMMARY — WHAT THE PAID VERSION ADDS

Compared with the free version, the paid version provides:

• Full control of every MA used by the indicator: period, shift, method, and applied price
• 35 Method @ Applied Price combinations for every configurable MA (includes VWMA)
• Optional on-chart plotting of every MA in the system, with five master visibility toggles
• Per-MA color and width inputs for all 55 configurable MAs
• 17 configurable validation slots for Early signals
• 17 configurable validation slots for Full signals
• 17 configurable MTF trend-filter MA slots
• Independent Early and Full signal timing
• Optional arrow drawing on intrabar signals (off by default)
• Early and Full signal systems with independent MA configurations
• Optional backtest/diagnostic logging

If the fixed MA library of the free version already meets your needs, the free version may be all you need. If you want to build your own exact MA configuration and control the validation and trend-filter structures — or simply want to support the work — this paid version gives you that flexibility.

———————————————————————————————————

IMPORTANT: This indicator is a technical tool, not financial advice and not a guarantee of profitable results. Test your configuration and understand the settings before using it in live trading.

Please feel free to join this Telegram group where users can share their strategies and settings that work for them using this indicator --> t.me/MTFMACS
Prodotti consigliati
MercariaPattern1-2-3 відстежує рух ціни, знаходить трьоххвильові структури 1-2-3 та підсвічує момент, коли сценарій підтверджується пробоєм ключового рівня. MercariaPattern1-2-3 tracks price movement, detects three-leg 1-2-3 structures and highlights the moment when the scenario is confirmed by a key level breakout. Індикатор збирає локальні свінги в компактну фігуру 0–1–2–3 , чекає підтвердженого пробою та будує стрілку входу з готовими рівнями SL/TP. The indicator combines local swings into a
Seconds Charts
Aleksandr Goryachev
Micro  ******************* Секундные графики MT5 ********************** Более точного инструмента для входа в сделку вы не найдёте. Входные параметры: Timeframe, sek - период построения графика, секунды Displayed bars - отображаемые бары Step of price levels, pp, 0-off - шаг отрисовки ценовых уровней, пункты Scale points per bar, 0-off - масштаб в пунктах на бар Show lines - отображение текущих уровней Show comment - отображение комментария Standard color scheme - стандартная цветовая сх
Overview The Market Perspective Structure Indicator is a comprehensive MetaTrader indicator designed to provide traders with a detailed analysis of market structure across multiple timeframes. It identifies and visualizes key price action elements, including swing highs and lows, Break of Structure (BOS), Change of Character (CHOCH), internal structures, equal highs/lows, premium/discount levels, previous levels from higher timeframes, and trading session zones. With extensive customization opt
Un indicatore pulito per MT5 per il rilevamento della tendenza basato sulla struttura del mercato, con frecce visive di tendenza, marcatori di pivot validi e aree strutturali opzionali. STS Structure Trend Detector è un indicatore pulito per MetaTrader 5, progettato per rilevare la direzione della tendenza del mercato in base alla struttura del prezzo. STS Structure Trend Detector è pensato per i trader che desiderano uno strumento visivo semplice per seguire la struttura attuale del mercato dir
RSI Divergence Risk Target Signals RSI Divergence Risk Target Signals is a MetaTrader 5 indicator that detects confirmed bullish and bearish RSI divergence and combines the signals with optional trend filters, ATR-based Stop Loss levels, three Take Profit targets, alerts and an internal trade statistics dashboard. The indicator compares confirmed RSI pivot structure with corresponding price highs and lows. It is designed to help traders identify momentum divergence while providing a structure
Matreshka
Dimitr Trifonov
5 (2)
Matreshka self-testing and self-optimizing indicator: 1. Is an interpretation of the Elliott Wave Analysis Theory. 2. Based on the principle of the indicator type ZigZag, and the waves are based on the principle of interpretation of the theory of DeMark. 3. Filters waves in length and height. 4. Draws up to six levels of ZigZag at the same time, tracking waves of different orders. 5. Marks Pulsed and Recoil Waves. 6. Draws arrows to open positions 7. Draws three channels. 8. Notes support and re
Gartley Projections D
Oleksandr Medviediev
3 (2)
The indicator identifies the harmonic patterns (XABCD) according to developments of H.M.Gartley ( "Profits in the Stock Market" , 1935г). It projects D-point as a point in the perspective projection (specify ProjectionD_Mode = true in the settings). Does not redraw. When a bar of the working timeframe closes, if the identified pattern point has not moved during Patterns_Fractal_Bars bars, an arrow appears on the chart (in the direction of the expected price movement). From this moment on, the ar
Trade smarter, not harder: Empower your trading with Harmonacci Patterns This is arguably the most complete harmonic price formation auto-recognition indicator you can find for the MetaTrader Platform. It detects 19 different patterns, takes fibonacci projections as seriously as you do, displays the Potential Reversal Zone (PRZ) and finds suitable stop-loss and take-profit levels. [ Installation Guide | Update Guide | Troubleshooting | FAQ | All Products  ] It detects 19 different harmonic pric
IVISTscalp5
Vadym Zhukovskyi
5 (6)
Итальянский [iVISTscalp5]: Un laboratorio per lo studio del comportamento del mercato attraverso il tempo TLV Framework | Liquidity Activation Points ⸻ Descrizione Generale iVISTscalp5 è un indicatore multilivello di timing e struttura dei prezzi sviluppato all’interno del progetto VISTmany. Il sistema prevede il tempo, la direzione e l’ampiezza del movimento attraverso i Liquidity Activation Points (timings). L’indicatore iVISTscalp5 può essere utilizzato con i parametri predefin
The indicator detects and displays М. Gartley's Butterfly pattern. The pattern is plotted by the extreme values of the ZigZag indicator (included in the resources, no need to install). After detecting the pattern, the indicator notifies of that by the pop-up window, a mobile notification and an email. The pattern and wave parameters are displayed on the screenshots. The default parameters are used for demonstration purposes only in order to increase the amount of detected patterns. Parameters z
PZ Swing Trading MT5
PZ TRADING SLU
5 (5)
Protect against whipsaws: revolutionize your swing trading approach Swing Trading is the first indicator designed to detect swings in the direction of the trend and possible reversal swings. It uses the baseline swing trading approach, widely described in trading literature. The indicator studies several price and time vectors to track the aggregate trend direction and detects situations in which the market is oversold or overbought and ready to correct. [ Installation Guide | Update Guide | Tro
Zone Structure Scanner Panel for MT5 Find better setups faster — without scanning charts for hours. The Zone Structure Scanner Panel for MT5 helps you automatically scan multiple symbols, detect key weekly and daily support/resistance zones, read market structure, highlight confluence, and flag H4 rejection-confirmed setups from one powerful panel. Instead of jumping from chart to chart, you get ranked opportunities in one place so you can focus on the setups that matter most. Why it stands
The Expert Advisor and the video are attached in the Discussion tab . The robot applies only one order and strictly follows the signals to evaluate the indicator efficiency. Pan PrizMA CD Phase is an option based on the Pan PrizMA indicator. Details (in Russian). Averaging by a quadric-quartic polynomial increases the smoothness of lines, adds momentum and rhythm. Extrapolation by the sinusoid function near a constant allows adjusting the delay or lead of signals. The value of the phase - wave s
Overview Harmonic Patterns MT5 is a technical analysis indicator designed for the MetaTrader 5 platform. It identifies and displays harmonic price patterns, such as Butterfly, Cypher, Crab, Bat, Shark, and Gartley, in both bullish and bearish directions. The indicator calculates key price levels, including entry, stop loss, and three take-profit levels, to assist traders in analyzing market movements. Visual elements and customizable alerts enhance usability on the chart. Features Detects six ha
L' Indicatore di Decomposizione Stagionale per MQL5 è uno strumento potente progettato per aiutare i trader a identificare e analizzare le tendenze sottostanti e i pattern stagionali all'interno dei dati delle serie temporali finanziarie. Decomponendo i movimenti di prezzo nei loro componenti principali, questo indicatore fornisce un quadro più chiaro delle dinamiche di mercato, consentendo decisioni di trading più informate. Caratteristiche Principali: Linea di Tendenza: Visualizza chiaramente
Harmonic Pattern Scanner — Gartley, Bat, Butterfly, Crab (Auto XABCD Detection) Stop manually plotting Fibonacci retracements on every swing. This indicator scans your chart in real time, identifies X-A-B-C-D structures, and tells you exactly which harmonic pattern is forming — Gartley, Bat, Butterfly, or Crab — with entry, stop loss, and four take-profit targets calculated automatically. What it does Detects confirmed harmonic patterns the moment a D-point swing closes, and previews forming pat
All Harmonics 26
Alexey Isavnin
3.5 (4)
Harmonic patterns are characteristic series of price movements with respect to Fibonacci levels, which statistically precede price reversals. This indicator searches for harmonic patterns. It is capable of recognising 26 classical and non-classical harmonic patterns : Classical Gartley Butterfly Alternate Butterfly Bat Alternate Bat Crab Deep Crab Three Drives Non-classical Shark Alternate Shark Cypher 5-0 Anti Gartley Anti Butterfly Anti Alternate Butterfly Anti Bat Anti Alternate Bat Anti Crab
Automated Trendlines MT5
Georgios Kalomoiropoulos
Le linee di tendenza sono lo strumento più essenziale di analisi tecnica nel forex trading. Sfortunatamente, la maggior parte dei trader non li disegna correttamente. L'indicatore automatizzato delle linee di tendenza è uno strumento professionale per i trader seri che ti aiuta a visualizzare il movimento di tendenza dei mercati. Esistono due tipi di linee di tendenza, linee di tendenza rialziste e linee di tendenza ribassiste. Nella tendenza rialzista, la linea di tendenza Forex viene tracci
Primes Action disegna sul grafico i livelli di massimo e di minimo del giorno, della settimana e del mese precedenti e mostra quando il prezzo li rompe. Ogni timeframe ha un proprio colore, così i tre riferimenti sono facili da distinguere. Come vengono trovati i livelli Il massimo o il minimo esatto di un periodo è spesso solo un'ombra breve. Primes Action considera l'ottavo superiore e l'ottavo inferiore del periodo precedente già chiuso. In ciascuno di essi traccia il livello in cui il prezz
Looking for reliable levels on a price chart? Already tired of searching for similar indicators? Are the levels not working out as they should? Then this is the indicator for you. Volume Prices Universal is a reliable indicator of horizontal volumes. What does it show? First of all, the main idea of ​​the indicator is to display at which price mark the price has been for the longest time. Thus, the display of price volumes on the price chart is formed. With the help of which you can very simpl
Представлен принципиально новый индикатор ZigZag, который отличается от стандартного абсолютной легкостью, быстродействием расчетов и очень высокой точностью. В основе индикатора заложен принцип цикличности рынка с совокупностью анализа количества текущих баров и их основных ценовых уровней. Чем меньше баров для определения расчетов, тем более агрессивная постройка линий индикатора. Как и в  стандартном индикаторе перерисовывается только последняя линия, при изменении достигнутого экстремума. П
TCM Trend Indicator for MetaTrader 5 highlights trend-following setups on closed candles and shows a suggested entry, stop-loss and take-profit for the latest one. What it shows - An arrow under or over the candle when a bullish or bearish trend setup appears, on closed candles only, so arrows do not repaint - Entry, stop-loss and take-profit lines for the latest setup, with the stop based on market volatility - A title and status line showing the current state Risk : reward Choose 1:1, 1:1.5, 1
Win43 Scalper
Eadvisors Software Inc.
O novo s43 Scalper para Mini-Índice (WIN-IND) faz operações de curto prazo no timeframe 1min buscando pequenas variações do mercado, utiliza nova tecnologia de trade, os resultados no intraday são íncríveis, confira:      Após a instalação adicione no gráfico dos instrumentos win para visualizar os resultados no backteste. Recomendamos o timeframe de 1min.
Turtles Professional v2.0 The Legendary Turtle Strategy, Reimagined for the Modern Trader Turtles Pro transforms the iconic 1980s Turtle Trading System into a high-performance, multi-timeframe decision engine. It eliminates guesswork by providing institutional-grade analysis on trend structure, entry quality, and volatility all on a single chart. The Strategic Edge Turtles Professional uses a Smart Weighted Bias Engine to prioritize higher time frames, ensuring your trades align with the d
Native Channels
BeeXXI Corporation
5 (1)
This indicator recognizes all support and resistance levels. A number of unique high-performance techniques have been applied, which made the existence of this indicator possible. All formed channels are naturally visible: horizontal linear linear parabolic cubic (Polynomial 3 degrees - Wave) This is due to a bundle of approximating channels. The formed channels form "standing waves" in a hierarchical sequence. Thus, all support and resistance levels are visible. All parameter management is i
Trend-Based Trading Assistant PRO  is a professional-grade Smart Money Concepts (SMC) and Price Action toolkit designed for MT5. It automates the detection of essential market structure shifts, allowing traders to identify high-probability trend reversals and continuation patterns without manual charting. By combining institutional-level logic with a powerful EMA trend filter, this indicator helps you stay on the right side of the market while avoiding "noise" and false signals. Core Features: A
ATrend
Zaha Feiz
4.63 (19)
"ATREND: Come funziona e come utilizzarlo" ### Come funziona L'indicatore "ATREND" per la piattaforma MT5 è progettato per fornire ai trader robusti segnali di acquisto e vendita utilizzando una combinazione di metodologie di analisi tecnica. Questo indicatore sfrutta principalmente l'Average True Range (ATR) per la misurazione della volatilità, insieme ad algoritmi di individuazione dei trend per identificare potenziali movimenti di mercato. Lascia un messaggio dopo l'acquisto e ricevi un rega
How it works An inducement trap is a sequence, not a candle pattern. TrapRadar's state machine requires all four legs: –   Bait — an obvious level forms (minor swing, equal highs/lows, range boundary) that retail will trade the breakout of. –   Trigger — price breaks the level and actually attracts participation; relative volume rises on the breakout bar, confirming traders took the bait. –   Trap spring — within K bars a displacement candle (range greater than 1.5× ATR, closing 70%+ through its
PZ Support Resistance MT5
PZ TRADING SLU
3.71 (7)
Unlock key market insights with automated support and resistance lines Tired of plotting support and resistance lines? This is a multi-timeframe indicator that detects and plots supports and resistance lines in the chart with the same precision as a human eye would. As price levels are tested over time and its importance increases, the lines become thicker and darker, making price leves easy to glance and evaluate. [ Installation Guide | Update Guide | Troubleshooting | FAQ | All Products  ] Boo
Renko Plus
Eadvisors Software Inc.
With Renko Plus you can use the features in the Indicator functionality, just add it to the Metatrader5 chart.             The Renko chart is a type of chart, developed by the Japanese, that is constructed using price movement rather than standardized prices and time intervals like most charts. It is believed to be named after the Japanese word for bricks, "renga", as the graphic looks like a series of bricks.             A new brick is created when the price moves a specified pri
Gli utenti di questo prodotto hanno anche acquistato
Boba Analysis Suite
Trade Ready Solutions LLC
5 (2)
Boba Analysis Suite Boba Analysis Suite è un indicatore di analisi per MetaTrader 5. Riunisce la struttura del mercato, le zone di prezzo rilevanti e il contesto generale del mercato in un’unica visualizzazione del grafico. Sviluppato sulla base dell’esperienza pratica come trader e formatore di trading, supporta un processo di analisi strutturato: valutare la direzione del mercato, individuare livelli importanti e analizzare congiuntamente più intervalli temporali. Analisi nel contesto del merc
SQN Max indicator for MT5 by ITC
Renaud Herve Francois Candel
Sqn Max Indicator Sqn Max is an exclusive indicator to trade the market with high effectiveness. The indicator is based on price action, volatility and trend. This indicator is as simple as possible but not too simple. The indicator can generate alerts to ease the trading process. You don't have to stay all day in front of your screen. The indicator can be used with any class of assets and with any time frame. It is possible to achieve better results trading our list of selected assets. We achi
ARIPoint
Temirlan Kdyrkhan
1 (4)
ARIPoint is a powerful trading companion designed to generate high-probability entry signals with dynamic TP/SL/DP levels based on volatility. Built-in performance tracking shows win/loss stats, PP1/PP2 hits, and success rates all updated live. Key Features: Buy/Sell signals with adaptive volatility bands Real-time TP/SL/DP levels based on ATR Built-in MA Filter with optional ATR/StdDev volatility Performance stats panel (Success, Profit/Loss, PP1/PP2) Alerts via popup, sound, push, or email Cu
Zain Gold Scalping
Ahmed Gamal Abdel Nasser Mohamed
Uno strumento completo di analisi della price action basato su una doppia logica di ingresso indipendente – ciascuna confermata da una banda di volatilità – e integrato da un set configurabile di nove filtri di conferma opzionali, che consentono di modulare con precisione il comportamento dei segnali, rendendoli più conservativi o più aggressivi. Strategia Fondamentale Due configurazioni di ingresso indipendenti, ciascuna delle quali si attiva solo quando il prezzo esce da una banda di volatil
VTrende Pro
Andrii Diachenko
5 (1)
VTrende Pro - MTF indicator for trend trading with a display panel for MT5 *** Videos can be translated into any language using subtitles (video language - Russian) Although the signals of the VTrende Pro indicator can be used as signals of a full-fledged trading system, it is recommended to use them in conjunction with the Bill Williams TS. VTrende Pro is an extended version of the VTrende indicator. Difference between Pro version and VTrende: - Time zones - Signal V - signal 1-2 waves -    S
QNC Scalper
Yordiana Enggelina Seko
Here is a professional and engaging description for the Indikator QNC Scalper tool in English, tailored for traders and platforms: Indikator QNC Scalper Unlock precision trading in fast-paced markets with the Indikator QNC Scalper —an advanced technical analysis tool engineered specifically for scalpers and day traders. Whether you are trading forex, crypto, or indices, this indicator cuts through market noise to deliver clear, high-probability entry and exit signals. Key Features Real-Time M
TrendMaestro5
Stefano Frisetti
Attenzione alle truffe, questo indicatore e' distribuito esclusivamente su MQL5.com nota: questo indicatore e' per METATRADER5, se vuoi la versione per  METATRADER4 questo e' il link:   https://www.mql5.com/it/market/product/108106 TRENDMAESTRO ver 2.5 TRENDMAESTRO   riconosce un nuovo TREND sul nascere, non sbaglia mai. La sicurezza di identificare un nuovo TREND non ha prezzo. DESCRIZIONE TRENDMAESTRO identifica un nuovo TREND sul nascere, questo indicatore prende in esame la volatilita' i
OmniSync Projection
Antonio-alin Teculescu
5 (1)
Chronos Fractal Engine is an innovative price projection indicator for MetaTrader 5, designed to transform your technical analysis by intelligently identifying and projecting historical price patterns. Built upon an advanced correlation algorithm and the fractal principles of the market, this powerful tool visualizes potential future price movements, giving you a unique edge in your trading decisions. What is Chronos Fractal Engine? At its core, the Chronos Fractal Engine employs a sophisticat
Title:FX-AIEA Supply and Demand Zone Indicator (MT5) — Technical Overview Version: 2.51 | Platform: MetaTrader 5 Introduction Supply and demand zones are considered a core manifestation of institutional order flow, providing a more direct reflection of buying and selling pressure than traditional support/resistance levels. This indicator attempts to automate the identification of high-probability supply and demand zones using an adaptive ZigZag algorithm, reducing the subjectivity and time asso
Zain Gold ScalpingV5
Ahmed Gamal Abdel Nasser Mohamed
Zain Gold Scalping V5 is a technical analysis indicator for MetaTrader 5 designed for Forex and Gold markets. It provides chart-based market information, trend analysis, signal conditions, and an on-screen dashboard to help traders analyze price movement across multiple timeframes. Main Features The indicator supports multiple timeframes, including M1, M5, M15, M30, H1 and higher timeframes. It can be used with Gold (XAUUSD), Forex currency pairs, indices and other supported instruments. The in
The indicator is designed to close positions on the market in time. For example: to take profits ahead of schedule if the price has not reached TakeProfit, and the market is turning around. The indicator analyzes the momentum, not the trend. He does not give any information about the trend. The indicator is well suited for finding divergence. The Ershov 38 Parrots indicator dynamically adjusts to the market and detects price movement impulses of medium and high amplitude. It almost does not rea
AriX
Temirlan Kdyrkhan
1 (4)
AriX Indicator for MT5 A powerful trend-following and signal-evaluation tool AriX is a custom MT5 indicator that combines Moving Averages and ATR-based risk/reward logic to generate clear buy/sell signals. It visualizes dynamic SL/TP levels, evaluates past trade outcomes, and displays win/loss statistics in a clean on-chart panel. Key features include: Buy/Sell signals based on MA crossovers ATR-based SL/TP1/TP2/TP3 levels with visual lines and labels Signal outcome tracking with real-time stat
Meravith Scanner
Ivan Stefanov
5 (3)
MERAVITH SCANNER è un indicatore professionale per i mercati finanziari su MetaTrader 5, che integra più strumenti di analisi in un unico sistema. Esegue tutti i calcoli automaticamente utilizzando una metodologia proprietaria basata sul prezzo medio ponderato per il volume (VWAP), eliminando completamente l’interpretazione soggettiva. L’indicatore funziona su tutte le classi di asset (Forex, Azioni, Indici, Commodities, Criptovalute) e su tutti i timeframe, da M1 a Mensile. Il principio fondame
In poche parole Questo indicatore combina due esperti — l'RSI e il MACD — in un unico sistema. Invece di guardare due grafici separati e fare ipotesi, prende la decisione per te: quando entrambi gli indicatori sono d'accordo, disegna una freccia (acquisto o vendita). La cosa più importante: le frecce non vengono ridipinte . Una volta apparse, rimangono dove sono. Puoi fare backtest e operare in tempo reale con piena fiducia. Cosa significa "Combo" Normalmente, un trader guarda l'RSI (che misura
Meravith MT5
Ivan Stefanov
5 (3)
MERAVITH è un indicatore multi-timeframe di volume e liquidità per MetaTrader 5 che mostra il trend, le zone di supporto e resistenza, l'ingresso, gli obiettivi e lo stop loss su ogni timeframe. Ti dà una mappa completa della liquidità del mercato, uno strumento di liquidità in stile hedge fund, e fa ogni calcolo automaticamente con un metodo proprietario di prezzo medio ponderato per il volume, così non c'è interpretazione soggettiva. Funziona su Forex, oro (XAUUSD), indici e cripto, su ogni ti
Cycles Plotter
Edoardo Centorame
Cycles Plotter Indicatore di Cicli Personalizzabili con Medie Mobili e Data di Inizio Il Cycles Plotter è un indicatore tecnico avanzato che traccia due cicli sinusoidali completamente personalizzabili, solo dietro input dell’utente. Non genera cicli automaticamente: tutti i cicli vengono calcolati esclusivamente in base ai parametri impostati dall’utente, offrendo ai trader uno strumento visivo per studiare le oscillazioni di prezzo e i potenziali cambi di tendenza, senza produrre segnali o pre
Volume Arrow Signal Product Description Volume Arrow Signal is a smart trading indicator designed to help traders identify potential buy and sell opportunities using price action, volume behavior, and directional arrow signals. The indicator places clear arrows directly on the chart, making it easy to spot possible market reversals, trend continuations, and entry opportunities without spending hours analyzing charts manually. Whether you are trading Gold (XAUUSD) , Forex pairs, Indices, or Crypt
MasterTrend
Temirlan Kdyrkhan
MasterTrend Indicator for MT5 A powerful trend-following and signal-evaluation tool MasterTrend   is a custom MT5 indicator that combines Moving Averages and ATR-based risk/reward logic to generate clear buy/sell signals. It visualizes dynamic SL/TP levels, evaluates past trade outcomes, and displays win/loss statistics in a clean on-chart panel. Key features include: Buy/Sell signals based on MA crossovers ATR-based SL/TP1/TP2/TP3 levels with visual lines and labels Signal outcome tracking wit
SMC Sweep Fvg MT5
Daniil Sleptsov
5 (1)
SMC Sweep Fvg MT5 — guarda il mercato come lo smart money, direttamente sul tuo grafico Conosci quella sensazione: il prezzo ti prende lo stop, gira e va esattamente dove ti aspettavi. Avevi ragione sulla direzione. Hai sbagliato solo l’ingresso. Questo indicatore esiste perché succeda meno spesso. Si occupa della parte più pesante dell’analisi — la marcatura del grafico — e lascia a te ciò che conta: la decisione. Cosa vedi sul grafico Struttura di mercato — massimi e minimi strutturali rea
Gold Xausd Hunter
Metin Erkamoglu
5 (2)
MATADOR GOLD XAUUSD M5 Scalp Signals for MT5 MATADOR GOLD is a decision-support indicator for MetaTrader 5, designed for traders who analyze short-term Gold movement on the M5 timeframe. The indicator does not open, close, or manage trades automatically. It provides buy and sell signal guidance so the user can make their own trading decisions according to their risk plan, broker conditions, and trade management rules. Main purpose MATADOR GOLD is built to help traders avoid noisy signal flow and
KenKem Master Volume Profiler - Brief Introduction A Display-only volume-profile cockpit for XAUUSD, BTCUSD and other liquid symbols. Draws profile structure, multi-timeframe flow, EMA trend and study-only setup markers. Places no orders. Not a signal service.  It maps where the market has actually traded and reads recent order flow, so you can see structure and lean at a glance.  What it shows: Master and local volume profiles (POC and value-area high/low) - the price shelves that matter. A liv
Классификатор силы тренда. Показания на истории не меняет. Изменяется классификация только незакрытого бара. По идее подобен полной системе ASCTrend, сигнальный модуль которой, точнее его аппроксимация в несколько "урезанном" виде, есть в свободном доступе, а также в терминале как сигнальный индикатор SilverTrend . Точной копией системы ASCTrend не является. Работает на всех инструментах и всех временных диапазонах. Индикатор использует несколько некоррелируемых между собой алгоритмов для класси
FFx Universal Strength Meter PRO is more than a basic strength meter. Instead of limiting the calculation to price, it can be based on any of the 19 integrated strength modes + 9 timeframes. With the FFx USM, you are able to define any period for any combination of timeframes. For example, you can set the dashboard for the last 10 candles for M15-H1-H4… Full flexibility! Very easy to interpret... It gives a great idea about which currency is weak and which is strong, so you can find the best pai
The FFx Universal MTF alerter shows on a single chart all the timeframes (M1 to Monthly) with their own status for the chosen indicator. 9 indicators mode (MACD-RSI-Stochastic-MA-ADX-Ichimoku-Candles-CCI-PSAR). Each can be applied multiple times on the same chart with different settings. Very easy to interpret. Confirm your BUY entries when most of the timeframes are showing green color. And confirm your SELL entries when most of the timeframes are showing red color. 2 Alert Options : input to s
The FFx Watcher PRO is a dashboard displaying on a single chart the current direction of up to 15 standard indicators and up to 21 timeframes. It has 2 different modes: Watcher mode: Multi Indicators User is able to select up to 15 indicators to be displayed User is able to select up to 21 timeframes to be displayed Watcher mode: Multi Pairs User is able to select any number of pairs/symbols User is able to select up to 21 timeframes to be displayed This mode uses one of the standard indicators
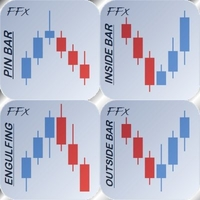
FFx Patterns Alerter gives trade suggestions with Entry, Target 1, Target 2 and StopLoss .... for any of the selected patterns (PinBar, Engulfing, InsideBar, OutsideBar) Below are the different options available: Multiple instances can be applied on the same chart to monitor different patterns Entry suggestion - pips to be added over the break for the entry 3 different options to calculate the SL - by pips, by ATR multiplier or at the pattern High/Low 3 different options to calculate the 2 TPs -
MetaTrader 4 version available here : https://www.mql5.com/en/market/product/24881 FFx Basket Scanner is a global tool scanning all pairs and all timeframes over up to five indicators among the 16 available. You will clearly see which currencies to avoid trading and which ones to focus on. Once a currency goes into an extreme zone (e.g. 20/80%), you can trade the whole basket with great confidence. Another way to use it is to look at two currencies (weak vs strong) to find the best single pairs
MetaTrader 4 version available here: https://www.mql5.com/en/market/product/25793 FFx Pivot SR Suite PRO is a complete suite for support and resistance levels. Support and Resistance are the most used levels in all kinds of trading. Can be used to find reversal trend, to set targets and stop, etc. The indicator is fully flexible directly from the chart 4 periods to choose for the calculation: 4Hours, Daily, Weekly and Monthly 4 formulas to choose for the calculation: Classic, Camarilla, Fibonac
Il livello Premium è un indicatore unico con una precisione superiore all'80% delle previsioni corrette! Questo indicatore è stato testato dai migliori Specialisti di Trading per più di due mesi! L'indicatore dell'autore che non troverai da nessun'altra parte! Dagli screenshot puoi vedere di persona la precisione di questo strumento! 1 è ottimo per il trading di opzioni binarie con un tempo di scadenza di 1 candela. 2 funziona su tutte le coppie di valute, azioni, materie prime, criptovalu
ClassicSBA
Umri Azkia Zulkarnaen
this indicator very simple and easy if you understand and agree with setup and rule basic teknical sba you can cek in link : please cek my youtube channel for detail chanel : an for detail info  contact me  basicly setup buy (long) for this indicator is Magenta- blue and green candle or magenta - green  and green candlestik and for setup sell (short) is Black - yellow - and red candle or black - red  and red candlestik
Altri dall’autore
Please feel free to join this Telegram group where users can share their strategies and settings that work for them using this indicator --> t.me/MTFMACS ALSO AVAILABLE ON TRADINGVIEW The MTFMACS family is now available on TradingView for users who prefer charting on that platform. Contact me via the Telegram group for direct access. ABOUT THIS FREE VERSION Th
FREE
Please feel free to join this Telegram group where users can share their strategies and settings that work for them using this Expert Advisor --> t.me/MTFMACS ALSO AVAILABLE ON TRADINGVIEW The signal engine of this EA is available on TradingView as a backtesting and study tool. The TradingView version runs the same crossover, validation, and MTF filter logic and includes all 35 MA method/price combinations (including VWMA). Use it to evaluate your configuration against historical data, then re
Filtro:
Nessuna recensione
Rispondi alla recensione