Nova Hourly Map PRO
- ユーティリティ
- バージョン: 2.0

Nova Hourly Map PRO
Discover when your market has historically been most active.
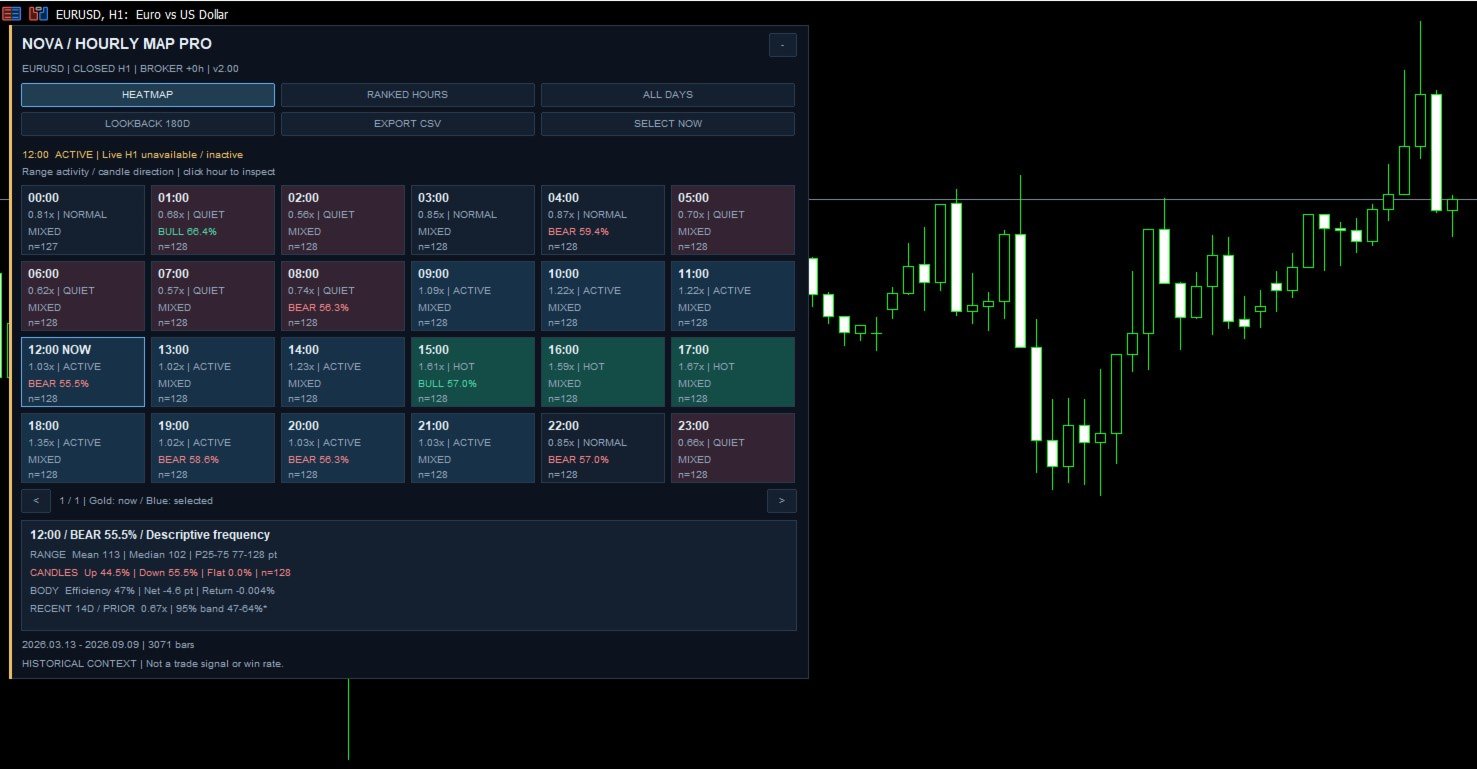
Nova Hourly Map PRO turns completed H1 candles into an interactive 24-hour dashboard, helping you compare volatility, directional tendencies and typical hourly ranges before planning your trading session.
Attach it to any chart timeframe. The indicator automatically analyses H1 history for that symbol.
Key features
-
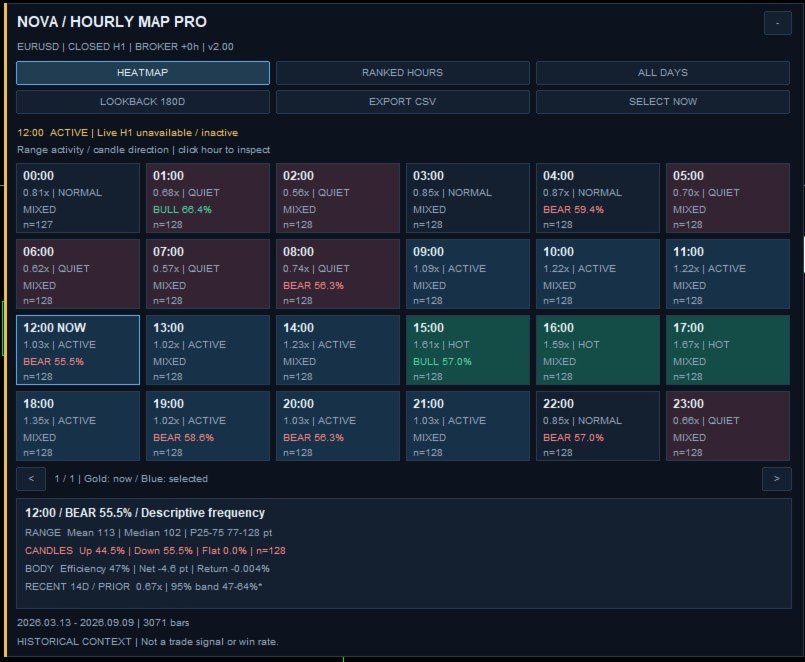
Colour-coded hourly volatility map.
-
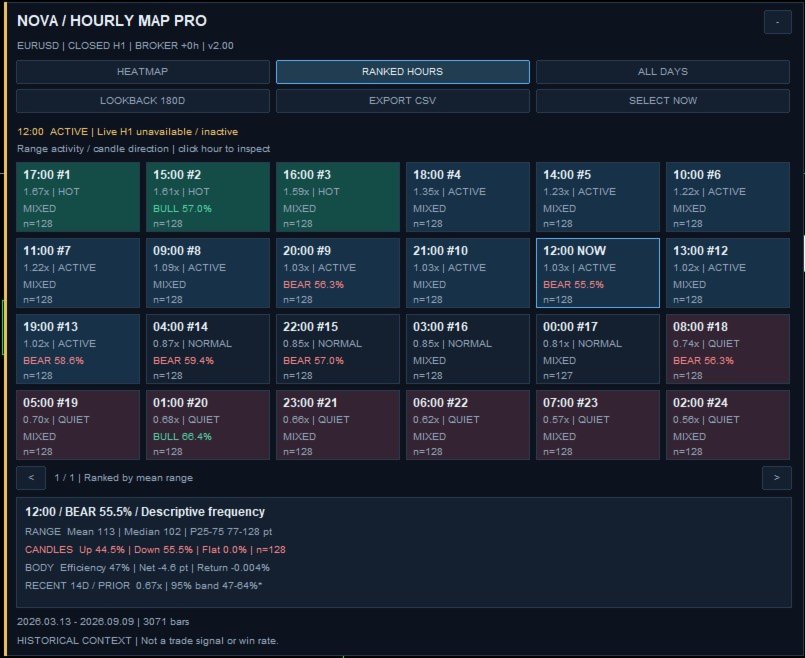
Ranked hours to identify historically active periods.
-
Bullish, bearish and flat-candle percentages.
-
Median ranges and typical range bands.
-
Weekday filters and adjustable historical lookback.
-
Sample-quality checks to flag limited data.
-
Current H1 range comparison and CSV export.
-
Optional alerts for historically high-activity hours.
How to use
-
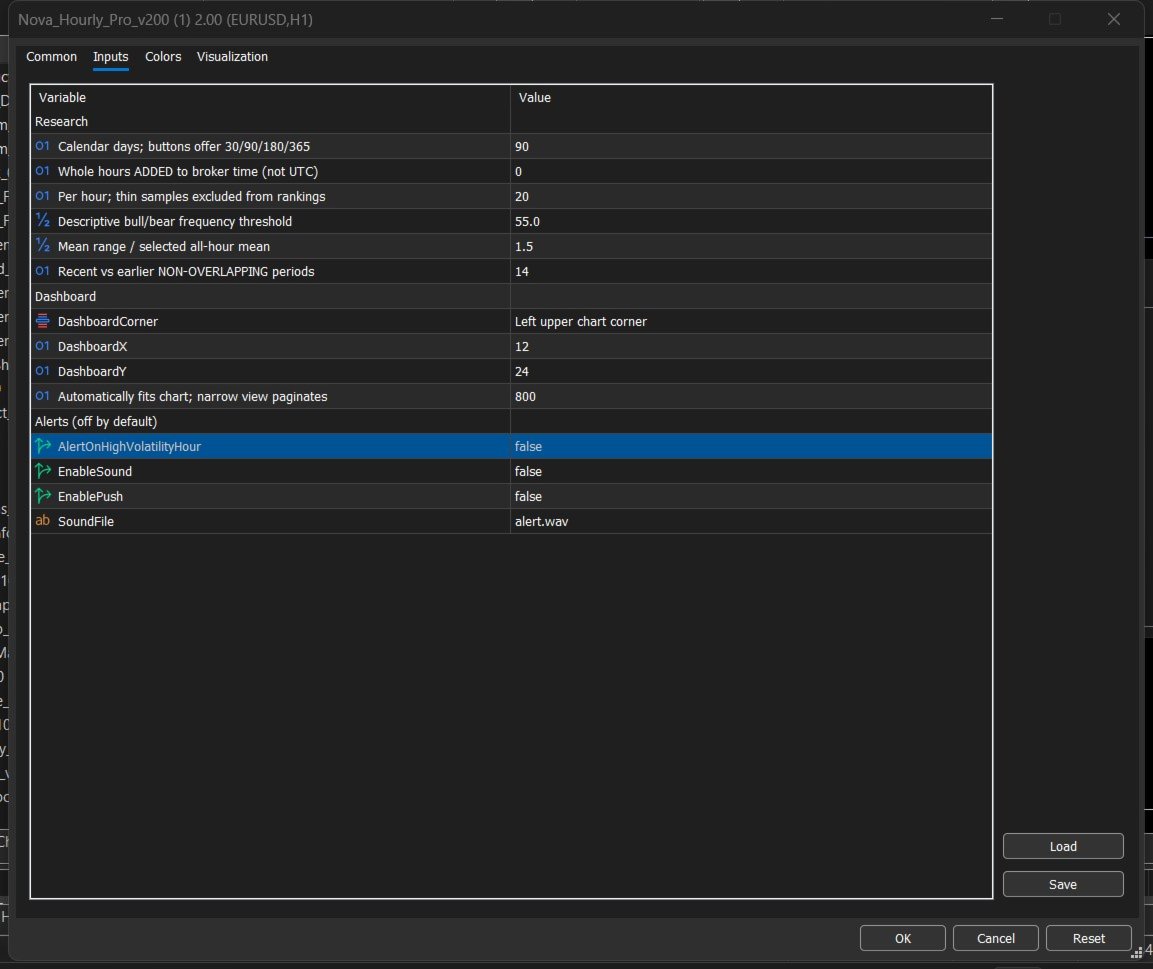
Attach the indicator and start with the default 90-day lookback.
-
Keep TimeZoneOffset at 0 to use your broker’s clock, or adjust it to your preferred time.
-
Select HEATMAP for the daily overview or RANKED HOURS to compare activity.
-
Click an hour to inspect its range, direction percentages and sample count.
-
Use the weekday button to study a particular day. Choose 180 or 365 days if too few samples are available.
A reading of 1.50x means that hour’s average historical range was 50% larger than the overall average for your selected data. LOW SAMPLE means there is insufficient data to qualify that hour for rankings.
Use the map to plan when to watch for setups, alongside your price-action analysis. Direction percentages describe historical candles—not trade win rates. The indicator does not execute trades or guarantee future results.
Standalone MT5 indicator. No external indicators or DLLs required.
Kito Market Systems