Kito Level Reactor
- インディケータ
- バージョン: 1.0
- アクティベーション: 10

Kito Level Reactor
SPECIAL OFFER: After purchasing this product, send me a private message to claim your bonus indicator FREE.
A dual-axis structural level indicator for active control, range memory and open price paths.
Kito Level Reactor is a structural price-level indicator for MetaTrader 5.
It is designed for traders who want to understand not only where an important level is located, but how that level is currently influencing price.
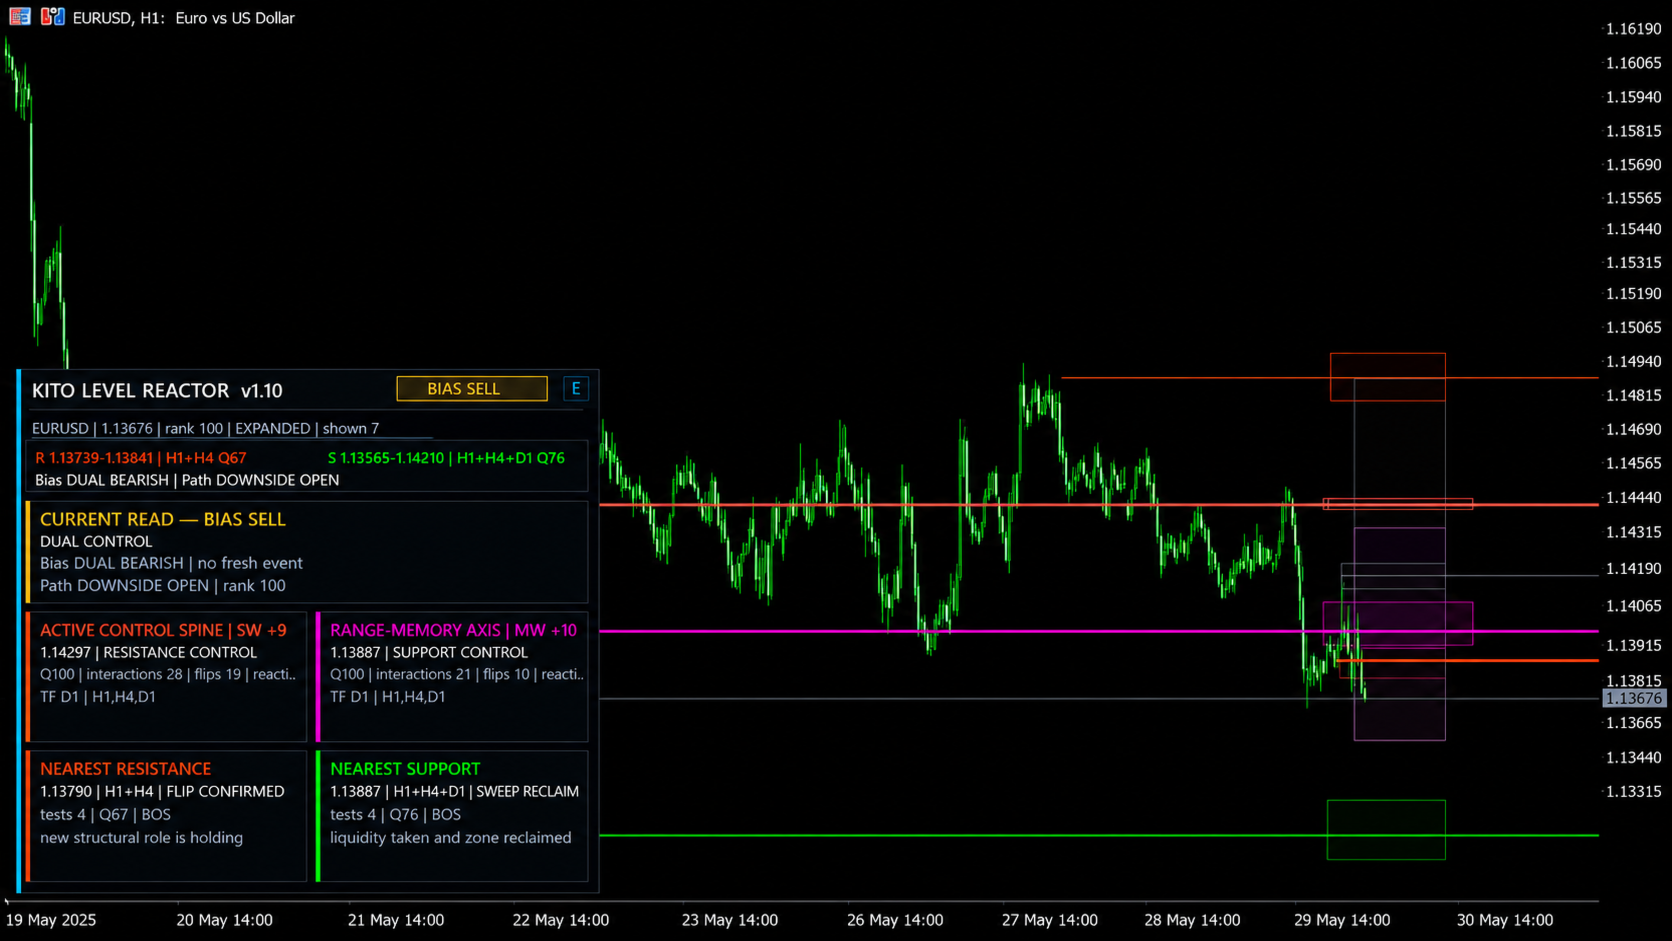
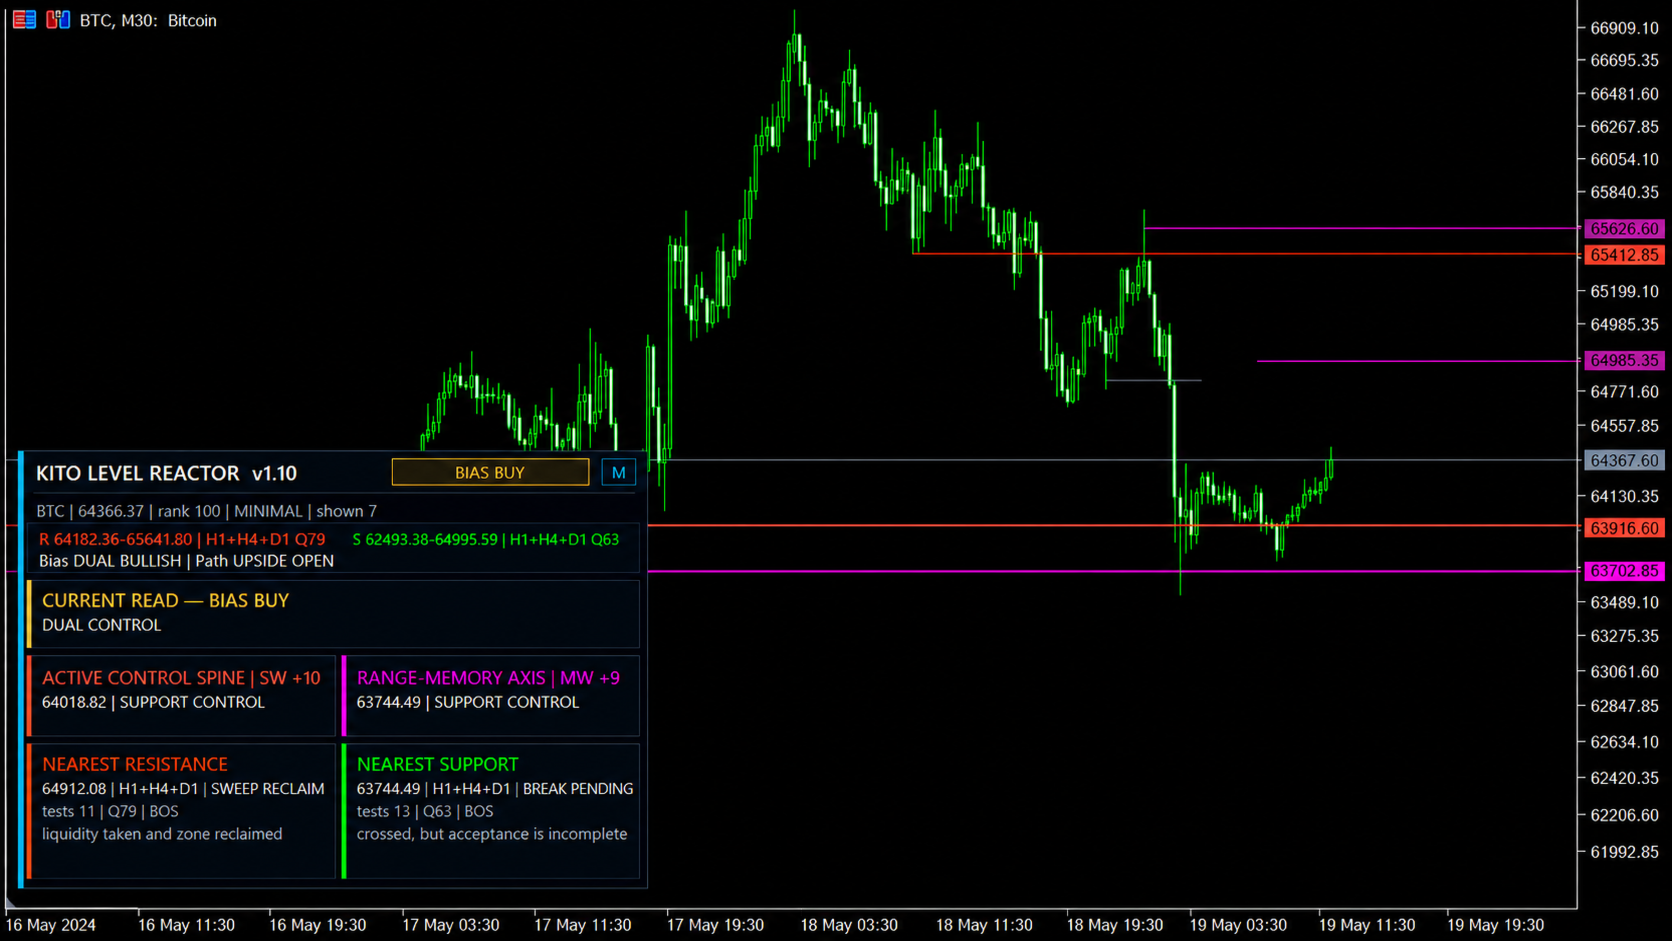
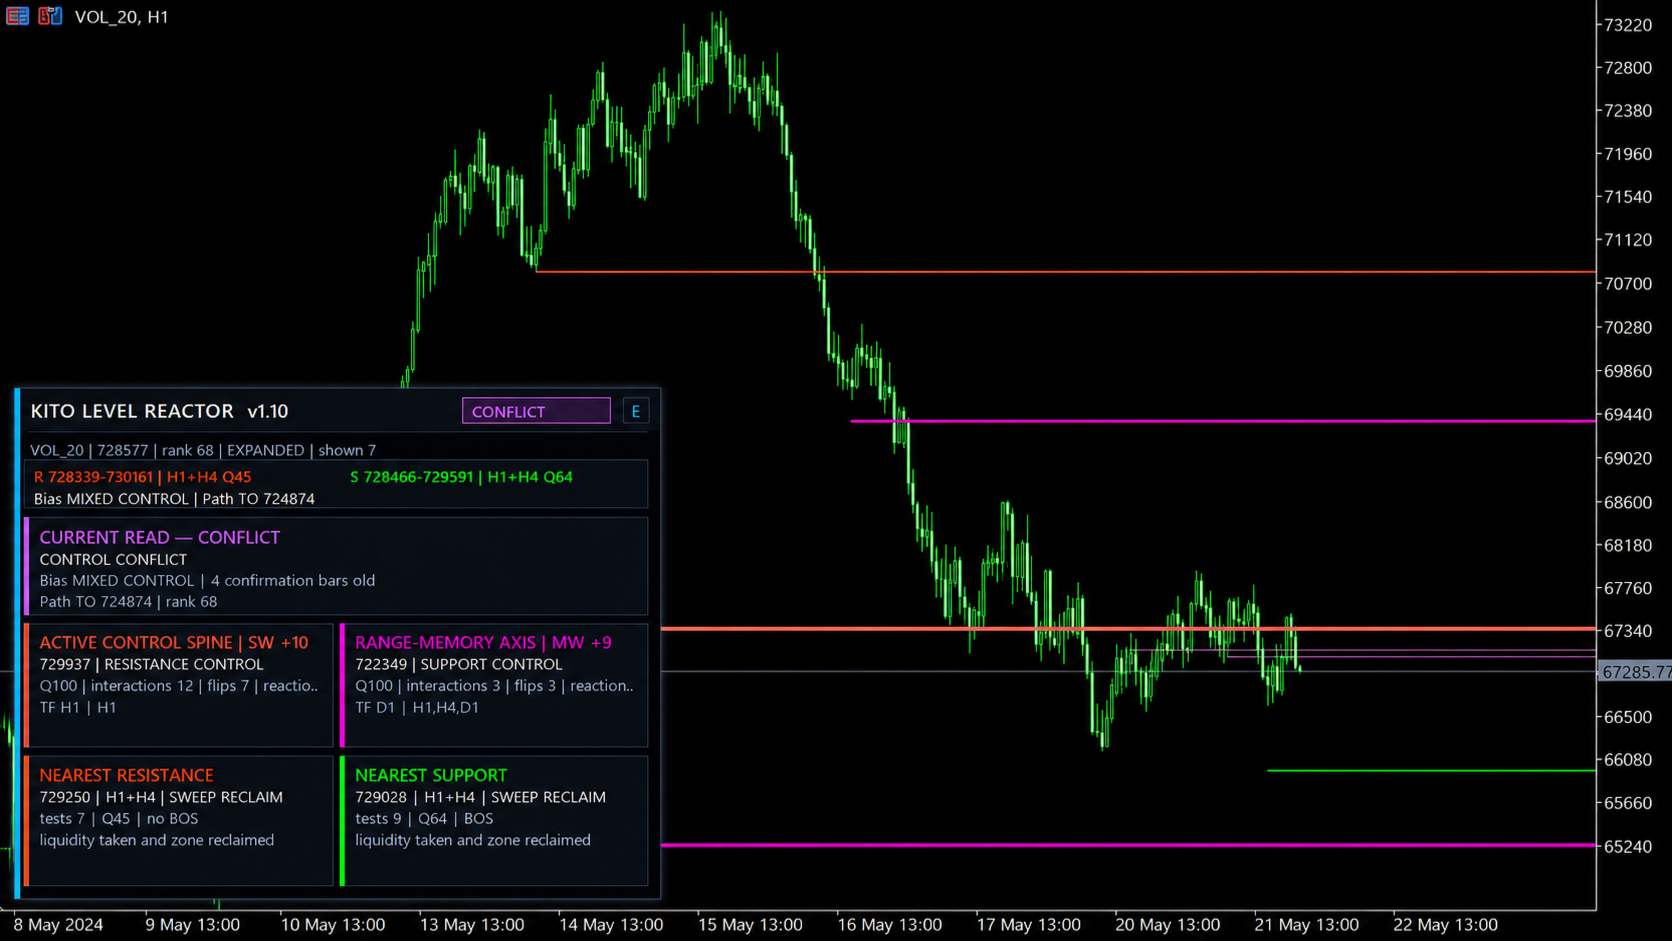
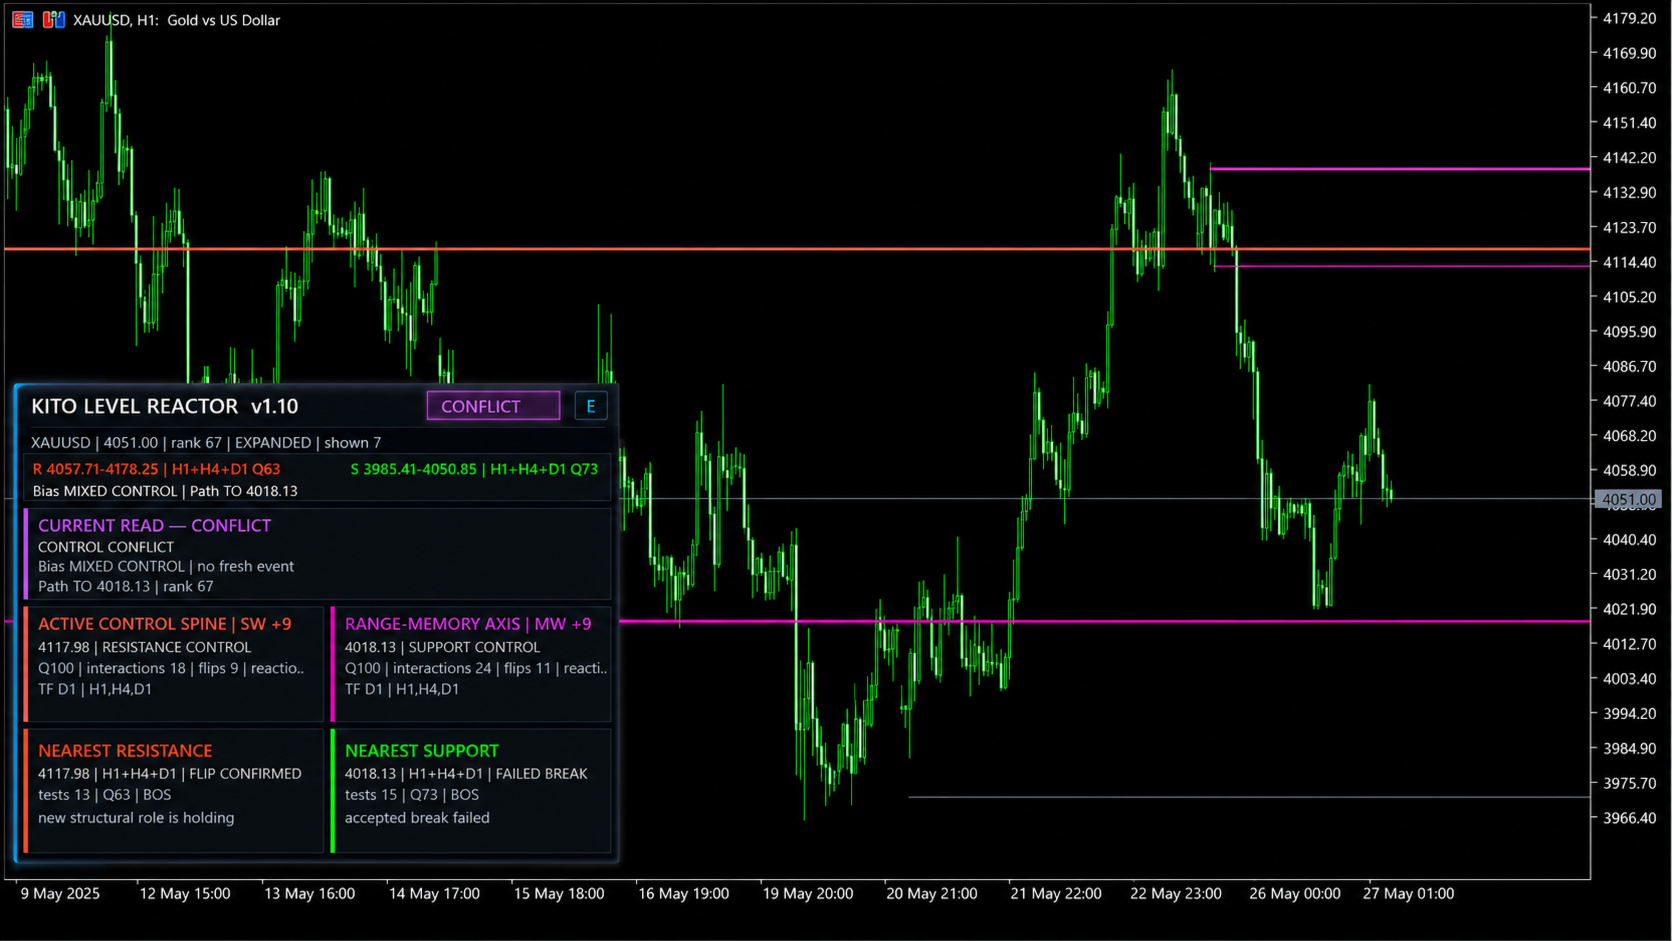
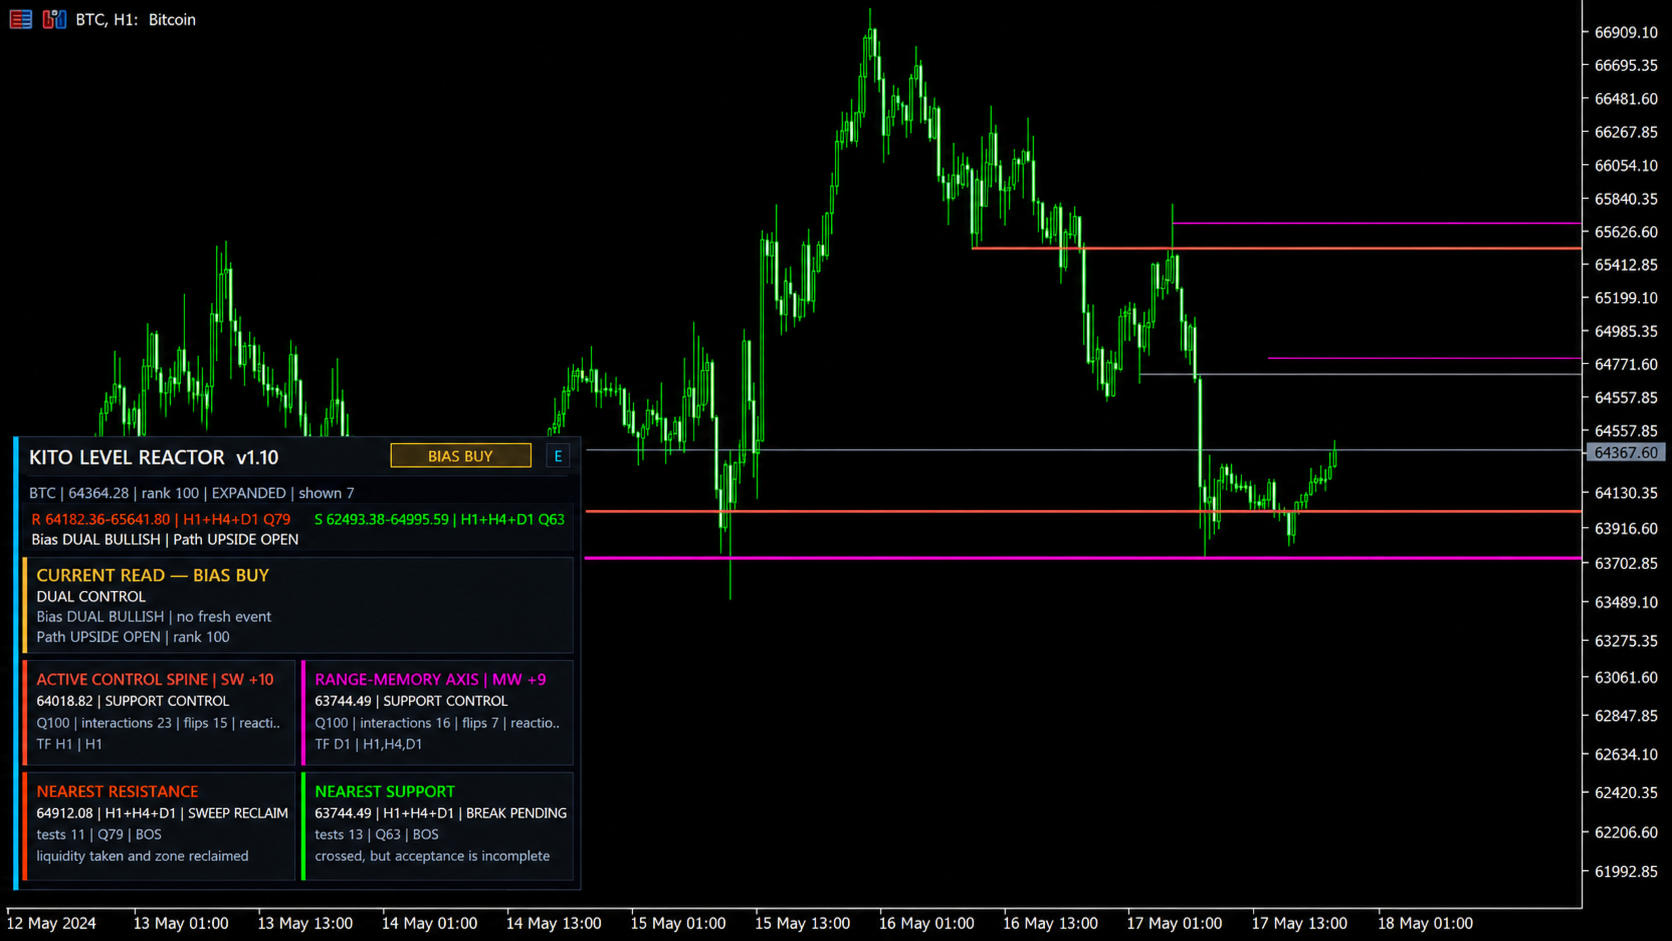
The indicator separates market control into two distinct forms. Active Control Spine This is the nearby level where control is changing hands most actively.
It is intended to provide context for current bias, reclaims, breakdowns, failed breaks and first retests.
Range-Memory Axis This is the historically consequential divider that has repeatedly separated major bullish and bearish phases.
It is intended to provide context for larger reversals, range transitions, failed breakouts and higher-timeframe targets.
When both axes point in the same direction, the dashboard reports dual control. When they disagree, the indicator reports a control conflict so the trader can reduce confidence and wait for clearer structure.
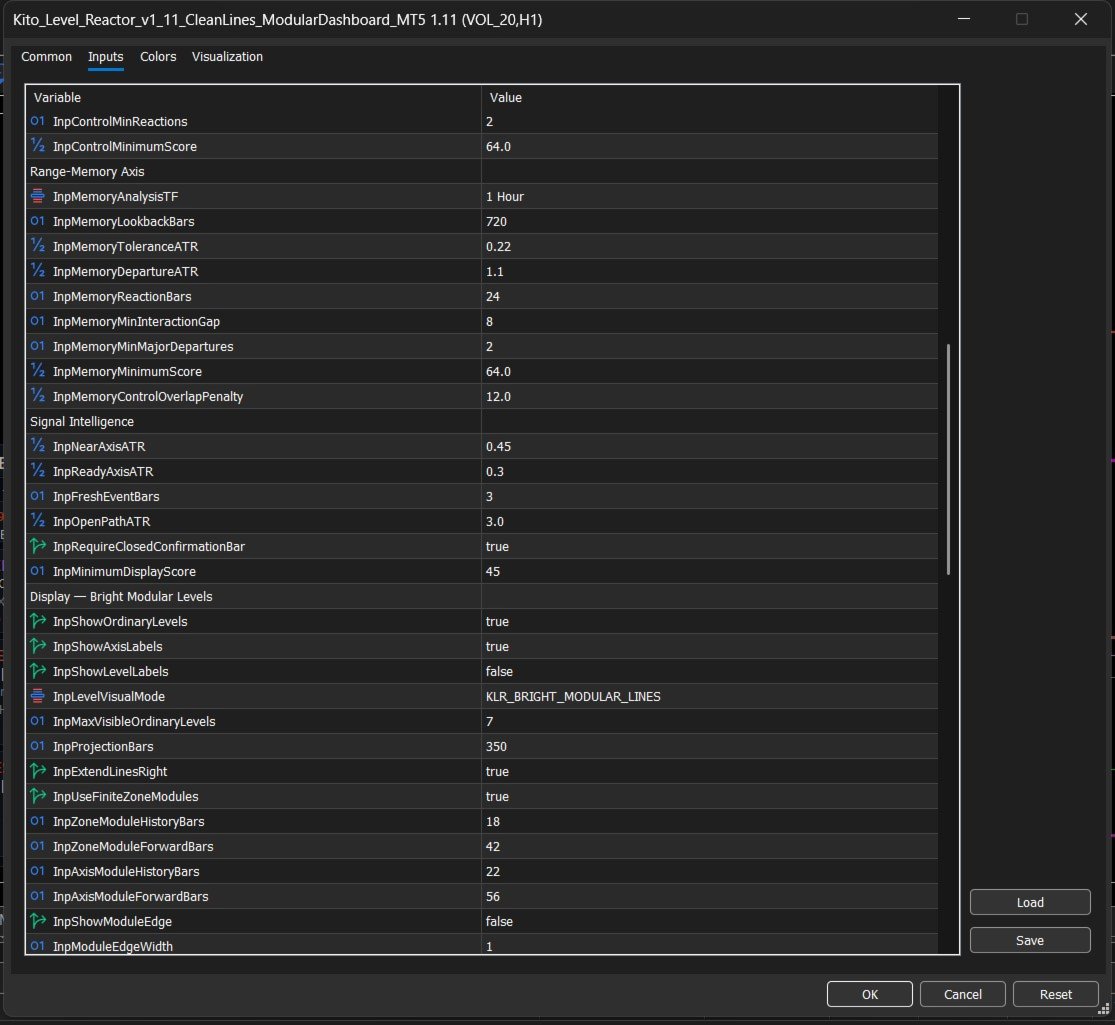
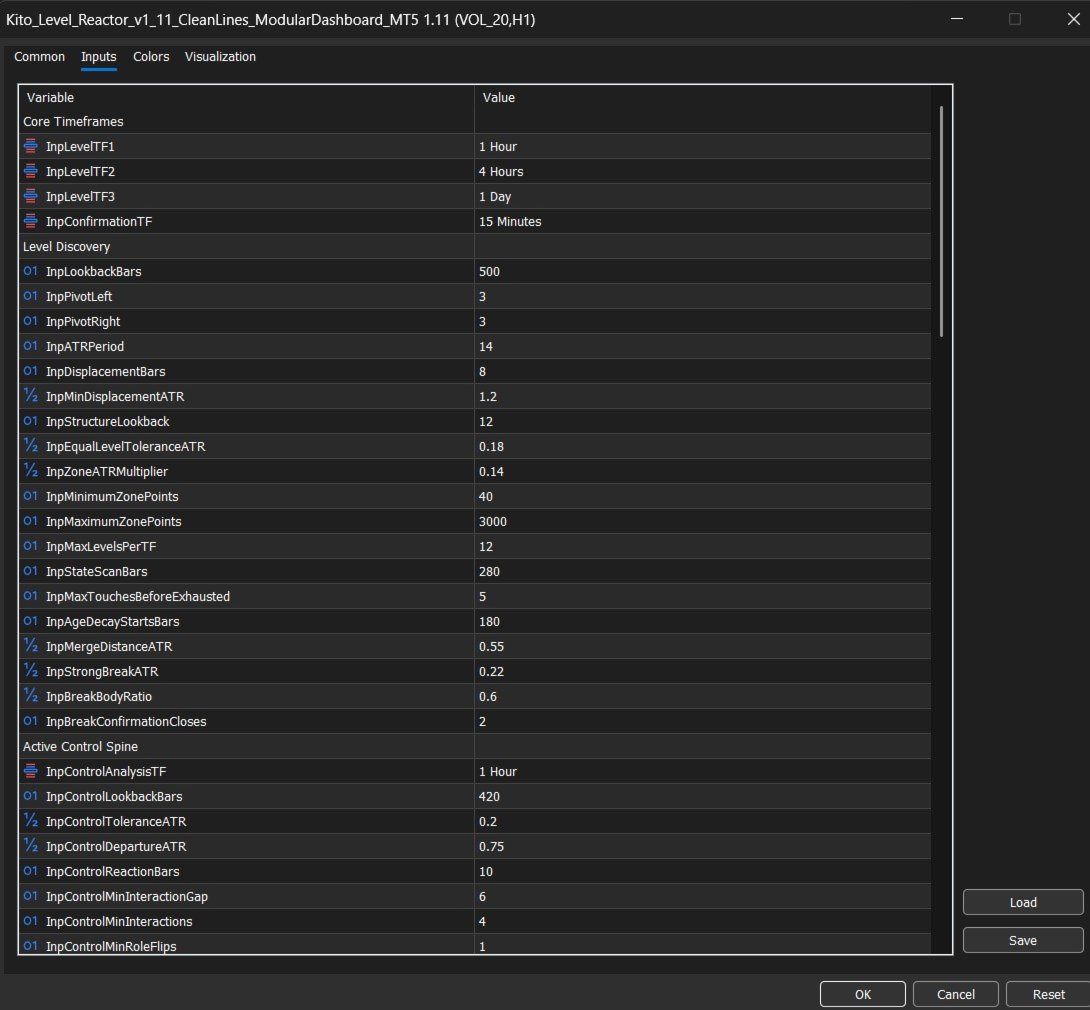
Main features - Multi-timeframe structural level discovery using H1, H4 and D1 by default
- M15 confirmation layer by default
- Active Control Spine with an independent quality score
- Range-Memory Axis with an independent structural score
- Nearest resistance and nearest support mapping
- Open-path analysis beyond the current control level
- Lifecycle states including Fresh, Tested, Weakened, Sweep Reclaim, Break Pending, Flip Armed, Flip Confirmed, Failed Break and Exhausted
- Clean bright chart lines with optional compact zone display
- Bottom-left modular dashboard
- Minimal, Compact and Expanded dashboard modes
- Popup, push and email alert options
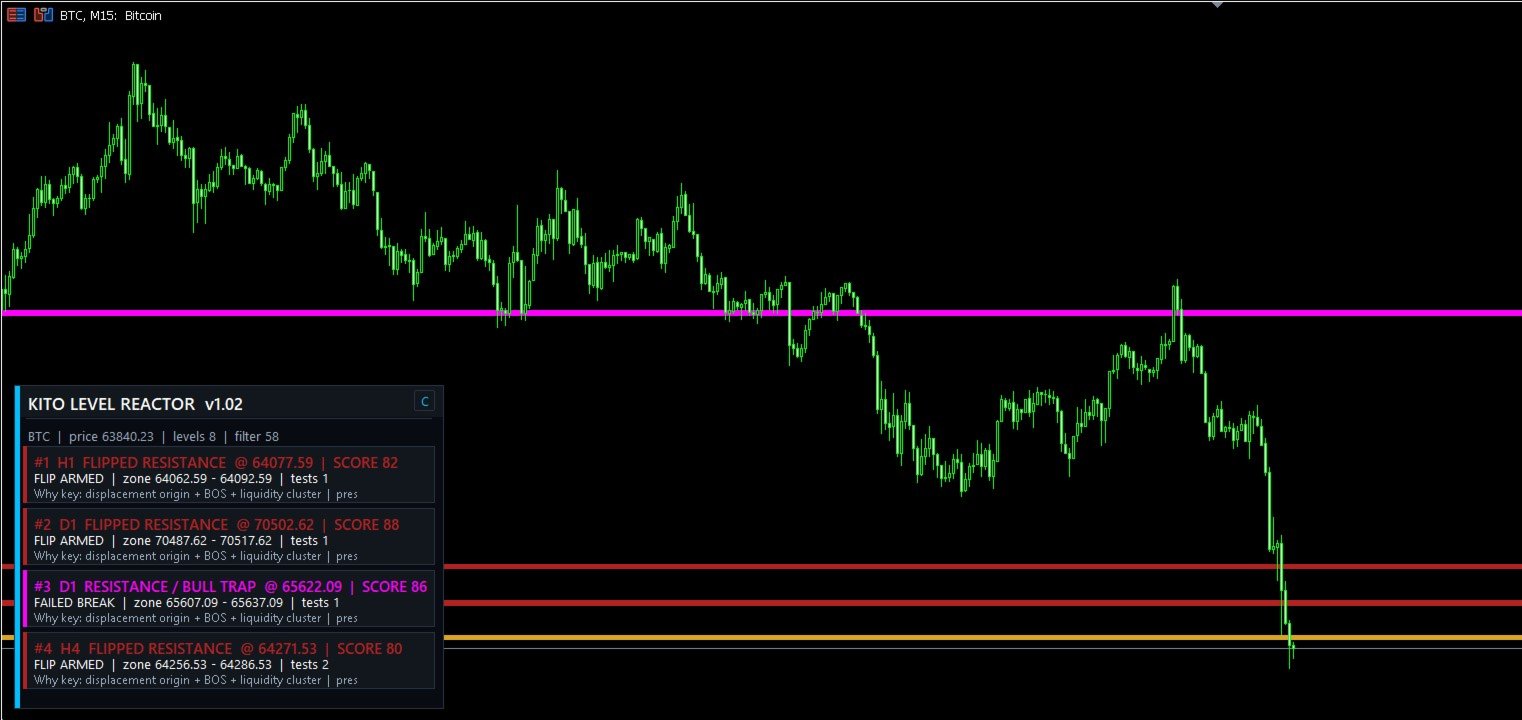
- Suitable for forex, metals, indices and cryptocurrency symbols when sufficient broker history is available How to read the dashboard Bias shows the current directional interpretation of the two control axes.
Active Control Spine shows the immediate control level, its role, quality score and interaction history. Range-Memory Axis shows the higher-order structural divider, its role, quality score and historical consequence.
Nearest Resistance and Nearest Support show the closest qualified structural levels around current price. Path describes whether price has a nearby structural target or a comparatively open route in the active direction.
Suggested workflow
1. Start with the dashboard bias and check whether the two axes agree or conflict.
2. Observe price as it approaches the Active Control Spine or Range-Memory Axis.
3. Wait for a confirmed reclaim, rejection, breakdown, sweep reclaim or flip state.
4. Use the nearest opposite level or the open-path reading to plan targets.
5. Apply your own entry method, stop placement and risk management rules.
Display modes Bright Modular Lines is the clean default view.
Lines With Soft Zone adds a compact shaded zone around each selected level.
Full Zone Bands provides a stronger zone display for traders who prefer wider visual structure.
Important information Kito Level Reactor is an analytical indicator. It does not open, modify or close trades. It does not guarantee future market direction or trading results. Levels and rankings can update as new closed bars create new market structure. Always test the indicator on your broker's symbols and use independent risk management.