Quantile AMD Price Predictor Pro
- インディケータ
- バージョン: 2.0
- アクティベーション: 12

Professional Overview: Quantile Predictor + AMD Orderflow Combined Indicator
---
Executive Summary
The Quantile Predictor + AMD Orderflow Combined Indicator represents a sophisticated fusion of two distinct trading methodologies into a single, cohesive analytical tool for MetaTrader 5. This indicator merges statistical price prediction with institutional order-flow analysis, creating a comprehensive trading framework that allows traders to cross-reference two independent perspectives before entering positions.
Built originally as two separate indicator sets, this unified implementation addresses the critical challenge of conflicting signals by presenting both analyses simultaneously on a single chart. The combination is particularly valuable because it enables traders to validate statistical price projections against institutional session structure, significantly improving decision-making confidence.
---
Part A: Quantile Price Predictor Engine
Core Philosophy
The Quantile Price Predictor engine applies advanced statistical and machine learning techniques to analyze price behavior. Rather than relying on traditional lagging indicators, it uses quantile regression to identify probable price paths, Kalman filtering for trend detection with minimal lag, and reversal probability zones based on historical pivot analysis.
Component A1: Trend Nova - Trend Filter
Technical Foundation
The 2-pole trend filter is a second-order low-pass filter applied to price data, producing a smooth trend line with significantly less lag than traditional moving averages. The filter parameters including length and damping are user-configurable, allowing adaptation to different market conditions.
Color-Coded Trend Identification
The filter displays as lime during uptrends, red during downtrends, and yellow during neutral or consolidating conditions. This immediate visual feedback helps traders quickly assess the current trend bias. When price is above the filter and the line is rising, traders should favor long positions; when below and falling, favor shorts.
Component A2: Kalman Trend Levels
Technical Foundation
Kalman filters are optimal recursive estimators that combine noisy measurements with previous estimates to produce smoother, more accurate trend signals. The implementation uses two Kalman filters operating simultaneously. The short Kalman, defaulting to 40 bars, provides faster response to price changes, while the long Kalman, defaulting to 80 bars, delivers smoother and more stable trend measurement.
Signal Generation
When the short Kalman crosses above the long Kalman, it generates a buy signal represented by a green arrow displayed below price. When it crosses below, a sell signal appears as a red arrow above price. Unlike traditional moving average crossovers, Kalman filters automatically adjust their responsiveness based on price volatility and measurement noise, resulting in fewer whipsaws while maintaining responsiveness during trend changes.
Component A3: Spline Quantile Regression Channel
Technical Foundation
This component uses quantile regression with cubic splines to forecast probable price paths. Unlike ordinary least squares regression which estimates the conditional mean, quantile regression estimates the conditional median and other quantiles, providing a more robust view of the price distribution.
The Three Quantiles
The upper quantile, defaulting to 95 percent, represents a statistically significant resistance level. The median quantile at 50 percent represents the most probable price path, functioning analogously to a moving average. The lower quantile at 5 percent represents a statistically significant support level.
Forward-Looking Capability
The channel is projected twenty bars into the future, providing a visual forecast of potential price ranges. This is particularly valuable for setting profit targets, anticipating potential reversals, and planning entries and exits. The quantile regression uses Iteratively Reweighted Least Squares optimization, automatically adjusting to find the best-fitting quantile curves within the defined lookback period. This iterative process ensures robust results even with non-normal price distributions.
Component A4: Reversal Probability Zones
Technical Foundation
This component identifies historical pivot points including swing highs and lows and builds statistical probability zones around them. The logic is based on the observation that price reversals tend to exhibit characteristic patterns in both magnitude and time.
How It Works
The system identifies swing highs and lows using a lookback window, then records the magnitude of each reversal in terms of price distance and the duration of each reversal in terms of number of bars. It computes percentiles of both magnitude and duration, then projects forward to create probable reversal zones.
Percentile Zones
The 25th, 50th, 75th, and 90th percentiles provide multiple probability levels. Lower percentiles represent conservative reversal expectations, while higher percentiles represent more aggressive projections. Multiple zones allow traders to assess probability of various outcomes.
Bullish vs. Bearish Coloring
Bullish zones are displayed in dark green, representing reversals from lows that favor long positions. Bearish zones appear in dark red, representing reversals from highs that favor short positions. The no-overlap logic can be configured to show only the most recent zone, preventing visual clutter on the chart.
Component A5: Trade Plan Generation
Automatic SL/TP Calculation
When a Kalman crossover occurs, the indicator can automatically draw both stop loss and take profit levels. The stop loss is placed at the trend filter level with an optional ATR-based buffer. The take profit is set at a user-defined risk-to-reward ratio, defaulting to 1.5.
Visual Output
The stop loss appears as a red dotted line with label, while the take profit displays as a solid line with label. Both are projected for a configurable number of bars into the future, providing a clear visual trade plan.
Component A6: Cross-Alert System
Unique Feature
The indicator can generate alerts when price closes above the Trend Filter line during an active RPZ zone and the zone color matches the cross direction. This cross-referencing between statistical zones and trend signals creates a powerful confluence filter. Example alerts clearly communicate the symbol, timeframe, direction, and current price level, allowing traders to respond quickly to high-probability setups.
---
Part B: AMD Orderflow Engine
Core Philosophy
The AMD Orderflow engine is built around the ICT Power of 3 concept, which posits that institutional trading follows a predictable three-phase structure. Accumulation occurs when smart money accumulates positions, typically during the Asian session. Manipulation happens when price is driven to extremes to trigger retail stops, typically during the London session. Distribution occurs when institutions distribute positions to retail traders, typically during the New York session.
Component B1: AMD Model Pro Plus v4
Session Structure
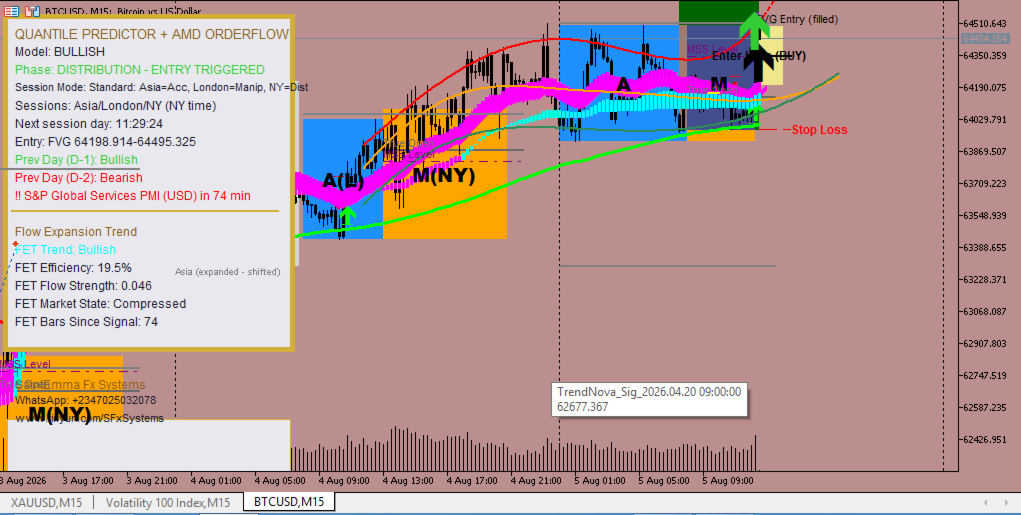
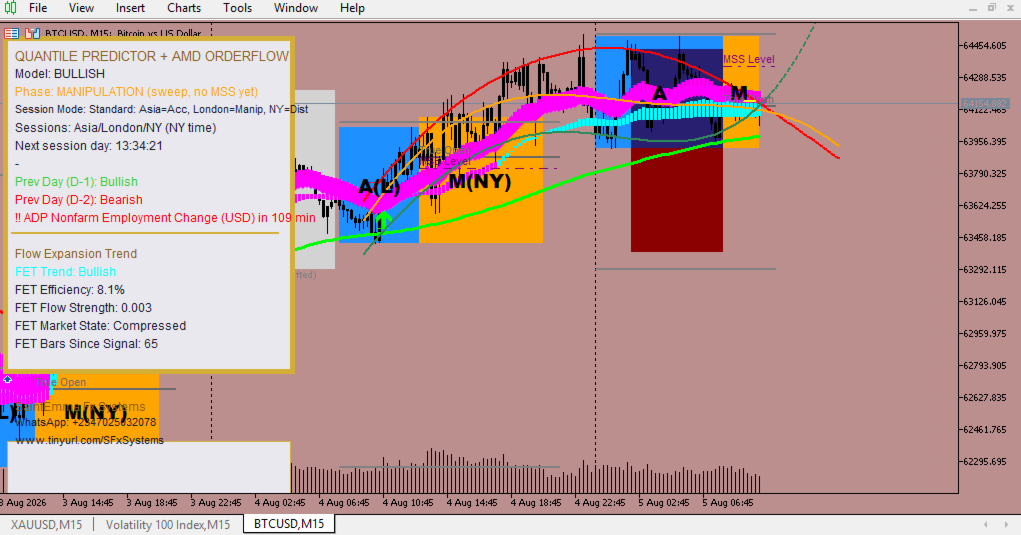
The Asian session functions as the accumulation phase, with default hours from midnight to 8 AM NY time. The London session serves as the manipulation phase from 8 AM to 1 PM NY time. The New York session acts as the distribution phase from 1 PM to 9 PM NY time.
Asian Expansion Detection
A sophisticated adaptive mechanism detects when the Asian session is trending rather than ranging. If the Asian range exceeds 55 percent of the average daily range, the session is classified as expanded. When expansion occurs, session roles shift automatically, with London becoming the accumulation phase and New York handling both manipulation and distribution. The Asian high and low are preserved as additional liquidity pools for New York to sweep.
Distribution Confirmation Criteria
Market structure shift requires price to break a protected swing point, using true fractal swings rather than simple candle opens. Displacement confirmation requires a strong candle with range exceeding twice the average range, confirming genuine institutional momentum. The FVG entry model waits for price to retrace into the gap or order block, providing a lower-risk entry model. If no FVG is found, a fallback entry uses a zone near the accumulation boundary, creating a wider but still structured zone.
Early Entry Option
For aggressive traders, the indicator offers an early entry at the manipulation reversal. This allows entry immediately at the MSS candle close with optional skipping of displacement and FVG retest requirements. A separate take profit level is provided with a configurable risk-to-reward multiple. Early entries are marked in magenta to distinguish them from confirmed entries, serving as a visual reminder of the higher risk profile.
Component B2: Uptrick Flow Expansion Trend
Technical Foundation
The FET component is an adaptive trend-following system that adjusts its responsiveness based on market efficiency. The efficiency ratio measures how directional price movement is, with values above 60 percent indicating a trending market, values between 30 and 60 percent indicating a developing market, and values below 30 percent indicating a compressing or consolidating market.
Core Mechanics
Higher alpha is applied when markets are efficient, enabling fast adaptation. Lower alpha is applied when markets are noisy, providing smooth filtering. The adaptive alpha formula uses efficiency squared to create responsive yet stable trend following. Flow velocity measures the speed of trend changes and is used to confirm signal strength.
Midline Calculation
The midline functions as an adaptive exponential moving average with speed varying according to market efficiency. It is color-coded with aqua for bullish conditions, magenta for bearish conditions, and yellow for neutral conditions. Up signals occur when price breaks above the upper boundary with positive flow strength. Down signals occur when price breaks below the lower boundary with negative flow strength. The bars since signal tracking helps traders assess the freshness of the current signal.
Signal Anchors
Users can configure signals to anchor at the midline, candle highs and lows, or at an ATR-based distance. This flexibility allows traders to customize signal placement according to their preferred entry style.
Component B3: AMD Anti-Flicker System
Technical Implementation
A critical user-requested feature dramatically improves chart usability. Before the fix, AMD boxes, letters, zones, and lines were deleted and redrawn on every tick, causing visible blinking. After the fix, visual elements are rebuilt only once per new bar. The dashboard and footer still update live every tick using find-and-update rather than delete-and-recreate, providing real-time information without the distracting flicker.
Result
Crystal-clear chart visuals without the distracting flicker that made the original indicators almost unusable on lower timeframes. This improvement alone makes the combined indicator practical for real-time trading.
Component B4: Economic Calendar Integration
News Warning System
The indicator connects to MT5's built-in economic calendar to warn of high-impact news. It scans for events in the symbol's base and quote currencies, warning when news is within a configurable time window defaulting to 60 minutes. Entries made near news are flagged with a visual warning, and alerts can optionally be suppressed near news events. This integration helps traders avoid getting caught in volatile news-driven moves.
---
Part B: Additional Components
Equal Highs and Lows
The system identifies price levels where multiple highs or lows occur at similar prices, with a tolerance threshold in points defaulting to 50. Equal highs are visualized as yellow horizontal dotted lines, while equal lows appear as aqua horizontal dotted lines. These levels often act as support and resistance and can be targeted by institutional traders.
Displacement Markers
Unusually large candles with range exceeding twice the average are marked with displacement arrows. Upward displacement displays as a green arrow above the candle, while downward displacement displays as a red arrow below the candle. These markers highlight areas of genuine institutional momentum.
Previous Day High and Low
The previous session high and low levels are drawn as gray dotted lines with labels. These serve as additional liquidity targets and often act as key support and resistance levels.
True Open Line
The opening price of the manipulation session is marked with a solid line. This serves as a critical reference level for market structure shift calculations and often acts as a magnet for price during the session.
---
Complete Trading System Framework
Core Trading Philosophy
The combined indicator creates a multi-timeframe and multi-method confluence system that requires validation from both statistical and institutional perspectives. No single component is sufficient for a trade decision. Each trade should ideally be confirmed by at least one signal from Part A and one from Part B.
---
The Stupid Simple Trading Framework
Step One: Assess the Macro Environment
Using Part A's Spline Quantile Channel, determine whether price is above or below the median quantile. Price above the median indicates a bullish bias, while price below indicates a bearish bias. Price approaching the upper or lower quantile suggests a potential reversal zone.
Using Part B's FET Dashboard, check the current trend direction showing bullish, bearish, or neutral. Review the efficiency level indicating directional, developing, or compressed market conditions. Assess the flow strength to determine whether momentum is strong or weak.
Step Two: Check for AMD Session Structure
Using Part B's AMD Model, identify which phase the market is currently in, whether accumulation, manipulation, or distribution. Confirm whether a market structure shift has occurred. Verify whether there is a valid FVG or entry zone being retested by price.
Step Three: Look for Confluence with RPZ
Using Part A's Reversal Probability Zones, determine whether there is an active RPZ zone on the chart. Note its color indicating bullish or bearish bias. Check whether price is within or approaching the zone.
Step Four: Execute the Trade
For a long trade setup, the quantile channel should show price above the median indicating a bullish environment. The FET dashboard should display bullish with efficiency above 50 percent confirming the trend. The AMD model should show distribution phase with bullish bias and MSS confirmed. The RPZ zone should be active and green indicating a bullish reversal zone.
The entry phase requires waiting for price to retest the FVG entry zone. Entry is triggered when price enters the zone. The rising trend filter with lime color provides additional confirmation.
For risk management, place the stop loss at the manipulation extreme plus buffer. Set the take profit at three times risk. Consider taking partial profits at one and one-half times risk.
For a short trade setup, the quantile channel should show price below the median indicating a bearish environment. The FET dashboard should display bearish with efficiency above 50 percent confirming the trend. The AMD model should show distribution phase with bearish bias and MSS confirmed. The RPZ zone should be active and red indicating a bearish reversal zone.
The entry phase requires waiting for price to retest the FVG entry zone. Entry is triggered when price enters the zone. The falling trend filter with red color provides additional confirmation.
For risk management, place the stop loss at the manipulation extreme minus buffer. Set the take profit at three times risk. Consider taking partial profits at one and one-half times risk.
The Early Entry Option
Early entries should only be used by experienced traders seeking earlier entry in the structure. The process requires waiting for MSS confirmation when price breaks the protected swing. Entry is triggered immediately or at retest if FVG is required. Separate stop loss and take profit levels are provided with a higher risk-to-reward multiple defaulting to two. The higher probability of being wrong means using smaller position sizes. Early entries are clearly marked in magenta on the chart.
News-Aware Trading
When news is approaching, the dashboard displays a warning with the news name and currency, showing how many minutes remain. Entries near news are flagged with a prominent warning. Alerts near news can be suppressed if desired. The recommended approach is to wait for news to pass before entering positions.
---
Dashboard Interpretation Guide
The Part A dashboard section displays the current AMD direction, the current phase, the session mode, and the countdown to next NY midnight. It shows the current entry zone levels, the status of any optional early entry, and the previous day's candle direction.
The Part B dashboard section displays the FET trend direction, market efficiency, flow strength, market state, and time since the last signal.
---
Risk Management Guidelines
Position Sizing
For standard entries, risk one to two percent of account per trade. For early entries with higher uncertainty, risk only half to one percent of account. For entries near news, reduce position size or skip entirely.
Stop Loss Placement
For standard entries, place the stop loss at the manipulation extreme plus buffer. For early entries, use the manipulation extreme plus buffer but tighter. Never move stop loss wider, only trail in profit.
Take Profit Strategy
Use the standard one to three risk-to-reward ratio. Consider closing fifty percent at one to one and a half risk and moving stop loss to breakeven. Allow remaining position to run with trailing stop loss.
---
Timeframe Recommendations
The AMD model works best on M5 to M15 timeframes where session structure is visible. The Spline Quantile channel performs well on H1 to H4 timeframes for swing analysis. The FET component is effective on M5 to M15 for trend following. Reversal zones are best viewed on H1 to H4 timeframes. The overall system performs optimally on M15 to H1 timeframes.
---
Advantages of This Combined System
Confluence validation ensures that statistical signals from Part A must align with institutional signals from Part B, resulting in higher probability trades. The cross-reference requirement naturally filters out many false signals. The quantile channel provides a price forecast enabling better anticipation of moves. The FET component adapts to market conditions, remaining effective in all regimes.
Automatic SL and TP generation ensures consistent risk management. The AMD model explains why price is moving, leading to better decision-making. Economic calendar integration protects against volatility spikes. The anti-flicker feature ensures clean chart visuals and reduced eye strain.
---
Key Trading Rules
The Five-Second Rule
Look at the quantile channel to determine whether price is above or below the median. Look at the FET dashboard to identify direction and efficiency. Look at the AMD boxes to see which phase is active. Look at the RPZ to confirm color matches trend. Look at the entry zone to check for price retesting the FVG.
The One-Minute Rule
Check the dashboard for all five criteria. If three of five criteria align, consider the trade. If four of five criteria align, the trade is good. If five of five criteria align, the trade is excellent. If fewer than three criteria align, skip the trade.
The Never Rule
Never trade against the trend filter color. Never trade against the FET direction. Never trade against the AMD phase, waiting for distribution. Never trade near high-impact news. Never risk more than planned.
---
Known Limitations and Considerations
Quantile Channel Projections
Statistical forecasts are not guaranteed. Projections are based on historical patterns and can be wrong during volatility spikes. The channel should be used as guidance rather than certainty.
AMD Model
The model requires clearly defined sessions and may not work on all instruments. It can produce false signals in highly ranging markets and should be combined with other confirmation.
FET Component
The component uses past efficiency to predict future and may lag during sudden reversals. It performs best in trending markets and should be used with trend confirmation.
News Filter
The filter only works with MT5's calendar data and requires accurate broker time settings. Some news events may be missing from the calendar, so additional news awareness is recommended.
Performance Impact
The indicator performs multiple calculations per bar and creates many graphical objects on the chart. This may impact performance on older computers. Consider adjusting chart timeframes or reducing historical data if performance issues arise.
---
Conclusion
The Quantile Predictor Plus AMD Orderflow Combined Indicator represents a sophisticated yet practical approach to multi-method trading analysis. By merging statistical price prediction with institutional order-flow analysis, it provides traders with a comprehensive framework for making informed trading decisions.
No single component is sufficient for a trade decision. Always seek confluence. The trend filter and FET provide trend direction. The RPZ and quantile channel provide statistical context. The AMD model provides institutional context. The entry zone provides precise entry timing. The SL and TP provide structured risk management.
For beginners, focus on the five-second rule and one-minute rule. Do not try to use all components at once. Master the AMD model first, then add the quantile analysis. For experienced traders, experiment with the early entry option, adjust parameters to suit your trading style, and use the cross-alert system to automate opportunity detection.
This is a tool, not a magic bullet. It provides high-quality confluence signals, but you must still exercise discipline, risk management, and sound judgment. Use it as part of a complete trading plan, not as your entire plan.