Trade Summary Pro

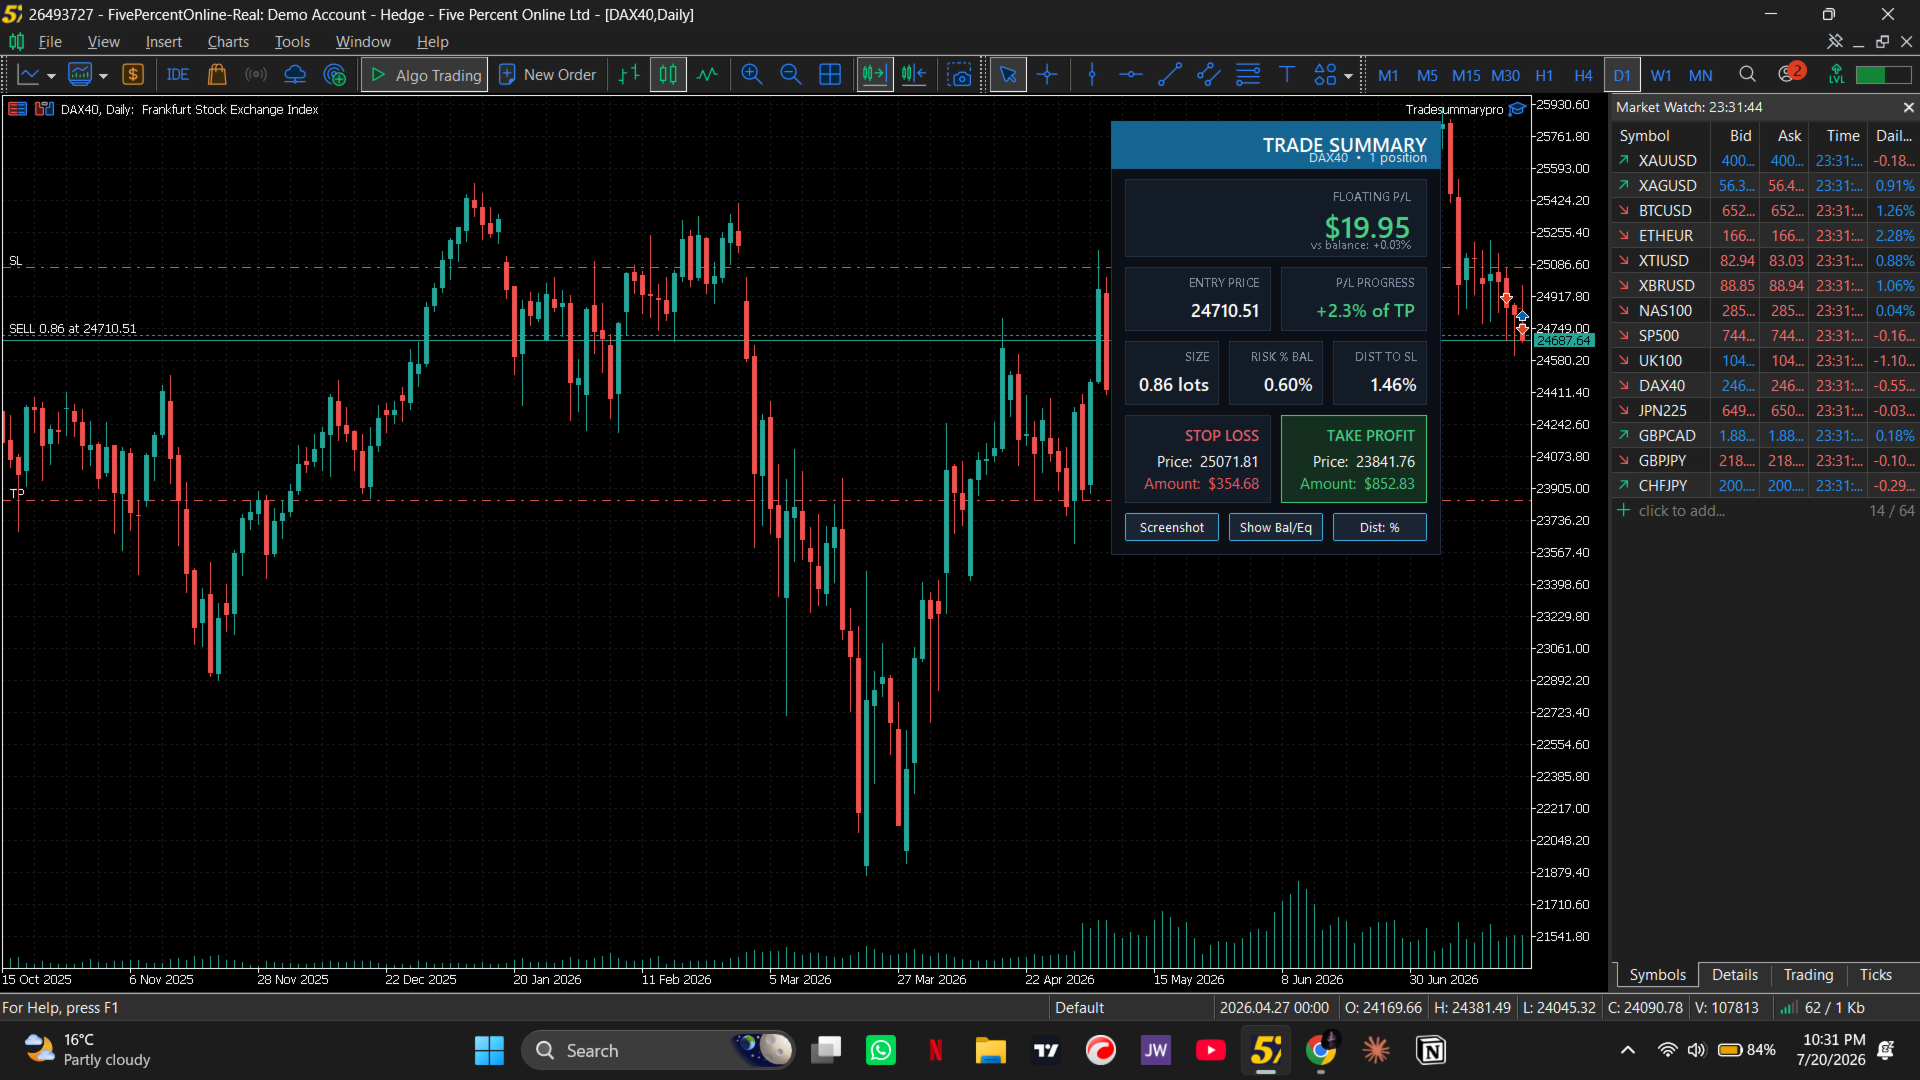
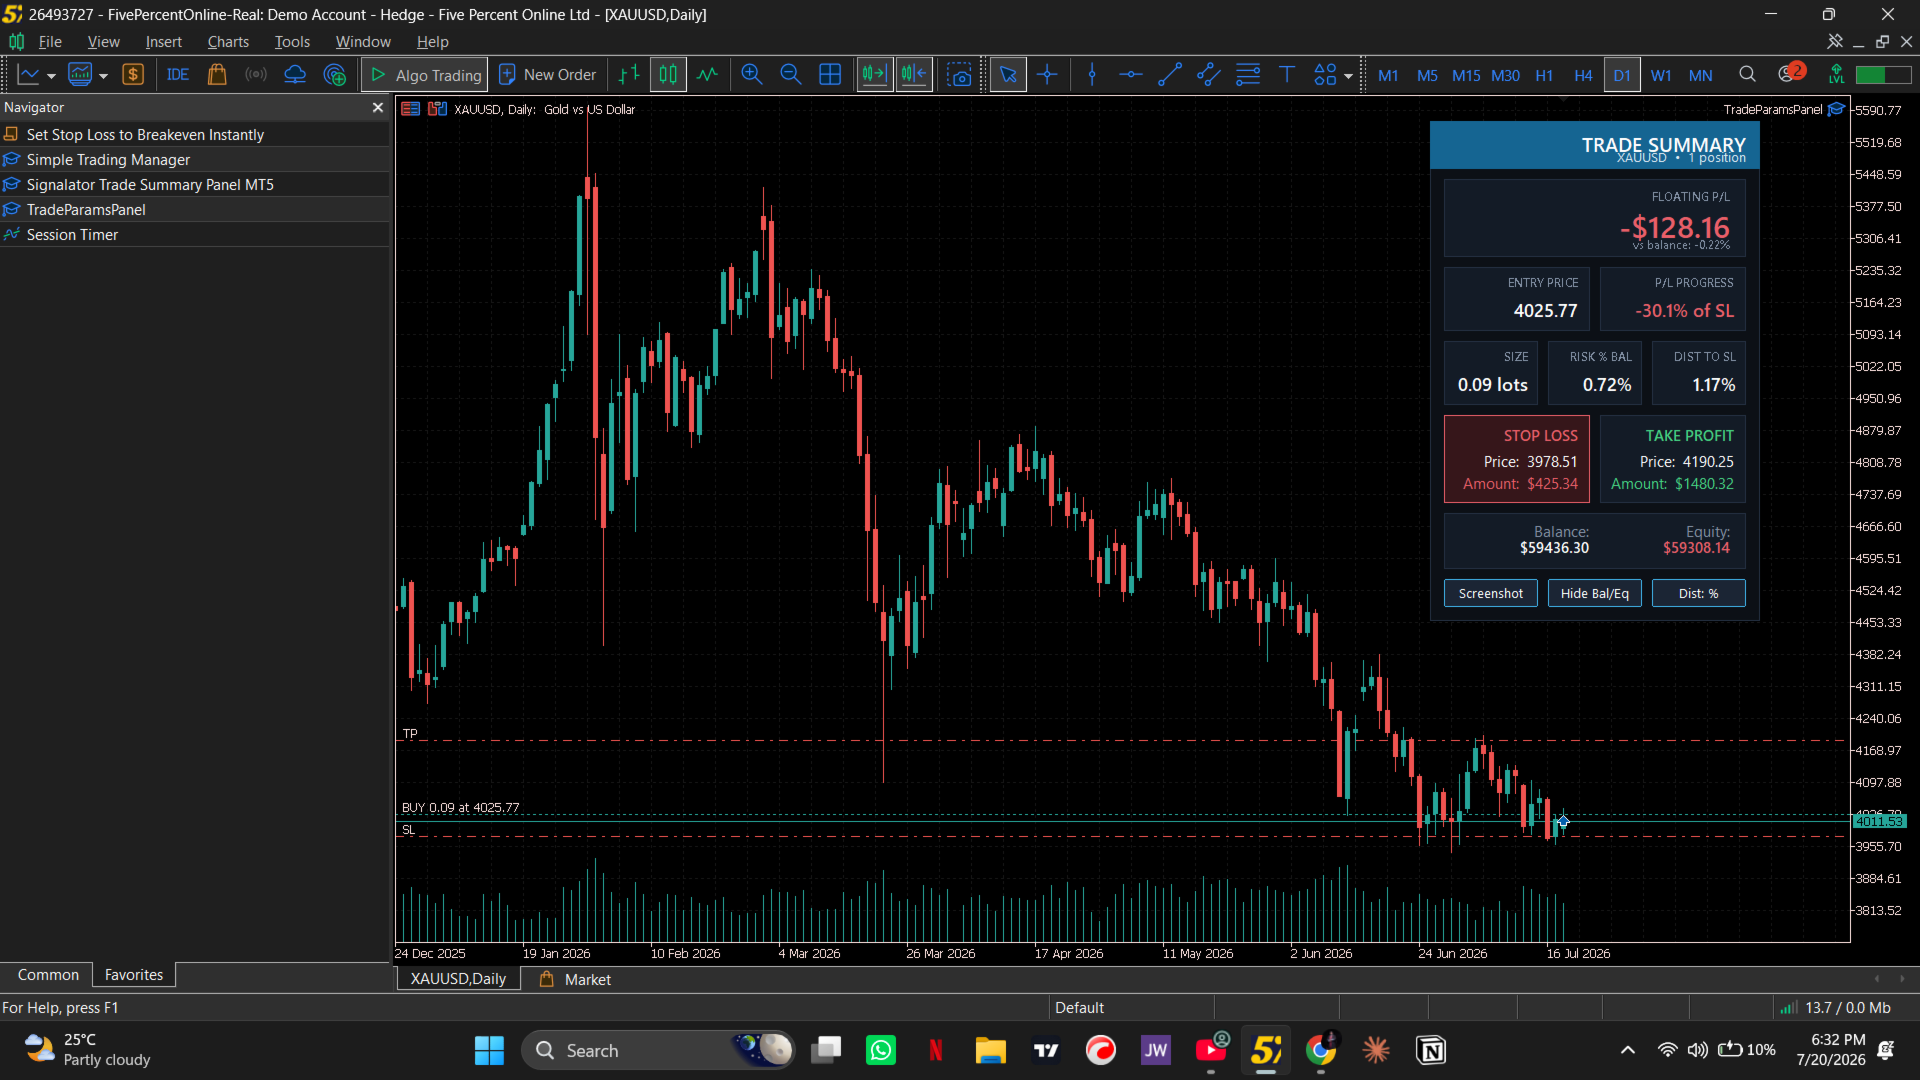
Trade Summary is a professional on-chart dashboard for MetaTrader 4 & 5 that provides a clear, real-time overview of your open trades. Monitor floating profit/loss, entry price, lot size, account risk, distance to stop loss, stop loss and take profit values, balance, and equity—all from one compact panel.

Designed for traders who value speed and effective risk management, Trade Summary eliminates manual calculations and keeps essential information visible at a glance. It also includes a privacy mode to hide balance and equity when taking screenshots or sharing your charts.

Whether you trade Forex, Gold, Indices, Commodities, or Crypto CFDs, Trade Summary helps you manage positions with greater confidence and make faster, more informed trading decisions.
おすすめのプロダクト
is a versatile analytical tool designed for both advanced traders and beginners. It combines classic trend line analysis with automatic Fibonacci level plotting to deliver precise market entries and structural clarity. Built as an intuitive and clean on-screen dashboard, this indicator simplifies multi-timeframe analysis without cluttering your main workspace. Technical Analysis and Entry Points The indicator automates the most critical aspects of price action and structural trading: Trend L
Canal de Máximos y Mínimos en Escalera Indicador avanzado para MT5 diseñado para analizar el rango diario del precio y construir niveles dinámicos en forma de escalera. El indicador calcula los máximos y mínimos reales de cada día, obtiene una distancia promedio histórica y la divide según el valor configurado en INPUT_Distancia . Con esa distancia genera niveles superiores e inferiores que sólo aparecen cuando el precio los alcanza. La línea amarilla representa el centro del canal. Desde ese pu
Dynamic Trend Channel Ultimate for MT5 (M30) Professional Trend-Following & Smart Signal System Dynamic Trend Channel  is an advanced trend-following indicator designed specifically for the M30 timeframe on MetaTrader 5. It combines dynamic trend channels, adaptive volatility calculations, smart trend detection, trailing stop technology, and real-time signal generation to help traders identify high-probability market opportunities with greater confidence. Built around a dynamic EMA-based channel
GannNexus :価格と時間の幾何学の究極の融合 市場に隠された幾何学的構造を解き明かします。 GannNexus v3.00  は、単なるサポート/レジスタンス指標ではありません。これは、 ジョン・マーフィー の古典的な市場構造分析と、 W.D.ギャング の高度な「価格-時間角度」理論、9の平方(Square of 9)の数学、および神聖幾何学を融合させた包括的な分析エンジンです。 精度を求めるトレーダーのために設計されたこのツールは、市場の形状(正方形、三角形、六角形)を自動検出し、主要なピボットから動的なギャン角度を計算し、9の平方の公式を使用して将来の価格/時間ターゲットを投影します。 主な機能 1. 高度なサポート&レジスタンスエンジン 動的なS/Rレベル: 最近のピボットのクラスターに基づいて、重要なサポートおよびレジスタンスゾーンを自動的に識別します。 トレンドライン: 主要な高値と安値を接続する自動トレンドラインを描画し、即時の市場方向を可視化します。 ピボットポイント: スイングハイとスイングローをカスタマイズ可能な矢印で明確にマークします。 2. W.D.
Veltrion Smart Fibonacci   is a clean automatic Fibonacci structure overlay for MetaTrader 5. It automatically detects recent swing highs and swing lows, then draws key Fibonacci retracement levels directly on the chart. The indicator is designed to help traders visualize market structure, retracement zones, and the golden zone without manually drawing Fibonacci tools. Key Features Automatic swing high and swing low detection Clean Fibonacci retracement overlay Horizontal Fibonacci levels for a
The indicator is designed to close positions on the market in time. For example: to take profits ahead of schedule if the price has not reached TakeProfit, and the market is turning around. The indicator analyzes the momentum, not the trend. He does not give any information about the trend. The indicator is well suited for finding divergence. The Ershov 38 Parrots indicator dynamically adjusts to the market and detects price movement impulses of medium and high amplitude. It almost does not rea
Use only RAW Spread AC use SL 270 & TP 2700 1:30 risk Reward EA Key Advantages Automated, hands-free trading — no manual monitoring required once attached to the chart. Multi-layer signal confirmation — combines an RSI oscillator, Ichimoku Kinko Hyo, and a time filter before entering a trade, reducing false signals. Step trailing stop protection — profits are locked in gradually as price moves in your favor, rather than using a single static trailing distance. Built-in risk controls — fixed Stop
Professional Overview: Quantile Predictor + AMD Orderflow Combined Indicator --- Executive Summary The Quantile Predictor + AMD Orderflow Combined Indicator represents a sophisticated fusion of two distinct trading methodologies into a single, cohesive analytical tool for MetaTrader 5. This indicator merges statistical price prediction with institutional order-flow analysis, creating a comprehensive trading framework that allows traders to cross-reference two independent perspectives before
Develop this indicator for periods of 30 minutes or more, focus on getting market trends right and making sure they are met. MFOP v8.1 gets straight to the point: it scans the market and tells you exactly when there is enough strength to enter a trade. This indicator doesn't do magic, it uses mathematical algorithms to filter out market noise, not enter into false breakouts and show you clear BUY (blue arrow) and SELL (red arrow) opportunities. It is designed and optimized specifically to take
Ai Scalper Pro
Dhiraj Shivprabhu Pattewar
1. Precision Entry Engine (The Edge) True-Swing Breakout Technology: The EA doesn't rely on lagging indicators. It maps live market structure, identifying localized "True Swings" (fractal highs and lows) to anticipate explosive momentum breakouts. Pre-Emptive Stacking: Anticipates major moves by placing resting Stop orders exactly at critical levels. When Gold breaks out, you are already in the trade. Daily Clean-Sweep: Every day at rollover (23:50), the bot automatically purges all resting o
XENON SUPERTRENDS : The Institutional Gold Standard for MT5 "Precision. Stability. Dominance. Experience the Truth in Every Tick." Welcome to the pinnacle of trend-following precision. XENON SUPERTRENDS Master Edition is not just an indicator; it is a high-performance analytical environment engineered for professional traders who demand absolute transparency and unshakeable accuracy. Specifically optimized for the world’s most volatile assets like Gold (XAUUSD), Global Indices (NASDAQ/DAX), an
Neuro Poseidon is a new indicator by Daria Rezueva. It combines precise trading signals with adaptive TP/SL levels - creating best possible trades as a result! Message me and get  Neuro Poseidon Assistant  as a gift to automize your trading process! What makes it stand out? 1. Proven profitability on all assets and timeframes 2. Only confirmed BUY and SELL signals present on the chart 3. Adaptive TP & SL levels generated by the software for each trade 4. Easy to understand - suitable for al
If you are unsure how to use this indicator, please feel free to reach out to me. I will explain it to you and provide reading materials to help you make the most of it. TD Sequential Scanner: An Overview The TD Sequential scanner is a powerful technical analysis tool designed to identify potential price exhaustion points and trend reversals in financial markets. Developed by Tom DeMark, this method is widely used by traders to gauge market cycles and potential turning points with precision. Ho
概要 外国為替や金融市場では、迅速な反応と正確な意思決定が非常に重要です。しかし、標準のMetaTrader 5端末は最小でも1分のチャートしかサポートしておらず、トレーダーが市場の変動に敏感であることを制限しています。この問題を解決するために、 秒単位チャートキャンドルインジケーター を導入しました。このインジケーターを使用すれば、1秒から30秒の市場の動向をサブチャートで簡単に表示・分析できます。 主な機能 複数の秒単位タイムフレームのサポート :このインジケーターは、以下のタイムフレームを選択でき、さまざまな取引戦略に対応します: S1 : 1秒 S2 : 2秒 S3 : 3秒 S4 : 4秒 S5 : 5秒 S10 : 10秒 S15 : 15秒 S20 : 20秒 S30 : 30秒 リアルタイム更新 :秒単位チャートはリアルタイムで更新され、各瞬間に最新の市場情報を提供します。これにより、迅速な取引判断が可能になります。 ユーザーフレンドリーなインターフェース :インジケーターはサブチャートに表示され、直感的で使いやすいです。異なるタイムフレームに素早く切り替えて市場を迅速
Introducing Assembler:  The best value for money,  Designed for advanced traders and professionals, yet accessible for ambitious beginners ready to elevate their trading game. Great for ICT, SMC, TREND and breakout traders . Combining advanced analytics, a sleek graphical interface, and highly customizable features, Assembler empowers you to trade with precision, clarity, and confidence. Key Features of Assembler 1. Dynamic Graphical User Interface (GUI): A fully draggable, customizable interf
TVM Chitumwa
YIVANI KUNDAI CHITUMWA
TVM Chitumwa:ノイズとモメンタムの幾何学 MetaTrader 5 向け機関投資家仕様トータルバリエーション分析 トータルバリエーション最小化は応用数学における実績ある手法であり、医療画像、地震データ、衛星画像からノイズを除去しながら本来の信号を損なわないために用いられてきました。TVM Chitumwaはこの系譜を価格変動の分析に応用し、市場の正味の構造的変位と、そこに至るまでに移動した全経路長を比較することで、高周波ノイズという幾何学的な影から真の方向性を切り分けるレジーム検出エンジンです。 一般的な平滑化系インジケーターには遅延があり、従来型オシレーターは強いトレンドに逆張りすることを強いられます。TVM Chitumwaはこうしたリテール的な発想を一切排除しています。 本インジケーターにおける極端なスパイクはトレンド消耗のサインではなく、摩擦のないトレンドが存在することの数学的証明です。 デュアルコア・アーキテクチャ 瞬時の裁量トレードと、厳密なアルゴリズムのバックテストの両方に対応するよう設計されています: 裁量トレーダー向け(フルフラッシュUI): 目に負担
Liquid Pours Xtreme
POPEY GROUP S.A.C.S.
5 (1)
Liquid Pours Xtreme EA は、流動性パターンに基づいて取引を自動化するエキスパートアドバイザーであり、柔軟な設定が可能なリスク管理と高いカスタマイズ性を兼ね備えています 主な特徴 1. 流動性パターンとカスタマイズ可能な取引時間 定時検出: ユーザーが設定した2つの時間帯( LiquidityHour1, LiquidityMin1 および LiquidityHour2, LiquidityMin2 )で価格の動きを捉えます。 取引シグナル: 流動性の変化に基づき、買いまたは売りのシグナルを生成します。「価格は必ず戻る」という前提に依存しません。 2. カスタマイズ可能なリスク管理 自分に合わせた調整: ユーザー自身の好みに応じてリスクパラメーターを設定可能です。 各取引の保護: すべての注文はストップロス(SL)とテイクプロフィット(TP)を伴い、予期せぬ市場変動によるリスクを抑えます。 3. 部分決済と自動ブレイクイーブン 利益の最適化: 特定の利益水準に達した際に、戦略的なポイント(例:ポジションの50%および30%)で部分決済を行います。 動的な管理: 市
Introduction to Fractal Pattern Scanner Fractal Indicator refers to the technical indicator that makes use of the fractal geometry found in the financial market. Fractal Pattern Scanner is the advanced Fractal Indicator that brings the latest trading technology after the extensive research and development work in the fractal geometry in the financial market. The most important feature in Fractal Pattern Scanner is the ability to measure the turning point probability as well as the trend probabil
NEXY is a professional multi-timeframe trading system based on Market Structure (HH/HL/LH/LL) and Fibonacci Retracement zones.  CORE STRATEGY: The EA identifies pivot points (higher highs, higher lows, lower highs, lower lows) to determine the market structure. Once the main structure is established, it calculates Fibonacci retracement zones (0.618-0.786) where the price is likely to retrace before continuing in the direction of the trend. You can select which timeframes to align with the main
StructureScope - The chart's structure, drawn only once it is confirmed. WHAT IT DRAWS   Market structure   Break of Structure and Change of Character, labelled                      at the level that was broken.   Order blocks       The last opposing candle before the leg that broke                      structure. Shaded while unmitigated, closed off once                      price has traded back through it.   Fair value gaps    Three-bar imbalances that have not been filled.                
Dragon Ball MT5 is newly available with a promotion There are only a few copies left, $599 Next price: $799 Final price: $1599 Real-time live account signals:   https://www.mql5.com/en/signals/2361170 The Best Expert Advisor  on   XAUUSD   any timeframes , H4 breakout strategy, The number of orders placed every day is staggering! Dragon Ball MT5 Updated v1.80 !!      Important update:   Optimized the stability of DB1~DB7 strategy, Merge ET9 's D1 breakout strategy,  Add MaxStopLoss and MaxTake
The  OBV MTF  is an Enterprise-grade On-Balance Volume indicator that transforms standard OBV into a complete trading system. It combines gradient-aware momentum analysis, divergence detection, multi-timeframe alignment, and dynamic customisable midpoint-filtering in a single intuitive professional volume analysis tool. Core Features 1. 5-State Momentum Engine Aqua (Strong Bullish) : OBV slope rising with positive acceleration SteelBlue (Weak Bullish) : OBV rising but losing momentum Gray (Neutr
**BoS-CHoCH Engulfing EA — From Learn to Earn.** Trade the moment market structure breaks — a Break of Structure or a Change of Character — but only when a confluent engulfing confirms it at the level.   ### Structure breaks. An engulfing confirms.   Fractal pivots map the market structure on your analysis timeframe. When a swing level is broken — a **BOS** (continuation) or a **CHoCH** (reversal) — the EA does not act on the break alone. It waits for a **confluent engulfing candle AT that level
BlackBox XAU — ゴールド向け先進型エキスパートアドバイザー 概要 BlackBox XAU は、ゴールド市場で利益を狙いながら、ドローダウンを厳格に管理するために丁寧に設計されたトレーディングシステムです。市場のすべての値動きを追いかけるのではなく、規律あるルールベースのアプローチを採用し、ボラティリティに適応しながら 高確率のトレード機会 のみを抽出します。 EA はリアルタイムで市場状況を継続的に評価し、質の低いシグナルを排除して、リスクとリワードのバランスが明確に有利になったタイミングを辛抱強く待ちます。条件が揃うと、精密なエントリーと動的に調整される保護機能を伴ってトレードを実行します。 この慎重な設計により、BlackBox はチャートを大量のエントリーで埋め尽くすことはなく、 量より質 を重視します。統計的に優位性のあるセットアップに集中することで、トレーダーにとって 安定した収益性、管理されたドローダウン、リスク調整後の一貫したリターン へとつながります。 仕組み BlackBox の中核は、市場のボラティリティとトレンドの変化を継続的に監視し、 リスクを大
# MT5用スクイーズ・モメンタム・インジケーター MetaTrader 5向けにプロが開発した強力な**スクイーズ・モメンタム・インジケーター**で、爆発的な市場チャンスを掴みましょう。 この高度なボラティリティ・モメンタム・インジケーターは、トレーダーが大きな市場変動が起こる前の低ボラティリティ期間を特定するのに役立ちます。ボリンジャーバンドとケルトナーチャネルの強みを組み合わせたこのインジケーターは、市場が「スクイーズ」状態にあり、ブレイクアウトの準備をしているタイミングを明らかにします。 内蔵のモメンタム・ヒストグラムにより、トレンドの方向とモメンタムの変化を容易に把握でき、トレーダーは自信と精度を持ってトレードを行うことができます。 ## 機能 * 高度なスクイーズ検出システム * プロフェッショナルなMT5実装 * 急激なブレイクアウト前にボラティリティスクイーズを検出 * 動的な色変化を伴うモメンタムヒストグラム * 市場状況を容易に把握できるスクイーズステータスドット * 以下の指標を組み合わせ: * ボリンジャーバンド * ケルトナーチャネル * 線
Linear Trend Predictor ー - エントリ ポイントと方向サポート ラインを組み合わせたトレンド インジケーター。高値/安値チャネルを突破するという原理に基づいて機能します。 インジケーターのアルゴリズムは市場のノイズをフィルタリングし、ボラティリティと市場の動向を考慮します。 インジケーターの機能  平滑化手法を使用して、市場のトレンドと、買い注文または売り注文を開くためのエントリー ポイントを表示します。  任意の時間枠のチャートを分析して、短期および長期の市場の動きを判断するのに適しています。  あらゆる市場や時間枠に適応可能な入力パラメータにより、トレーダーはインジケーターを独自にカスタマイズできます。  設定されたインジケーター信号は消えず、再描画もされません。ローソク足の終値で決定されます。  いくつかの種類の通知が矢印と組み合わされています。  このインジケーターは、独立した取引システムとして使用することも、他の取引システムへの追加として使用することもできます。  あらゆるレベルの経験を持つトレーダーが使用できます。 主なパラメータ Vol
AItify Aegis Quant は、マルチモデルアンサンブルアプローチを利用する高度なクオンツ取引システムです。単一のテクニカル指標や基本的なロジックに依存する代わりに、30種類の異なる数学的アルゴリズムを通じて市場データを処理します。これにより、システムは取引決定を下す前に高度に信頼性の高いコンセンサスを達成でき、お客様のポートフォリオに真の機関投資家レベルのアーキテクチャを提供します。 利点と特徴 機械学習アンサンブル:エンジンは、サポートベクターマシン、ランダムフォレスト、リカレントニューラルネットワークを含む30の独自分析モデルを使用して、方向性確率を計算します。 ダイナミックリスク管理:システムは、組み合わされたシグナルの正確な信頼度スコアに基づいてロットサイズを積極的に適応させます。高確率のセットアップには最適なスケーリングが適用され、不確実な条件はフィルタリングされます。 高度な資本保護:AItify Aegis Quant には、バリュー・アット・リスクやケリー基準を含む10種類のマネーマネジメントモデルが含まれています。これにより、ポートフォリオのエク
Gold Trend Swing
Luis Ruben Rivera Galvez
5 (1)
Send me a message so I can send you the setfile 導入費用は498ドル。1298ドルに達するまで毎月100ドルずつ増加します。 XAUUSD (GOLD) の自動取引ボット。 このボットを XAUUSD (GOLD) H1 チャートに接続し、実証済みの戦略で自動的に取引しましょう。シンプルでありながら効率的な自動化を求めるトレーダー向けに設計されたこのボットは、低~中程度のスプレッドに最適化され、テクニカル指標と価格アクションの組み合わせに基づいて取引を実行します。 ボットはどのように機能しますか? 推奨される時間枠: 信号精度のバランスとノイズの低減を実現する H1 (1 時間)。 主要資産: XAUUSD (ゴールド)、明確なチャンスがある非常に変動の激しい市場。 エントリーとエグジット: ボットは価格パターン、主要レベル、モメンタム確認を分析して取引を開始/終了します。 組み込みのリスク管理: ポジション サイズを自動調整し、動的なストップロス保護を使用します。 簡単セットアップ – すぐに使用可能 推奨ロットサイズ
Brilliant Reversals MultiCurrency Scanner MT5は、複数の通貨ペアにおける潜在的な反転ポイントを特定しようとするトレーダーのために設計された最先端のトレーディングインジケーターです。高度なアルゴリズムを活用することで、このツールは瞬時に洞察を提供し、トレーディング戦略を最適化しようとする初心者と経験豊富なトレーダーの両方にとって非常に貴重です。 このインジケーターは、市場の状況に基づいてリアルタイムの売買シグナルを提供することで、トレーダーの意思決定を強化し、取引パフォーマンスを向上させます。包括的なダッシュボードとアラート機能を備えており、主要な通貨ペアを簡単に監視し、市場の機会に迅速に対応できます。 MQL製品のインストールガイド | MT4/MT5で購入したMQL製品の更新 | 一般的なトラブルシューティングガイド | インジケーター設定 / ガイド 主な特徴 バッファ統合: インジケーターの値をアクセス可能なバッファとして公開し、Expert Advisorがシグナルベースのトレーディングを効果的に利用できるようにします。 視覚的矢印シ
AURUM MID-QUANT PRO v5.60 Quantitative Excellence for Gold (XAU/USD) & Volatility Trading Gain a professional edge over institutional markets with AURUM MID-QUANT PRO , an advanced Price Action Pattern Detection and Breakout Engine designed exclusively for MetaTrader 5 . Built specifically to capture the unique volatility of Gold (XAU/USD) and other major financial instruments, this powerful indicator combines high-precision algorithmic pattern recognition with real-time dynamic accumulation z
このプロダクトを購入した人は以下も購入しています
note: this indicator is for METATRADER4, if you want the version for METATRADER5 this is the link:  https://www.mql5.com/it/market/product/108106 TRENDMAESTRO ver 2.5 TRENDMAESTRO recognizes a new TREND from the start, he never makes mistakes. The certainty of identifying a new TREND is priceless. DESCRIPTION TRENDMAESTRO identifies a new TREND in the bud, this indicator examines the volatility, volumes and momentum to identify the moment in which there is an explosion of one or more of these da
PrimeScalping is a powerful trading companion designed to generate high-probability entry signals with dynamic TP/SL/DP levels based on volatility. Built-in performance tracking shows win/loss stats, PP1/PP2 hits, and success rates — all updated live. Key Features: Buy/Sell signals with adaptive volatility bands Real-time TP/SL/DP levels based on ATR Built-in MA Filter with optional ATR/StdDev volatility Performance stats panel (Success, Profit/Loss, PP1/PP2) Alerts via popup, sound, push, or e
FX-AIEA Smart Supply and Demand Zone Identification Indicator (Supply and Demand Indicators MT5) Version: 2.51 | Compatible Platform: MetaTrader 5   Why do trades need supply and demand zones? Supply and demand zones are the core manifestation of institutional order flow, reflecting real buying and selling power more accurately than traditional support and resistance. However, manual drawing is not only time-consuming but also highly subjective and prone to missing key areas. FX-AIEA Supply-De
SmartScalping is a powerful trading companion designed to generate high-probability entry signals with dynamic TP/SL/DP levels based on volatility. Built-in performance tracking shows win/loss stats, PP1/PP2 hits, and success rates — all updated live. Key Features: Buy/Sell signals with adaptive volatility bands Real-time TP/SL/DP levels based on ATR Built-in MA Filter with optional ATR/StdDev volatility Performance stats panel (Success, Profit/Loss, PP1/PP2) Alerts via popup, sound, push, or e
ScalpPoint is a powerful trading companion designed to generate high-probability entry signals with dynamic TP/SL/DP levels based on volatility. Built-in performance tracking shows win/loss stats, PP1/PP2 hits, and success rates — all updated live. Key Features: Buy/Sell signals with adaptive volatility bands Real-time TP/SL/DP levels based on ATR Built-in MA Filter with optional ATR/StdDev volatility Performance stats panel (Success, Profit/Loss, PP1/PP2) Alerts via popup, sound, push, or emai
MasterTrend Indicator for MT5 A powerful trend-following and signal-evaluation tool MasterTrend   is a custom MT5 indicator that combines Moving Averages and ATR-based risk/reward logic to generate clear buy/sell signals. It visualizes dynamic SL/TP levels, evaluates past trade outcomes, and displays win/loss statistics in a clean on-chart panel. Key features include: Buy/Sell signals based on MA crossovers ATR-based SL/TP1/TP2/TP3 levels with visual lines and labels Signal outcome tracking wit
相場が本当は何をしているのかを見抜く。   3つの市場フェーズ(収縮・拡張・トレンド)を目の前でライブに捉え、トレンド・フェーズの初期段階でより優れたエントリーを取りましょう   。      当て推量はもう終わり。機関投資家やスマートマネーのように相場を読み始めましょう。   Apex Market Structure Pro(MT5版)は、ノイズを取り除き、あらゆるローソク足の下にある真の構造を見せる高精度のスマートマネー分析ツ   ールです。流動性、構造転換、蓄積ゾーン、トレンドバイアスを、ひとつのクリーンでプロフェッショナルなオーバーレイに集約します。遅行   指標に見切りをつけ、明晰さをもってトレードする準備のできた本気のトレーダーのために作られました。   重要:本インジケーターは Heikin Ashi(平均足)ローソク足での動作を前提に設計されています。使用前にチャートを Heikin Ashi   に設定し、その真価を解き放ってください。分析のすべては Heikin Ashi の価格の流れを軸に構築されています。Apex Market Structure Pr
AriX
Temirlan Kdyrkhan
1 (4)
AriX Indicator for MT5 A powerful trend-following and signal-evaluation tool AriX is a custom MT5 indicator that combines Moving Averages and ATR-based risk/reward logic to generate clear buy/sell signals. It visualizes dynamic SL/TP levels, evaluates past trade outcomes, and displays win/loss statistics in a clean on-chart panel. Key features include: Buy/Sell signals based on MA crossovers ATR-based SL/TP1/TP2/TP3 levels with visual lines and labels Signal outcome tracking with real-time stat
VTrende Pro
Andrii Diachenko
5 (1)
VTrende Pro - MTF indicator for trend trading with a display panel for MT5 *** Videos can be translated into any language using subtitles (video language - Russian) Although the signals of the VTrende Pro indicator can be used as signals of a full-fledged trading system, it is recommended to use them in conjunction with the Bill Williams TS. VTrende Pro is an extended version of the VTrende indicator. Difference between Pro version and VTrende: - Time zones - Signal V - signal 1-2 waves -    S
CGE Trading Suite
Carl Gustav Johan Ekstrom
5 (2)
Institutional-Grade Analytics for MT5 The full analytical edge of a professional trading desk, built into your MT5 chart. CGE Trading Suite is an indicator system of 21 integrated modules covering market structure, timing, momentum, volume, capital flow and regime change, combined into a single chart-based workspace. Why CGE Trading Suite? The suite empowers traders with structure, confidence, and consistent performance across all markets and time frames. Hover over any signal or tool on the c
MERAVITH SCANNERは、MetaTrader 5用のプロフェッショナルな金融市場インジケーターで、複数の分析ツールを一つの統合システムにまとめています。独自の出来高加重平均価格(VWAP)手法を使用してすべての計算を自動で行い、主観的な解釈を完全に排除します。 このインジケーターは、すべての資産クラス(FX、株式、指数、商品、暗号通貨)およびM1から月足までのすべての時間軸で動作します。基本原理は「価格は出来高に従う」というものです。MERAVITHは機関投資家の出来高が集中するポイントを特定し、その集中から数学的に正確な価格レベルを導き出します。予測や投機は行わず、計算のみを行います。 MERAVITH SCANNERを使用すると、28の主要FX通貨ペアをすべての時間軸でわずか2~3分でスキャンできます。また、任意の市場をスキャンすることも可能です。例えば、約100銘柄の株式を約10分でスキャンできます。 インジケーターは、消耗レベル、均衡線、偏差、統計レベル、およびターゲット予測を算出します。 チャート要素 Origin Point :すべての計算が始まる起点です。イン
Big Player Range
Thalles Nascimento De Carvalho
5 (3)
BigPlayerRange — MT5向け最強インジケーター BigPlayerRange は、MetaTrader 5 で日経ミニやドル先物などの取引において、 最も効果的なインジケーター と評価されています。大口投資家(機関投資家)の行動を可視化し、高精度なテクニカル分析を可能にします。 どのように機能するのか? BigPlayerRangeは、買い圧力ゾーン(緑ライン)と売り圧力ゾーン(赤ライン)を描画し、価格がその範囲を超えるとトレンド方向への動きを示唆します。 緑のライン上で終値: 買いの勢いが強く、上昇トレンドの可能性。 赤のライン下で終値: 売り圧力が優勢で、下落が予想される。 範囲内での価格: レンジ相場でブレイクを待つ段階。 主なメリット: 機関投資家ゾーンの検出: 大口のエントリーポイントを視覚化。 自動ターゲット計算: 利確ポイントを戦略的に設定。 プルバックの可能性分析: リスク管理に役立つ情報提供。 推奨の使い方: Imbalance DOM Pro と併用してゾーンブレイクを確認。 SwingVolum
ZIVA Signal Intelligence
Hassan Abdullah Hassan Al Balushi
ZIVA Signal Intelligence An Adaptive, Modular Market Intelligence System ZIVA Signal Intelligence is not positioned as a conventional trading indicator. It is a fully integrated, proprietary market intelligence system engineered to deliver structured, high-precision interpretation of price behavior within a controlled analytical environment. Developed through an independent architectural approach, ZIVA does not rely on, derive from, or replicate existing indicators. It represents a standalone
OmniSync Projection
Antonio-alin Teculescu
5 (1)
Chronos Fractal Engine is an innovative price projection indicator for MetaTrader 5, designed to transform your technical analysis by intelligently identifying and projecting historical price patterns. Built upon an advanced correlation algorithm and the fractal principles of the market, this powerful tool visualizes potential future price movements, giving you a unique edge in your trading decisions. What is Chronos Fractal Engine? At its core, the Chronos Fractal Engine employs a sophisticat

SMC Institutional Suite v3.7 Professional Smart Money Concept Indicator for MetaTrader 5 What is New in Version 3.7 - Visual Stability Update This release focuses entirely on one goal: making every zone, label, and line on your chart rock-solid stable. There is no more flickering, no more zones disappearing on a new candle, and no more duplicate drawings. Order Block (OB) zones no longer flicker or disappear. Once drawn, they stay permanently on the chart. Equal Highs and Equal Lows (EQH / EQL)


Triple Crox Strategy v4.10 Triple Crox Strategy v4.10 Professional MetaTrader 5 Indicator 13 Patterns • Fibonacci • CLUSTER ML • Multi-Filter 1. Overview Advanced MT5 indicator combining 13 Pattern Detection , Fibonacci Analysis , CLUSTER Machine Learning and Multi-Filter system for precise signals on Forex, indices, commodities, crypto. 5-step pipeline: indicators → filter → patterns → signals → levels. 2. Trading Setup Heikin-Ashi colored bars. Buy/Sell arrows with Entry, TP1(1x ATR), TP2(2x
The Expert Advisor and the video are attached in the Discussion tab . The robot applies only one order and strictly follows the signals to evaluate the indicator efficiency. Pan PrizMA CD Phase is an option based on the Pan PrizMA indicator. Details (in Russian). Averaging by a quadric-quartic polynomial increases the smoothness of lines, adds momentum and rhythm. Extrapolation by the sinusoid function near a constant allows adjusting the delay or lead of signals. The value of the phase - wave s
Классификатор силы тренда. Показания на истории не меняет. Изменяется классификация только незакрытого бара. По идее подобен полной системе ASCTrend, сигнальный модуль которой, точнее его аппроксимация в несколько "урезанном" виде, есть в свободном доступе, а также в терминале как сигнальный индикатор SilverTrend . Точной копией системы ASCTrend не является. Работает на всех инструментах и всех временных диапазонах. Индикатор использует несколько некоррелируемых между собой алгоритмов для класси
FFx Universal Strength Meter PRO is more than a basic strength meter. Instead of limiting the calculation to price, it can be based on any of the 19 integrated strength modes + 9 timeframes. With the FFx USM, you are able to define any period for any combination of timeframes. For example, you can set the dashboard for the last 10 candles for M15-H1-H4… Full flexibility! Very easy to interpret... It gives a great idea about which currency is weak and which is strong, so you can find the best pai
The FFx Universal MTF alerter shows on a single chart all the timeframes (M1 to Monthly) with their own status for the chosen indicator. 9 indicators mode (MACD-RSI-Stochastic-MA-ADX-Ichimoku-Candles-CCI-PSAR). Each can be applied multiple times on the same chart with different settings. Very easy to interpret. Confirm your BUY entries when most of the timeframes are showing green color. And confirm your SELL entries when most of the timeframes are showing red color. 2 Alert Options : input to s
The FFx Watcher PRO is a dashboard displaying on a single chart the current direction of up to 15 standard indicators and up to 21 timeframes. It has 2 different modes: Watcher mode: Multi Indicators User is able to select up to 15 indicators to be displayed User is able to select up to 21 timeframes to be displayed Watcher mode: Multi Pairs User is able to select any number of pairs/symbols User is able to select up to 21 timeframes to be displayed This mode uses one of the standard indicators
FFx Patterns Alerter gives trade suggestions with Entry, Target 1, Target 2 and StopLoss .... for any of the selected patterns (PinBar, Engulfing, InsideBar, OutsideBar) Below are the different options available: Multiple instances can be applied on the same chart to monitor different patterns Entry suggestion - pips to be added over the break for the entry 3 different options to calculate the SL - by pips, by ATR multiplier or at the pattern High/Low 3 different options to calculate the 2 TPs -
MetaTrader 4 version available here : https://www.mql5.com/en/market/product/24881 FFx Basket Scanner is a global tool scanning all pairs and all timeframes over up to five indicators among the 16 available. You will clearly see which currencies to avoid trading and which ones to focus on. Once a currency goes into an extreme zone (e.g. 20/80%), you can trade the whole basket with great confidence. Another way to use it is to look at two currencies (weak vs strong) to find the best single pairs
MetaTrader 4 version available here: https://www.mql5.com/en/market/product/25793 FFx Pivot SR Suite PRO is a complete suite for support and resistance levels. Support and Resistance are the most used levels in all kinds of trading. Can be used to find reversal trend, to set targets and stop, etc. The indicator is fully flexible directly from the chart 4 periods to choose for the calculation: 4Hours, Daily, Weekly and Monthly 4 formulas to choose for the calculation: Classic, Camarilla, Fibonac
プレミアムレベルは、正しい予測の精度が80%を超える独自の指標です。 この指標は、最高のトレーディングスペシャリストによって2か月以上テストされています。 あなたが他のどこにも見つけられない作者の指標! スクリーンショットから、このツールの正確さを自分で確認できます。 1は、1キャンドルの有効期限を持つバイナリーオプションの取引に最適です。 2はすべての通貨ペア、株式、商品、暗号通貨で機能します 手順: 赤い矢印が表示されたらすぐにダウントレードを開き、青い矢印が表示されたら閉じます。青い矢印の後に開くこともできます。 試してテストしてください!推奨設定はデフォルトです! 日足チャートで最高の精度を示します! インディケータは、2600 Pipsの収益性に対して、約10Pipsという非常に小さなマージンを使用します。
ClassicSBA
Umri Azkia Zulkarnaen
this indicator very simple and easy if you understand and agree with setup and rule basic teknical sba you can cek in link : please cek my youtube channel for detail chanel : an for detail info  contact me  basicly setup buy (long) for this indicator is Magenta- blue and green candle or magenta - green  and green candlestik and for setup sell (short) is Black - yellow - and red candle or black - red  and red candlestik
Indicador en base a la pendiente de la linea de precio, dibuja una línea de color cuando sube a base de los precios que previamente has sido procesados o linealizados, y cuando baja la pendiente la linea linealizada toma otro color. En este caso se a considerado 6 lineas de diferentes procesos desde pendientes largas hacia las cortas, observándose que cuando coincidan las pendientes se produce un máximo o mínimo, lo que a simple vista nos permitirá hacer una COMPRA O VENTA.
A scalping indicator based on mathematical patterns, which on average gives signals with relatively small SL, and also occasionally helps to catch big moves in the markets (more information in the video) This indicator has three main types of notifications: The first type warns of a possible/upcoming signal on the next bar The second type indicates the presence of a ready signal to enter the market/open a position The third type is for SL and TP levels - you will be notified every time price re
Индикатор Coefficient Of Determination (COD) представляет собой значение коэффициента детерминации или квадрат коэффициента корреляции между зависимой переменной — ценой и объясняющей переменной — тиковым объемом. Что это дает нам на практике? COD отлично распознает кульминацию трендовых движений, что позволяет подбирать оптимальные точки и ловить развороты рынка. Как использовать индикатор: Наиболее популярная торговая стратегия строится совместно с трендовым индикатором Moving Average (MA), пе
Fibonacci Múltiple 12, utiliza la serie fibonacci plasmado en el indicador fibonacci, aumentadolo 12 veces según su secuencia. El indicador fibonacci normalmente muestra una vez, el presente indicador se mostrara 12 veces empezando el numero que le indique siguiendo la secuencia. Se puede utilizar para ver la tendencia en periodos cortos y largos, de minutos a meses, solo aumentado el numero MULTIPLICA.
フィルタ:
レビューなし
レビューに返信