WhalesTrade Pro Indicator
- インディケータ
- バージョン: 1.3
- アクティベーション: 20

WHALETRADES PRO - Complete Strategy Guide
Understanding Your Trading Arsenal
WhalesTrade Pro is your window into the institutional side of the market. It combines three powerful trading systems into one comprehensive tool that reveals what's really happening beneath price action.
The numbers changing on your chart are not random. Each one tells a specific story about market participants, their conviction, their fear, and their greed. Learning to read these numbers transforms you from a gambler into a strategic trader.
---
The Confluence Score: Your Decision Engine
The big number in your dashboard is your most important metric. It ranges from -100 to +100 and distills six market factors into one actionable number.
Positive numbers mean bullish conditions. Negative numbers mean bearish conditions. The further from zero, the stronger the signal.
Six factors create this score:
Trend looks at two moving averages. When the fast average sits above the slow average and both slope upward, you get bullish points. When they slope downward with the fast below the slow, you get bearish points.
Momentum uses RSI. Above 55 is bullish, below 45 is bearish, and the middle ground is neutral.
MACD measures acceleration. When the histogram is positive and rising, bullish momentum is increasing. When negative and falling, bearish momentum is accelerating.
Strength uses ADX. When ADX exceeds your threshold and the positive directional indicator beats the negative one, the trend is strong and bullish. The opposite signals strong bearish conditions.
Volume compares current volume to recent averages. Above-average volume with rising price confirms bullish action. Above-average volume with falling price confirms bearish action.
Location within the recent range matters. Price in the lower third signals bullish potential because there's room to run up. Price in the upper third signals bearish potential because there's room to fall.
Each factor votes, and the weighted sum becomes your score. Above 60 with 5 or 6 factors agreeing gives you high-conviction setups. Between 45 and 60 requires caution. Below 45 means stay out.
---
Score-Graded Candles: Reading Market Temperature
Every candle now shows the market's conviction level. Silver candles mean the score is near zero - the market is undecided. Green candles mean bullish conviction. Red candles mean bearish conviction.
The color intensity matters. Bright green shows strong bullish conviction. Bright red shows strong bearish conviction. Faded colors show weaker conviction.
Watch transitions between colors. Silver turning green signals momentum shifting upward. Silver turning red signals momentum shifting downward. A sudden bright green candle after a series of red or silver ones means bulls just took control.
Use candle colors to confirm entries. For buys, wait for two consecutive green candles with a score above 60. For sells, wait for two consecutive red candles with a score below -60.
---
The Confluence Trail Line: Your Dynamic Compass
This colored line represents the confluence score plotted in price space. Green means the path of least resistance is up. Red means the path of least resistance is down.
When price sits above a green line, the market is bullish. When price sits below a red line, the market is bearish.
The most powerful signal comes when price crosses the line. Crossing from below a red line to above it signals a bullish regime change. Crossing from above a green line to below it signals a bearish regime change.
Use this line as a trailing stop. For longs, keep your stop just below the line as it rises. For shorts, keep your stop just above the line as it falls.
---
The Whale Liquidity Profile: Seeing Institutional Footprints
The colored bars on your left show exactly where institutional money has been active. Thick bars represent high-volume areas where whales have built positions.
Strong volume bars (intense colors) represent volume above the 97th percentile. These are whale-sized trades that move markets. Weak volume bars (faded colors) represent retail activity.
The Point of Control is the price level with the most volume. Price acts like a magnet around this level. When price approaches the POC, watch for a reaction. A bounce confirms institutional defense of that level. A break through confirms institutional defeat.
The Value Area shows where 70% of trading occurred. Price tends to stay within this range during normal conditions. Breaks above the high suggest strong bullish momentum. Breaks below the low suggest strong bearish momentum.
---
The Delta Heatmap: Tracking the Battle
Each colored square represents net buying or selling at a specific price. Green squares mean buyers won. Red squares mean sellers won. Color intensity shows dominance.
Green squares stacked at support levels show institutional accumulation. These levels often act as support when retested. Red squares stacked at resistance levels show institutional distribution. These levels often act as resistance when retested.
The white numbers show exact net volume. Large positive numbers at support are trustworthy buy signals. Large negative numbers at resistance are trustworthy sell signals.
Watch for divergences between price and delta. Price making new highs with decreasing delta means buyers are losing conviction. Price making new lows with decreasing negative delta means sellers are losing conviction.
---
The Absorption Profile: Catching Whales in Action
Absorption shows where large players are absorbing opposite-side orders. This is how whales enter and exit without moving price against themselves.
Bright absorption at support means a whale absorbed selling pressure at that level. They want price to go up. This is a powerful buy signal.
Bright absorption at resistance means a whale absorbed buying pressure at that level. They want price to go down. This is a powerful sell signal.
Absorption-derived support and resistance levels appear as horizontal zones. When price approaches these zones, expect a reaction. The whale who absorbed orders there will defend their position.
---
Strong Buy and Sell Bubbles: Extreme Signals
These bubbles represent extreme volume and conviction. Four sizes indicate different conviction levels. Larger bubbles mean stronger signals.
A strong buy bubble at support means a whale bought massive volume there. This precedes major upward moves. A strong sell bubble at resistance means a whale sold massive volume there. This precedes major downward moves.
Context matters most. A buy bubble at support is more significant than a buy bubble at resistance. Combine with confluence score for highest probability setups.
---
The Extracted Volume Profile: Yesterday's Battle Map
Three lines show yesterday's volume profile. POC is the point of control. VAH is the value area high. VAL is the value area low.
POC acts as a magnet. Price will test and react to this level. VAH and VAL act as boundaries. Price tends to stay between them.
The open versus POC rectangle shows your daily bias. Price opening above POC with a bullish rectangle means buyers are in control. Price opening below POC with a bearish rectangle means sellers are in control.
When above POC with bullish bias, look for buys on pullbacks to POC. When below POC with bearish bias, look for sells on rallies to POC.
Break above VAH suggests strong upward momentum continues. Break below VAL suggests strong downward momentum continues.
---
The Semafor Levels: Multi-Timeframe Trading
Three sets of arrows represent three timeframe swings. Level one (brown) is fast swings for quick trades. Level two (purple) is medium swings for day trading. Level three (yellow) is major swings for swing trading.
Up arrows mark swing lows where price reversed upward. Down arrows mark swing highs where price reversed downward. Higher levels mean more significant reversals.
When multiple levels align in the same direction, you have a stronger signal. Two levels agreeing is good. Three levels agreeing is excellent. This is when you trade most aggressively.
Mixed levels signal conflict across timeframes. Level one up with level three down suggests a short-term bounce within a longer-term downtrend. Trade the bounce but respect the bigger trend.
---
The ZigZag Lines: Structural Clarity
The red ZigZag line connects significant swing points using the traditional algorithm. The gold ZigZag Fractal line uses five-bar fractals.
Both lines show market structure. Upward sloping lines mean the trend is up. Downward sloping lines mean the trend is down.
A break of the ZigZag line often signals a trend change. Breaking above a previous ZigZag high suggests trend continuation upward. Breaking below a previous ZigZag low suggests trend continuation downward.
Use ZigZag lines to place stops. For longs, place stops just below the most recent ZigZag low. For shorts, place stops just above the most recent ZigZag high.
---
The TP and SL Ladder: Your Complete Trading Plan
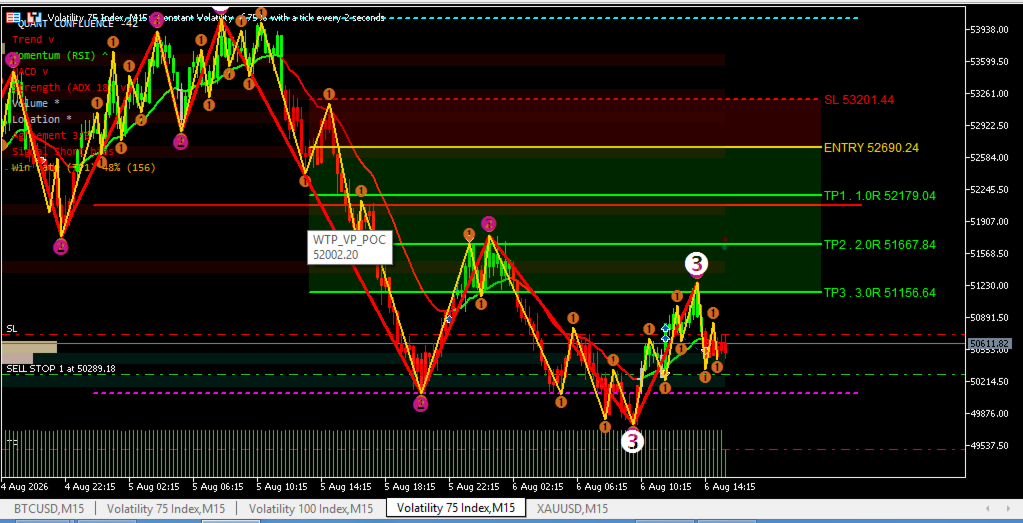
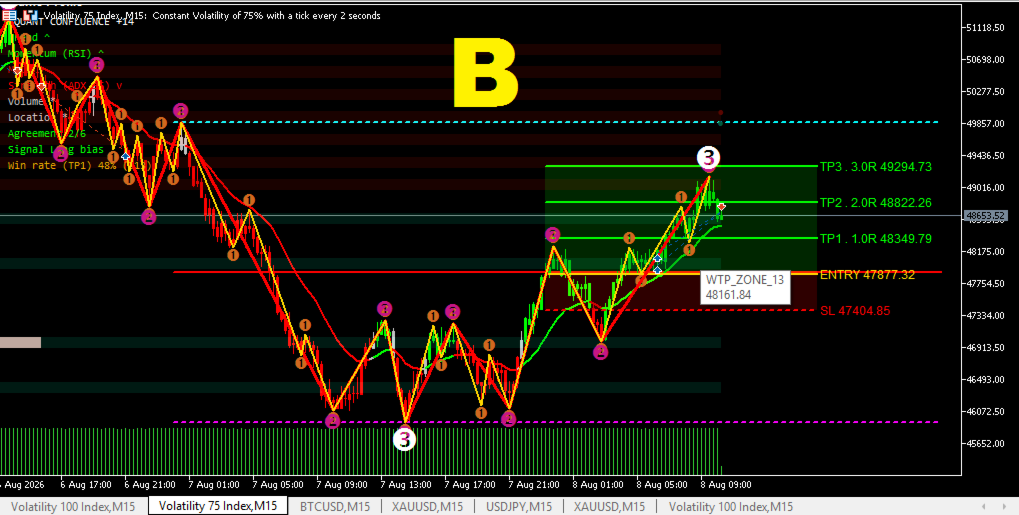
When a signal fires, the indicator draws your entire trading plan. Gold line is your entry. Red line is your stop loss. Green lines TP1, TP2, TP3 are your profit targets.
Stop loss sits at 1.5 times average true range from entry. This automatically adjusts to market volatility. Wider in volatile markets, tighter in calm markets.
TP1 is 1R from entry. Take at least half your position here. This locks in profit and reduces risk. Even if the trade reverses, you've already banked gains.
TP2 is 2R from entry. Take additional profits here. Move your stop to break even if you haven't already.
TP3 is 3R from entry. Take the remainder here. Celebrate a winning trade.
The risk-to-reward ratio is fixed at 1:3. For every dollar risked, you can make three dollars. You can be wrong more often than right and still be profitable.
---
Your Complete Trading Routine
Start each session by checking the extracted volume profile. Where is POC relative to current price? Is the open versus POC rectangle bullish or bearish? This gives you your daily bias.
Check the confluence score. Above 60 with 5-6 factors agreeing confirms your bias. Below 40 with factors mixed means wait.
Watch the whale liquidity profile. Where are the thickest volume bars and strongest absorption zones? These are your key levels.
When price approaches a whale level, watch the delta. Green delta at support means buyers are active. This is your trigger. Red delta at resistance means sellers are active. This is your trigger.
Check Semafor arrows. Are they aligned with your bias? The more levels aligning, the higher your conviction.
Check score-graded candles. Are they transitioning in your direction? The color tells you if the market is still in your favor.
When all components align, enter the trade. Entry is the gold line. Stop loss is the red line. Targets are the green lines.
Take partial profits at TP1. Move stop to break even. Let remainder ride to TP2 and TP3.
Monitor the confluence trail line. As long as price stays on the correct side and the line stays the correct color, your trade is valid. When the line changes color, consider exiting. When price crosses the line, the regime has changed and you should exit.
---
Advanced Profit Techniques
Dynamic Position Sizing: Trade larger when score is above 70 with 6 factors agreeing and all Semafor levels aligned. Trade smaller when score is between 45-60 with only 4 factors agreeing.
Partial Profit Taking: Always take profits at TP1. This reduces stress, locks in gains, and lets you play with house money on the remainder.
Trailing Stops: Trail your stop behind the confluence trail line. This locks in profits while capturing the bulk of the trend.
Re-Entry Opportunities: After taking profits at TP1, watch for pullbacks to the trail line or whale levels. Re-enter to ride the next leg of the trend.
Filter Weak Signals: Between 45-60 score, only trade when you have additional whale profile confirmation. Strong volume, absorption, or delta should be present. If the whale profile is quiet, stay out.
Timing Entries: Don't enter immediately at the signal. Wait for price to pull back to a logical level. For buys, wait for a pullback to support or the trail line. For sells, wait for a rally to resistance or the trail line.
---
Risk Management Rules
Never risk more than 1-2% of your account on any single trade. The stop loss distance multiplied by position size should equal this amount.
Always take partial profits at TP1. This locks in gains and reduces exposure.
Move stop to break even after TP1 is hit. This ensures you can't lose money on the trade.
Set a daily loss limit. If you lose 2-3 trades in a row, stop for the day. The market isn't favoring your strategy at that moment.
Respect the 1:3 risk-to-reward ratio. Never widen your stop or tighten your targets. This destroys your edge.
---
Trading Psychology
The indicator removes guesswork and emotional decisions. When you see a confluence score of 72 with all factors agreeing and three Semafor levels aligned, you're not guessing. You're following a proven signal.
When price hits your stop loss, accept it. The stop was placed at a logical level based on average true range. It was a valid trade that didn't work out. Move on.
When price goes to TP3, take your profits. Don't fight the urge to hold out for more. Consistency leads to profitability. It's not about home runs. It's about consistent singles and doubles.
---
Final Words
WhalesTrade Pro gives you a powerful edge. The whale profile shows where big money is active. The confluence score shows the strength of underlying factors. The Semafor levels show the swing structure. The ZigZag lines show the trend. The trade ladder gives you a complete trading plan.
When all components align, you have a high-probability setup. When they conflict, stay out. The market will always be there. Your job is not to catch every move. Your job is to catch the right moves.
Be patient. Be disciplined. Be consistent. Trade the same way every time. Trust the data. Trust the process. Trust yourself.
The whales are moving markets right now, creating opportunities. WhalesTrade Pro shows you where they're active and what they're doing. All you have to do is follow their lead.