Market Seer VP MT5

Market Seer VP Indicator - A Comprehensive Overview

The Market Seer VP Indicator represents a sophisticated fusion of six distinct trading methodologies, each carefully selected to address different aspects of market analysis. When combined, these components create a holistic trading framework that systematically addresses the three fundamental questions every trader must answer: Where is the market going? When should I enter? Where should I place my stops and targets?

The Smart Money vs Retail Flow Oscillator: Understanding Who Controls the Market

The first component establishes the foundation of your trading edge by revealing the ongoing battle between institutional capital and retail traders. This 0-100 oscillator measures the directional momentum of what we term "smart money" flow versus retail flow, normalized by volume to ensure the readings are consistent across different market conditions. When the Smart Money reading climbs above 70, it signals that institutional participants are actively accumulating positions with conviction. Conversely, readings below 30 indicate aggressive distribution by these same participants.

What makes this oscillator particularly valuable is its re-tiered threshold system. The 70-100 range represents clear bullish conviction, while 0-30 shows clear bearish conviction. The 31-59 range is neutral, and importantly, the 60-69 range is designated as "neutral with bullish bias" - eliminating any gap in interpretation. This means you always have a clear bias reading, never an ambiguous middle ground that leaves you uncertain about what the data is telling you.

The retail counterpart provides the critical context of crowd behavior. When retail flow agrees with smart money direction, it suggests strong momentum that could continue. However, when retail flow disagrees with smart money, it creates a warning signal of potential reversals or traps. This contrarian insight helps you avoid the common retail mistakes of buying at tops and selling at bottoms.

The 3-Level ZZ Semafor: Multiple Timeframe Fractal Structure

This component adds the crucial dimension of market structure, identifying key swing points across three different scales. Level 1 uses true 5-bar fractal detection - the same mathematical definition used in the original MetaTrader Fractals indicator - making it extremely sensitive to immediate price action and ideal for identifying potential reversal points on shorter timeframes.

Level 2 and Level 3 progressively widen their parameter sets, with Level 3 using a depth of 34 bars and deviation of 21 points. This creates a hierarchical structure where each level confirms or contradicts the others. The beauty of this arrangement is that when all three levels align on a swing point, you have a highly significant structural level that is likely to act as strong support or resistance. When levels disagree, you can trade with reduced position size or wait for confirmation.

The visual presentation uses distinct colors and arrow sizes for each level, making it immediately apparent which level has identified a particular swing point. This allows you to prioritize trades that occur at confluence points where multiple levels have detected structure.

The HTF Semafor Dashboard: Forward-Looking Timeframe Context

This component addresses one of the most common trading pitfalls: trading in isolation without understanding the larger timeframe context. The dashboard automatically identifies the next two timeframes above your current chart period and displays their Semafor bias based on the most recently confirmed swing point.

The convention is straightforward - a confirmed swing low on a higher timeframe signals a bullish bias, while a confirmed swing high signals a bearish bias. On a 15-minute chart, for example, you'll see the M30 and H1 biases displayed continuously. This simple visual reference prevents you from taking counter-trend trades that might work on the lower timeframe but are swimming against a stronger current on the higher timeframe.

This is particularly powerful because it uses the same swing detection parameters as the Semafor levels themselves, ensuring consistency across the entire analysis framework. What you see on the dashboard is exactly what you would see if you switched the chart to that timeframe and looked at the corresponding Semafor level.

The Daily Volume Profile: Understanding Where Value Lies

Volume Profile adds the essential dimension of price-volume relationships, showing where actual trading activity has concentrated. The Point of Control (POC) represents the price level with the highest volume on the daily session, functioning as a powerful magnet for price. The Value Area High (VAH) and Value Area Low (VAL) define the range containing 70% of the day's volume, representing the "fair value" zone where most trading occurred.

When price returns to the POC, it often acts as a support or resistance level where institutional traders who accumulated large positions will defend their entries. Trading in the Value Area is statistically favorable, as it represents the price zone where the most market participants agreed on value. Trading outside the Value Area requires caution, as you are moving into less-tested territory where volatility may be higher.

The POC alert system provides real-time notifications when price touches this critical level, allowing you to monitor potential reaction points without having to stare at the chart continuously. The visual display using distinct colors and styles for each level ensures immediate recognition of these zones.

The AMD Model: Session-Based Institutional Order Flow

The Accumulation, Manipulation, Distribution model provides a structured framework for understanding how institutional algorithms operate within the daily cycle. Asian session accumulation sets the initial range, London session manipulation seeks to trigger stops and create liquidity, and New York session distribution executes the directional move.

The adaptive shift feature is particularly sophisticated. When Asian session trades in a narrow range, the standard model applies - Asia accumulates, London manipulates, New York distributes. However, when Asia shows significant expansion, the model intelligently shifts: London becomes the new accumulation phase, and New York handles both manipulation and distribution. This adaptability prevents the model from breaking down in trending conditions.

The protected swing MSS requirement ensures that distribution is only confirmed when price breaks beyond a genuine prior swing point, not just some arbitrary level. This significantly reduces false signals and aligns the model with actual market structure. The displacement and FVG requirements further refine the setup, waiting for genuine momentum rather than reacting to every minor breach.

The entry, stop-loss, and take-profit levels are all generated automatically when the setup triggers. This removes emotion from the trade management process and provides clear, objective parameters. The risk-reward ratio of 3:1 means that even with a relatively modest win rate, the strategy can be profitable over time.

The Trend Nova Filter: Dynamic Trend Detection

This 2-pole trend filter provides an elegant solution to the eternal question of trend direction. Unlike simple moving averages that are always lagging by at least half their length, or complex indicators that are difficult to interpret, the Trend Nova filter smooths price action while remaining responsive to changes in momentum.

The color-change signal fires once and only once when the filter actually shifts between neutral, up, or down states. This produces clean, unambiguous signals that aren't subject to the constant flipping that makes many indicators difficult to trade. When a buy or sell signal appears, you know that the filter has genuinely changed its assessment of the trend.

The trade plan feature provides immediate practical application. When price has already closed beyond the Trend Filter line at the signal bar, the SL and TP levels are drawn automatically, with the stop-loss placed at the filter level itself and the take-profit calculated based on your chosen risk-reward ratio. This makes the Trend Nova component almost an entire trading system in itself.

The Daily Bias Candle: Visualizing the Larger Context

This simple but powerful visual tool projects the daily open, high, low, and close as a large candle on the main chart. This provides immediate visual context for your trading decisions - you can see at a glance whether the daily candle is bullish or bearish, which direction it's trending, and where key levels from the daily session are located relative to current price.

The projection places the candle into empty space to the right of the chart, ensuring it never obscures actual price action. This means you get the benefit of higher timeframe context without any visual clutter on your trading charts. The open price of this daily candle serves as a key reference level, and the color change from bull to bear provides an immediate bias check that you can absorb in a fraction of a second.

The News Filter: Risk Management Integration

The economic calendar integration adds another layer of risk management sophistication. By scanning for major economic events in the currency pair's base and quote currencies, the indicator warns you ahead of high-impact news releases. This prevents you from entering trades just before volatile events that could easily stop you out or reverse your position.

When news is imminent, the AMD entry process can be automatically flagged as risky, and you can choose to suppress alerts during these periods. This integration of fundamental awareness into a technical trading system represents institutional-grade risk management approach typically absent from retail traders' arsenals.

The Volume Dashboard: Real-Time Market Participation Assessment

The real-time volume monitoring provides instant feedback on whether current participation is high, moderate, or low relative to recent history. High volume suggests genuine conviction and strong institutional participation, increasing confidence in signals. Low volume suggests participation is light, which can lead to erratic price movements that are more difficult to trade profitably.

How These Components Work Together Logically

The true power of the Market Seer VP Indicator emerges when you understand how these components interact and reinforce each other. The Smart Money oscillator provides the directional bias context. The Volume Profile shows you where institutional value lies. The AMD model tells you where you are in the daily institutional cycle. The Semafor levels show you the market structure at multiple scales. The Trend Nova filter confirms the intermediate trend direction. The HTF dashboard ensures you don't trade against the higher timeframe flow. The volume dashboard confirms participation levels. The news filter keeps you out of volatile events.

Why This Combination Creates a Path to Profitability

Profitability in trading is not about any one perfect indicator or system, but about systematically reducing the cost of being wrong while maximizing the benefit of being right. This indicator achieves this through:

Self-Correction Through Confluence: When multiple components align - for example, the Smart Money oscillator is bullish, the AMD model is in a bullish distribution phase, the Trend Nova filter shows an up trend, and the HTF dashboard shows a bullish bias - you have high confidence in the trade. When components disagree, you know to reduce position size or wait for alignment. This natural risk management prevents over-commitment during uncertain periods.

Objective Trade Management: The AMD and Trend Nova components generate actual entry, stop-loss, and take-profit levels automatically. This removes one of the most common sources of trading errors: the tendency to move stops and targets based on emotion during a trade.

Multiple Timeframe Awareness: The HTF dashboard ensures you're always aware of the larger context. Trading with the higher timeframe flow increases your probability of success significantly.

Structural Edge: The use of true fractals and protected swing points ensures that the levels identified by the Semafor and AMD components are based on actual market structure, not arbitrary mathematical transformations. This provides a genuine structural edge.

Institutional Perspective: The Smart Money oscillator and AMD model both attempt to see the market from the perspective of institutional participants. This is a crucial shift from the retail tendency to follow price blindly.

Risk Management Integration: The news filter and position sizing implications from the volume dashboard add layers of risk management that most traders ignore until it's too late.

Practical Implementation Approach

The most profitable approach is to use this indicator as a complete workflow rather than cherry-picking individual signals. Start your analysis by noting the Smart Money bias and the HTF dashboard to establish your directional orientation. Then review the AMD model to understand where you are in the daily institutional cycle. Check the Volume Profile to see where current price is relative to the value area. Use the Trend Nova filter to confirm the intermediate trend. Only then, when multiple components agree, should you execute trades with the SL and TP levels provided.

Trading against the combined weight of evidence is possible but should be done with reduced position size and careful risk management. The indicator doesn't force a single interpretation but instead provides a comprehensive view that allows you to make more informed decisions.

The Market Seer VP Indicator doesn't promise to make you profitable overnight, and no indicator can guarantee profits. What it provides is a systematic framework for understanding and acting upon the complexities of market behavior. By combining structural analysis with institutional flow assessment, volume analysis, and trend detection, it addresses the main reasons traders fail - lack of context, poor risk management, and emotional decision-making. When used as intended, this indicator provides the clarity and structure needed to develop a consistently profitable trading approach.
おすすめのプロダクト
Dorado Trend
Dhanesh Kumar Ramachandran Nair Omanakumari
Short description: See the trend at a glance. Blue = buy, red = sell, grey = wait. Free, simple, never repaints. Full description: Trade with the trend, not against it. Many losing trades go against the bigger trend. Dorado Trend checks two things for you, the bigger trend and the current move on your chart, and only colours your candles when both agree. Blue candles: the trend is up. Look for buys only. Red candles: the trend is down. Look for sells only. Grey candles: the market is un
FREE
Adapted to MetaTrader 5 cRSI – Cyclic Smoothed Relative Strength Index indicator from an open-source license This useful open-source indicator is available for you to use completely free of charge. This indicator is an adaptation for the MetaTrader 5 (MQL5) platform of WTT_cRSI.mq5 , originally published in 2017 by WhenToTrade and licensed under the Creative Commons Attribution 4.0 International (CC BY 4.0) license. The original work is based on the dominant cycle principles described in the bo
FREE
Description of the Harmonic Patterns + Fib Indicator The Harmonic Patterns + Fib indicator is a technical analysis tool designed for MetaTrader 5 (MT5). It automatically detects and visualizes harmonic price patterns on financial charts, leveraging Fibonacci ratios to identify potential reversal points in markets such as forex, stocks, cryptocurrencies, and commodities. The indicator scans for classic harmonic formations like Butterfly, Bat, Crab, Shark, Gartley, and ABCD, drawing them with lin
FREE
FVG Concept and Market Structure (MS) Indicator – Comprehensive Analysis with Interactive Control This is not just an indicator. It is a useful tool for market analysis. This indicator combines several analytical functions, making it one of the more complete solutions in its field. This tool represents a comprehensive solution for analyzing market behavior with the goal of forecasting the direction of price movement. The indicator is designed to assist the trader and not distract them with unnec
FREE
LM Session VWAP Bands MT5 LM Session VWAP Bands MT5 is a configurable Volume Weighted Average Price indicator for MetaTrader 5. It plots a VWAP line and optional weighted standard deviation bands directly on the chart. VWAP can reset daily, weekly, monthly, or at the start of a custom session defined in broker server time. VWAP is calculated as: VWAP = Sum(Price x Volume) / Sum(Volume) The indicator can be used as part of your own intraday, session-based, trend, mean-reversion, price-actio
FREE
Gold Levels MTF - this is a fine stock technical indicator. The indicator algorithm analyzes the movement of the asset price, displays price levels of support and resistance from all time frames (TF) using the Murray method based on the Gann theory. The indicator indicates overbought and oversold fields, giving an idea of possible reversal points and at the same time giving some idea of the strength of the current trend. Description of levels: (Extreme Overshoot) - these levels are the ultimate
FREE
Just learning how to create an indicator from this tutorial . its just a garbage text to fill the descriptions. Hello there. Hello there Hello there Hello there Hello there Hello there Hello there Hello there Hello there Hello there Hello there Hello there Hello there Hello there Hello there Hello there Hello there Hello there Hello there Hello there Hello there
FREE
HIQImpulse
Luis Fabricio Salinas
HIQImpulse applies Alexander Elder's Impulse System to every candle on the chart, so trend and momentum can be read together at a glance. How it works The Impulse System combines two readings on each candle: Trend: a 13-period exponential moving average of the close. It is rising when it is higher than on the previous candle, and falling when it is lower. Momentum: the MACD histogram (MACD main line minus its signal line, 12/26/9). It is rising when it is higher than on the previous candle, and
FREE
Features: Clear Buy/Sell labels with directional arrows. Automatic Take Profit (TP) & Stop Loss (SL) labels for better risk management. Easy-to-read chart signals (no messy lines). Works on any timeframe and any asset (Forex, Gold, Indices, Crypto, Stocks). Compatible with MetaTrader 5 (MT5 desktop & mobile sync) . Perfect for: Beginner traders who need straightforward signals. Experienced traders who want an extra confirmation tool. Anyone looking to simplify their chart without clutter.
Harmonic Confluence Indicator (Basic Edition) Automatic harmonic pattern scanner with supply and demand confluence. Harmonic Confluence Basic is a free harmonic pattern indicator for MetaTrader 5. The indicator finds and draws five classic harmonic structures on any symbol and timeframe. WHAT THE INDICATOR DOES - Scans price swings and detects five core harmonic patterns: Gartley, Bat,   Butterfly, Crab and Shark. - Draws the full X-A-B-C-D structure of each pattern directly on the chart. - M
FREE
Gaussian Envelope   is an innovative technical indicator that uses Gaussian-weighted moving average to create dynamic price channels. Unlike traditional volatility indicators (Bollinger Bands, Keltner Channels), Gaussian Envelope provides smoother and more accurate price tracking through the use of the bell-shaped Gaussian function. The indicator is particularly effective in trending markets and for identifying reversal points, providing traders with clear entry and exit signals. Key Features
FREE
OmniSignal Navigator - Smart Entries at Key Levels Trade Like a Professional with this daily/weekly High-Low-Close indicator, designed for scalping or intraday short term trading and precision breakout trading. Suggested Timeframes to trade with: M 5 DO NOT USE THE INDICATOR ON THE M1 TIMEFRAME! Why It Works Perfect for Scalping/Intraday: Targets key zones (PDH/PDL/PDC & PWH/PWL/PWC) on M2, M3, M5, M15 timeframes. (Lower Timeframes = More Signals, Higher Timeframes = Less Signals) No Chart Anal
FREE
HTF Filtered Momentum Band is a trend indicator with three layers that each answer one question. The background says which way the H4 trend points. The band says whether momentum on your own chart agrees. The arrows say when a short-term trend has just turned. And out of the box, the arrows stay quiet whenever they disagree with H4. That last part is why it exists. Most multi-timeframe tools paint the higher timeframe's colour on your chart and then print arrows that ignore it completely. So you
Introduction This indicator detects volume spread patterns for buy and sell opportunity. The patterns include demand and supply patterns. You might use each pattern for trading. However, these patterns are best used to detect the demand zone (=accumulation area) and supply zone (=distribution area). Demand pattern indicates generally potential buying opportunity. Supply pattern indicates generally potential selling opportunity. These are the underlying patterns rather than direct price action. T
FREE
Breakout Boxes with Volume Pressure This indicator automates the identification of key consolidation zones (Supply and Demand) based on Market Pivots and Volatility (ATR). Unlike standard support/resistance tools, this indicator provides a unique   Volume Pressure Analysis   inside every box, giving you insight into the battle between Buyers and Sellers before a breakout occurs. Key Features Automated Supply & Demand Zones:   Automatically detects significant Pivot Highs and Lows to draw dyna
Dual Scale Candles
Mohamed Amr Mohamed Osama Abdelwahab
Dual Scale Candles は、2つ目のシンボルの実際のローソク足をチャート上に直接重ねて表示し、左軸に独立した価格スケールを表示します。 ゴールド対通貨、原油対指数など、任意の2つの銘柄を1つのチャートで比較できます。それぞれが実際の価格を保持します。2つの系列は選択したポイント(チャートに表示される当日最初のバー、週最初のバー、または最も古い表示バー)で整列され、アンカーバーで両系列が同一レベルに交差し、垂直の破線で示されます。その地点から各銘柄はそれぞれの価格で動くため、相対パフォーマンスが一目で分かります。 機能: - チャートのシンボル上に任意の第2シンボルの実ローソク足を表示 - 第2シンボルは左軸に独自の価格スケールを保持 - 整列アンカー:日の開始、週の開始、最古バー、レンジフィット - アンカーバーに垂直破線を表示 - 重ね合わせの高さ、バー数、ローソク足・ヒゲの色を調整可能 - 現在バーのリアルタイム更新 設定:インジケーターを任意のチャートに適用し(それが第1シンボル)、パラメータに第2シンボルをブローカーの気配値表示とまったく同じ名前で入力してく
FREE
八本のドンチャンチャネルを、正直な一つの数値にまとめました。価格がそれらの中央線のいくつより上にあるか、から、いくつより下にあるかを引いた値です。Donchian Trend Ribbon MTFはこの符号付きの点数をバッファとして公開し、多数派が変わったときに側を変え、点数が築かれている水準が見えるよう最も遅いチャネルを描きます。どのチャートでも任意の上位時間軸で、読むのは確定した上位足だけです。無料です。試用期間なし、機能制限なし、上位版への誘導なし。 窓を伸ばしながらドンチャンチャネルの組を作ります。基準の長さと、その倍数です。リボンの点数は、価格が中央線のいくつより上にあるかから、いくつより下にあるかを引いた値で、帯の本数のマイナスからプラスまでの整数になります。シグナルは多数派の交代、つまり点数がゼロを横切ることです。 原典はこれを縞の帯として描きます。ここでは点数を代わりに数値として公開し、ボードの各セルに等級を付けるのはその数値です。情報は多数派の大きさであり、縞はそれを見せる一つの方法にすぎなかったからです。描画の違いは算術を何も変えません。 チャートに表示されるもの
FREE
ZIGZAG and FRACTAL CANDLE PRO ( Only candles, No RSI strength panel) " Suitable for QQE RITZ " > Check My Product is an advanced market structure visualization system built for precision trend detection, powered by dynamic fractal logic and adaptive swing validation. It seamlessly identifies Higher Highs (HH), Lower Lows (LL), and key structural shifts — allowing traders to read the true rhythm of market transitions with institutional clarity. This system combines   ZigZag precision ,   fractal
FREE
Necessary for traders: tools and indicators Waves automatically calculate indicators, channel trend trading Perfect trend-wave automatic calculation channel calculation , MT4 Perfect trend-wave automatic calculation channel calculation , MT5 Local Trading copying Easy And Fast Copy , MT4 Easy And Fast Copy , MT5 Local Trading copying For DEMO Easy And Fast Copy , MT4 DEMO Easy And Fast Copy , MT5 DEMO Can set the cycle for other varieties of K line graph covered this window, fluctuations obser
FREE
GDXM Session Open Line PO3
Gustavo Barros Alexandre D Almeida
5 (1)
This indicator is a specialized utility for traders following the ICT (Inner Circle Trader) methodology, specifically focusing on the Power of Three (PO3) concept: Accumulation, Manipulation, and Distribution. The ICT PO3 Open Line automatically identifies and plots critical opening prices from specific market sessions, allowing you to visualize price action relative to the "True Open" of the day or specific sessions. Key Features 1. Daily PO3 Open Levels The indicator tracks and draws horizonta
FREE
Best SAR MT5
Ashkan Hazegh Nikrou
4.33 (3)
説明 :  外国為替市場(PSAR)で専門的で人気のあるインジケーターの1つに基づいた新しい無料インジケーターをご紹介します。このインジケーターは元のパラボリックSARインジケーターの新しい変更です。プロSARインジケーターでは、ドットと価格チャートのクロスオーバーを見ることができます。クロスオーバーはシグナルではありませんが、動きの終わりの可能性について話します。新しい青いドットで購入を開始し、最初の青いドットの1 atr前にストップロスを配置し、最後にドットが価格チャートを横切るとすぐに終了できます。 売買シグナルを開く方法は? 最初の青い点によるオープンバイトレードと最初の赤いドットによるオープンセルトレード 正しいストップロスはどこにありますか? 安全なストップロスは最初のドットにある可能性があります(最初の青いドットの買いの場合と最初の赤い点の売りの場合) 正しいテイクプロフィットはどこにありますか? テイクプロフィットはストップロス距離とRRに基づいて調整できるので、私の提案は2 RRで、ストップロスの2倍です。 利益を上げているのにtpを達成できなかった場合
FREE
Necessary for traders: tools and indicators Waves automatically calculate indicators, channel trend trading Perfect trend-wave automatic calculation channel calculation , MT4 Perfect trend-wave automatic calculation channel calculation , MT5 Local Trading copying Easy And Fast Copy , MT4 Easy And Fast Copy , MT5 Local Trading copying For DEMO Easy And Fast Copy , MT4 DEMO Easy And Fast Copy , MT5 DEMO 高度なボリンジャーバンド: 1.ボリンジャーレールは方向によって色が変わります」 2.ボリンジャーアウターレールの伸縮はアウターレールの色の変化でマークされます。」 3.ボリンジャーミ
FREE
LRC Pro
Fazliddin Yuldoshev
LRC Pro with Alerts Overview LRC Pro replaces standard candlesticks with Linear Regression smoothed candles , eliminating market noise and making trend direction instantly clear. A signal line (SMA or EMA) is overlaid directly on the smoothed candles, giving you clean, actionable entries and exits without cluttering your chart. Unlike standard candles that react to every tick, LRC Pro show you where price is actually trending — making it far easier to stay on the right side of the market. How It
FREE
Smart Finder Order Block The Ritz Smart Finder Order Block is a next-generation market structure recognition tool, designed to intelligently detect and highlight institutional footprints within price action. Built on a dynamic blend of order block theory, consolidation tracking, and adaptive volatility modeling, it provides traders with a sophisticated lens to anticipate high-probability market reactions. Core Capabilities Smart Order Block Detection Identifies both Bullish and Bearish Order Blo
FREE
LT Volume
Thiago Duarte
4.73 (15)
LT Volume は、MetaTrader 5 向けの従来型ボリュームインジケーターを自然に進化させたものです。よりスマートでダイナミックなフロー分析を提供するために設計されており、従来の限定的なバー表示を大きく超えて、機関投資家レベルの相場分析を強化する強力な機能セットを備えています。 流動性の追跡や、相場の消耗ポイント、またはブレイクアウトの検出に最適で、チャート上での視覚的な操作性をよりスムーズにします。 主な機能 柔軟なボリューム: ティックボリューム、またはブローカーが提供している場合は実際の市場出来高の読み取りに対応。 統合移動平均: ボリュームヒストグラム上に直接適用される、完全にカスタマイズ可能な移動平均により、方向性のあるフローを追跡できます。 固定レベル: 固定のアラートレベルを設定すると、インジケーターが警告ラインを描画します。高頻度戦略や大口プレイヤーの検出に最適です。 最大限の最適化: LT Volume のコードは軽量かつ非常に高性能で、リアルタイム市場のスピードに関係なく、ターミナルを滑らかに動作させます。 多言語対応: イン
FREE
Sniper ZZ — Precision Entry. Clean Signals. Sniper ZZ is a lightweight MetaTrader 5 indicator that automatically draws Fibonacci retracement levels 0.382 and 0.618 from confirmed ZigZag swings. No more manual Fibonacci drawing — every time a new swing is confirmed, Sniper ZZ instantly calculates and displays the exact 0.382 and 0.618 retracement levels with price labels. WHAT MAKES SNIPER ZZ DIFFERENT? Most Fibonacci indicators alert you on EVERY touch — flooding you with false signals. Snip
FREE
Канал фрактальной дивергенции базируется на   паттернах фрактальной дивергенции , представляя их в виде канала, границы которого изменяются в момент появления очередного паттерна. Верхняя граница канала соответствует верхней части последнего найденного медвежьего паттерна фрактальной дивергенции. Нижняя граница канала - это нижняя часть последнего найденного бычьего паттерна (см. скриншот 1). По отношению к индикатору   FractalDivergence_Patterns , канальная версия обладает теми же параметрами,
FREE
Overview The OBV Oscillator is a custom technical indicator for MetaTrader 5, designed to provide a clearer visualization of On Balance Volume (OBV) by transforming it into an oscillator. This indicator aims to assist traders in identifying trend confirmations, potential reversals, and momentum shifts by analyzing the relationship between price and volume. It features a customizable Moving Average (MA) for smoothing the OBV, a signal line for generating crossover signals, and an alert system to
FREE
QQE Mod Professional
Daniel Ortega Clemente
5 (1)
This indicator implements the QQE (Qualitative Quantitative Estimation) algorithm for MetaTrader 5, incorporating volatility bands logic. The indicator combines the Relative Strength Index (RSI) with Average True Range (ATR) to determine market direction. The histogram changes color based on the interaction between the RSI momentum and the calculated volatility channel. Technical Logic: The algorithm smoothes the RSI values and constructs upper and lower bands. When the smoothed RSI breaks these
FREE
HA Signal MultiFilter MT5 - Technical Operational Manual & Architecture Guide 1. SYSTEM OVERVIEW & ARCHITECTURAL FOUNDATION HA Signal MultiFilter MT5 is a specialized analytical indicator developed for MetaTrader 5 terminal to identify directional momentum expansions and structural trend continuations[cite: 2]. By synthesizing smoothed Heiken Ashi candlestick price discovery with a modular 15-layer secondary confirmation filter suite, the system extracts high-probability market shifts while fil
FREE
このプロダクトを購入した人は以下も購入しています
Trend Sniper X
Sarvarbek Abduvoxobov
4.86 (44)
Trend Sniper X は、トレードの方向性と潜在的な反転ポイントを明確かつ正確に特定するのに役立つ、MetaTrader 5 用のマルチタイムフレーム・トレンドフォロー指標です。 MT4用: https://www.mql5.com/en/market/product/193245 価格情報: 現在の価格はプロモーション価格であり、今後のアップデートや新機能のリリースに伴い変更される場合があります。 ボーナス特典: このインジケーター用の無料自動売買アシスタントEAを入手するには、購入後に an 著者(開発者)へメッセージをお送りください。 Code2Profit チャンネル マルチタイムフレーム分析で相場をマスターしよう! Trend Sniper X で勝率を最大化する方法:重要なルールとセッションのコツ 技術仕様 プラットフォーム MetaTrader 5 インジケータータイプ マルチタイムフレーム・トレンドインジケーター 操作タイムフレーム あらゆるチャートタイムフレームに対応。個別に選択可能な上位タイムフレーム (M1–MN1) を搭載 主要銘柄 FX、ゴールド (X
新たな王者が登場 - インジケーター + 注文管理表示(TP1 + TP2 + TP3)+ オプションのTelegramシグナル送信機能付き(無料) (完全なトレード&シグナルシステム) ゴールド向け最高のEA: Gold Slayer このインジケーターには、高度な戦略、カスタマイズ可能な注文管理システム、そしてエンベロープ拡張を組み合わせた平均回帰システムが搭載されています。さらに、RSIなど複数のインテリジェントな確認フィルターによって、高確率の反転エントリーをBUY・SELLシグナルとして検出します。 単にトレードを学ぶだけでなく、複数ポジションを効果的に管理し、過去に利益を出しているオープンポジションで損失トレードをカバーする方法も学べます。 M5向けに構築・最適化されており、流動性が高くシグナルの精度が安定しているBTCUSDとXAUUSDで優れたパフォーマンスを発揮します。 このインジケーターは、ATRを基に自動計算されたエントリー、ストップロス、テイクプロフィットレベルを備えた明確なLong・Shortシグナルを提供するため、リスク管理が最初から組み込まれています。 マ
Smart Trend Trading System — MetaTrader 5 ご購入後、MQL5で私にメッセージをお送りいただくと、Smart Universal Expert Advisorを無料で受け取れるほか、オンライン講座、PDFマニュアル、非公開グループへのアクセスもご利用いただけます。 STTSは、トレンドの方向、エントリー・決済シグナル、反転ゾーン、重要な価格水準をチャート上にまとめて表示します。システムを参考に手動で取引することも、別の対応EAを接続し、ご自身で選んだ設定に基づいて自動売買することもできます。 ひとつのシステム、4つのトレードアプローチ STTSのトレードアプローチは、大きく4つのカテゴリーに分かれています。 • スキャルピング — 短期的なシグナルや相場の動きを捉えます。 • トレンドトレード — 方向性を評価し、トレンド内の機会を探します。 • 反転トレード — 反転の可能性があるゾーンや方向の変化を見つけます。 • 出来高トレード — 出来高に基づく情報を使い、市場の活発さを評価します。 エントリー・決済の矢印、トレンド情報、サポート・
Zoryk Gold
Reda El Koutbane
4.79 (19)
割引は 24 時間後に終了します — 次の価格は$ 69 ZORYK — MetaTrader 5専用 XAUUSDシグナル・トレードプランニングシステム このような経験はありませんか。 ゴールドを分析し、エントリーを待ち、ようやくポジションを持った直後に価格が逆方向へ動く。 早すぎる決済をしてしまったり、Stop Lossを動かしたり、数秒迷っている間にチャンスを逃したりする。 その後、相場は自分が最初に予想していた方向へ進み、目標へ到達する。 問題は常に方向判断ではありません。 本当の問題は、明確な計画がなかったことです。 どこでエントリーすべきか。 どこでトレードの前提が無効になるのか。 近い利益を確保すべきか、より大きな値動きを待つべきか。 現在のsetupが本当に強いのか、それとも無理にトレードを探しているだけなのか。 ゴールドは非常に速く動きます。 正しい分析でも、明確なプランがなければ数秒で悪い判断に変わることがあります。 ZORYKは、その問題を解決するために開発されました。 ZORYKとは ZORYKは、MetaTrader 5とXAU
あなたのトレード優位性を視界に入れよう! M5 Sniper は MeanFX による新しいインジケーターです。 正確なトレードシグナル と 適応型TP/SLレベル を組み合わせることで、結果として可能な限り最高の統計的トレードを実現します! 5回購入されるごとに価格が上昇し、次の価格は69$です 購入後に私にメッセージを送っていただければ、ヒント/ガイドとボーナスEAをお受け取りいただけます 何が他と違うのでしょうか? Gold XAUUSDにおける 実証済みの統計的パフォーマンス ( ほぼすべてのアセットで機能します 。一貫した結果が得られないまま何でも扱おうとするのではなく、1つの時間足をマスターすることに重点を置いています) 1日あたり1~8回のトレード を各シンボルで実行し、高い勝率と、すべての統計的優位性をこちら側に持つことができます チャート上には 確認済みの BUYおよびSELLシグナルのみを表示 適応型TPおよびSLレベル を各トレードごとにインジケーターが生成 平均Winrate 75%+ 平均 Signal Ratio 最低1.1+ アラーム と通知を 携帯電話
Entry Points Proは、注文を出す前に、どこでエントリーし、どこにストップを置き、どのロットで取引するかを示します。 価格 現在 199 USD、この価格での販売は 8 本です。その後は 249 USD、最終価格は 349 USD です。 私は相場のトレードで収入を得ており、それを公開しています。だから、このインジケーターを誰にでも売る必要はありません。自分の頭で考えるトレーダーのためのツールであり、魔法のボタンではありません。 ブレイクがなければ取引もありません。グレーの矢印はキャンセルされたシグナルです。価格がシグナル足をブレイクしなかったため、エントリーも損失もありません。 矢印はローソク足の確定時に表示され、リペイントしません。設定は2つ:あなたの資金と1回のトレードあたりのリスクです。 お支払い前にご確認ください:無料デモはMT5のストラテジーテスターで動作し、2分で済みます。ご購入後は、私が個人的に設定をお手伝いします。 2019年、私はこのインジケーターの実力を世界中に示しました。そのシグナルに従って手動で、リアル口座で、公開の場でトレードしたのです。口座は
ULTRAは、「オールインワン」方式で機能するテクニカル指標です。市場を独自に分析し、売買シグナルを生成し、ストップロス注文を設定するための水準を表示し、利益を確定したり損失を最小限に抑えたりするためにポジションを決済すべきタイミングを提案します。 つまり、市場の分析方法や、水準(ストップロスをどこに設定すべきか)の見極め方がわからなくても、あるいは資金管理に苦労していても問題ありません。ULTRAがすべて代行してくれます! 購入者限定特典 :「ULTRA」インジケーターをご購入後、私にプライベートメッセージをお送りいただければ、「ULTRA BOT」を無料プレゼントとしてお受け取りいただけます。これは、このインジケーターからのシグナルに基づいて、オープンしたトレードを管理するのに役立つ特別なツールです(各トレードにストップロスを設定し、最適な結果が得られるよう、戦略のルールに従って自動的にトレードを決済します)。  また、インジケーターを最大限に活用できるよう、さまざまな資産向けの既成の設定も購入者の皆様に提供しています。これらの「超お得な特典」を無料で入手するには、私へダイレクトメ
Gann Made Easy   は、ミスター・ギャンの理論を使用した取引の最良の原則に基づいた、プロフェッショナルで使いやすい外国為替取引システムです。 W・D・ガン。このインジケーターは、ストップロスとテイクプロフィットレベルを含む正確な買いと売りのシグナルを提供します。 PUSH通知を利用して外出先でも取引可能です。 ご購入後、取引方法の説明と優れた追加インジケーターを無料で入手するには、私にご連絡ください! おそらく、ギャンの取引手法についてはすでに何度も聞いたことがあるでしょう。通常、ギャンの理論は初心者のトレーダーだけでなく、すでにある程度の取引経験がある人にとっても非常に複雑なものです。なぜなら、ギャンの取引手法は理論的にはそれほど簡単に適用できるものではないからです。私はその知識を磨き、最良の原則を私の外国為替インジケーターに組み込むために数年を費やしました。 このインジケーターは非常に簡単に適用できます。必要なのは、それをチャートに添付し、簡単な取引推奨事項に従うだけです。このインジケーターは常に市場分析の仕事を行い、取引の機会を探します。適切なエントリーポイントを検
SuperScalp Pro
Van Minh Nguyen
4.54 (37)
SuperScalp Pro - Professional Multi-Layer Confluence Scalping System SuperScalp Proは、複数の高度な確認フィルターを追加することで、従来のSupertrendを強化したスキャルピング向けインジケーターです。誤ったシグナルを大幅に減らしながら、成功する可能性がより高いBuy/Sellの取引機会を見つけるのに役立ちます。 BuyとSellの矢印がチャート上に明確に表示され、ATRに基づくStop LossとTake Profitのレベルもリアルタイムで自動計算されます。 ご購入後、MQL5で私にメッセージを送っていただくと、SuperScalp Pro Auto Trader EAを無料で受け取れるほか、ユーザーガイドとプライベートグループへのアクセスもご利用いただけます。 推奨設定ファイルをダウンロード: [Set File] 詳細なドキュメントは製品ブログでご覧いただけます: [User Guide] 最新情報を受け取るには公式チャンネルにご参加ください: [Official Channel] Sup
GoldenX Entry MT5
VividMind Digital Solutions
5 (17)
GoldenX Entryは、MT5向けのインジケーターであり、適応型Smart Entry Trendアルゴリズム、シグナルスコアリングシステム、マーケットレジーム検出機能、およびボラティリティフィルターを備えています。各シグナルには、計算されたエントリーレベル、3つのテイクプロフィット(TP1、TP2、TP3)、およびストップロスレベルが含まれます。本インジケーターは、異なる市場環境に適応するために設計された複数の分析レイヤー上に構築されており、マルチレイヤー分析システムと内蔵オプティマイザーおよび統計トラッキングシステムを組み合わせています。リスク・リワード(RR)指標および過去のトレード履歴に基づく定量分析を提供します。 使い始めは簡単です — 選択した時間足でオプティマイザーを実行し、そのままチャート上でインジケーターを使用します。 コア機能 GoldenX Entryは、シグナルエンジンとトレード管理機能、そして過去統計トラッキングを1つのチャートに統合しています: - 内蔵オプティマイザー: オプティマイザーはチャート上でワンクリックで実行できます。200通りのパラメー
Gold Trend Coach MT5
Cristhian Alexander Gaibor Cuasquer
4.27 (11)
MetaTrader 5 向け、ゴールド(XAUUSD)のリペイントしない売買シグナル。すべてのシグナルに損切りラインと3つの利確ラインが付きます。BOS と CHoCH を使った Smart Money Concepts フィルターで、相場の構造に逆らわず、構造に沿ってトレードできます。パネル上のライブ・メンターが、エントリーから TP3 まで一歩ずつナビゲート。アラートはスマホとあなた自身の Telegram チャンネルに直接届きます。それが Gold Trend Coach。もう一人でトレードすることはありません。 ご購入特典・無料の購入者キット: 1. Telegram Alert Bridge: シグナルをあなた自身の Telegram チャンネルへ。チャートのスクリーンショットと日次レポート付き。 2. ユーザーマニュアルと設定ガイド。 受け取り方: キットはダウンロードファイルには含まれていません。購入後に MQL5 のメッセージでご連絡ください。当日中にお送りします。 $39 と $45 のローンチ価格分は完売しました。現在は次の10本まで $59、その後は $79
SMC Intraday Formula
VividMind Digital Solutions
5 (26)
まず正直に言いましょう。 どんなインジケーターも、それ単体であなたを利益化させることはできません。もしそう言う人がいるなら、それは夢を売っているだけです。完璧な売買シグナル(矢印)を表示するインジケーターは、いくらでも“完璧に見せる”ことができます。正しい過去の区間を拡大して、勝ちトレードだけを切り取ればいいだけです。私たちはそれをしません。 SMC Intraday Formula はツールです。 市場構造を読み取り、最も高い確率の価格ゾーンを特定し、今この瞬間のスマートマネーの痕跡をシンプルな言葉で正確に示します。最終判断はあなたが行います。トレードを実行するのもあなたです。しかし今は「希望」ではなく「精度」でエントリーできます。 私たちはこのインジケーターを、ゴールド(XAUUSD)および主要FX通貨ペアで約3年間、日々のスキャルピングに使用してきました。M1、M5、M15、M30の主要ツールです。これは未来を予測しようとするのではなく、今まさに形成されている高確率セットアップを示し、その理由を説明します。 他のすべてのインジケーターと何が違うのか? ほとんどのトレーディングイ
Boba Analysis Suite
Trade Ready Solutions LLC
5 (2)
Boba Analysis Suite Boba Analysis Suite は、MetaTrader 5 向けの分析インジケーターです。市場構造、重要な価格帯、相場全体の状況を、一つのチャート画面にまとめて表示します。 トレーダーおよびトレーディング指導者としての実務経験をもとに開発され、市場の方向性の評価、重要な価格水準の特定、複数の時間足を組み合わせた分析など、体系的な分析プロセスを支援します。 相場の背景を踏まえた分析 個々のシグナルの意味は、相場の状況によって変わります。Boba Analysis Suite は、現在のチャート状況をより大きな市場構造と関連付け、あらかじめ定めたルールに沿って取引アイデアを検討するための分析を支援します。 主な分析機能: トレンドと市場構造: 市場の方向性と、その背景にある構造を評価します。 重要な価格帯と価格水準: さらに分析すべき重要な領域を視覚的に表示します。 複数の時間足: 異なる時間足の情報を組み合わせ、相場全体の状況を評価します。 視覚的な分析プロセス: 分析情報をチャート上で直接確認できます。 自主的な取引判断を支援 Boba
Gold Entry Sniper – ゴールドスキャルピング&スイングトレード用プロフェッショナル多時間足ATRダッシュボード Gold Entry Sniper は、XAUUSDや他の銘柄向けに正確な 売買シグナル を提供する、MetaTrader 5用の高度なインジケーターです。 ATRトレーリングストップロジック と 多時間足分析ダッシュボード を搭載し、スキャルピングからスイングトレードまで対応します。 主な特徴と利点 多時間足シグナル分析 – M1、M5、M15 のトレンドを同時表示。 ATRベースのトレーリングストップ – ボラティリティに応じて動的に調整。 プロ仕様のチャートダッシュボード – シグナル状況、ATRレベル、回帰線、売買方向を表示。 明確な売買マーカー – 自動矢印とテキストラベル。 エグジットアラートとトレード管理 – 利益確定のための自動検出。 完全カスタマイズ可能 – パネル位置、色、フォント、ATR/回帰設定を調整可能。 ゴールド(XAUUSD)に最適化 – M1〜M15のスキャルピングに最適、FXや指数、暗号資産にも対応。 Gold Entry
次回アップデート — バージョン 2.52 近日公開!【新機能】 市場分析とトレードワークフローを強化する、4つの主要な新機能にご期待ください 皆様のトレードニーズに応える4つの新機能により、市場分析を次のレベルへと引き上げます。新機能をご紹介します: 1. TRADE OVERVIEW DASHBOARD 2. CONFLUENCE AT ZONE 3. STRONG & WEAK HIGH/LOW 4. OTE 1. TRADE OVERVIEW DASHBOARD 市場全体の状況をより簡単に把握できるダッシュボードです。トレード判断をサポートするガイダンスを提供し、市場分析とトレード計画を体系的に行えるよう支援します。すべてを1つの画面で確認できます。 マルチタイムフレーム市場概要(Multi-Timeframe Market Overview) 市場の方向性と価格構造をより明確に把握 市場状況をすばやく確認 体系的な市場分析とエントリー計画のためのガイダンス 2. CONFLUENCE AT ZONE 価格が重要なゾーンに入るとき…いくつのサポート要因が一致しているかを確認で
FX Power: 通貨の強弱を分析して、より賢い取引を実現 概要 FX Power は主要通貨と金の実際の強弱をあらゆる市場状況で理解するための必須ツールです。強い通貨を買い、弱い通貨を売ることで、 FX Power は取引の意思決定を簡素化し、高い確率の取引機会を見出します。トレンドを追従する場合でも、極端なデルタ値を使用して反転を予測する場合でも、このツールはあなたの取引スタイルに完全に適応します。ただ取引するだけではなく、 FX Power で賢く取引をしましょう。 1. なぜ FX Power がトレーダーにとって非常に有益なのか 通貨と金のリアルタイム強弱分析 • FX Power は主要通貨と金の相対的な強弱を計算し、マーケットダイナミクスに関する明確な洞察を提供します。 • どの資産がリードしているか、または後れを取っているかを監視して、取引するペアを賢く選びましょう。 マルチタイムフレームの包括的なビュー • 短期、中期、長期のタイムフレームで通貨と金の強弱を追跡し、マーケットトレンドに基づいて取引戦略を調整できます。 • スキャルピングからスイングトレード
M1 SNIPER は使いやすいトレーディングインジケーターシステムです。M1時間足向けに設計された矢印インジケーターです。M1時間足でのスキャルピングのためのスタンドアロンシステムとして、また既存のトレーディングシステムの一部としても使用できます。このトレーディングシステムはM1時間足での取引に特化して設計されていますが、他の時間足でも使用できます。元々、この手法はXAUUSDとBTCUSDの取引用に設計しましたが、他の市場においても役立つと考えています。 インジケーターのシグナルは、トレンドの方向と逆方向に取引できます。インジケーターのシグナルを利用して両方向に取引するのに役立つ特別な取引テクニックをご紹介します。この手法は、特別な動的なサポートとレジスタンスの価格帯を利用することに基づいています。 ご購入後、M1 SNIPER矢印インジケーターをすぐにダウンロードできます。さらに、M1 SNIPERツールのすべてのユーザーに、以下のスクリーンショットに表示されているApollo Dynamic SRインジケーターを無料で提供しています。この2つのインジケーターを組み合わせることで
FiboSniper Pro – Multi-Filter Fibonacci System with Auto SL/TP and Control Panel FiboSniper Proは、動的なFibonacci Envelopesと複数の確認フィルターを組み合わせ、選別されたBuyおよびSellシグナルを生成するテクニカルインジケーターです。FibonacciレベルはMoving AverageとATRを基に計算され、その後ADX、EMA、RSI、ATR、Volume、Time、Candle構造によってフィルタリングされます。インジケーターは、ATRに基づく自動Stop LossおよびTake Profitレベルをチャート上に直接表示し、さらに迅速な調整が可能なインタラクティブControl Panelを提供します。 ご購入後、MQL5で私にメッセージを送っていただくと、Auto Trader Xを無料で受け取れるほか、このインジケーターの取引シグナルを自動化する方法についての説明もご利用いただけます。 User GuideとSet Files: [Click here] 完全
Auto Optimized SpeedAngle は、継続的なウォークフォワード最適化(WFO:Walk-Forward Optimization)によりカーブフィッティング(過剰最適化)を排除した、機関投資家レベルのモメンタムベクトルシステムです。市場レジームの変化時に効果が低下する静的な入力に依存せず、アウトオブサンプル(OOS)検証を用いてパラメーターを動的に再キャリブレーションすることで、表示されるシグナルが単なる過去の偶然ではなく、確実な統計的優位性に基づいていることを保証します。 主な機関投資家向けフレームワーク ウォークフォワード最適化エンジン: ルックバック期間やしきい値の数千に及ぶ組み合わせを継続的にスキャンし、データをインサンプルとアウトオブサンプルに厳格に分離します。未検証のデータ環境において数学的優位性が証明された場合にのみ、新しいパラメーター設定を採用します。 定量的目的関数: 単なる純利益の追求ではなく、機関投資家レベルの安定性指標をターゲットとします。システム品質ナンバー(SQN)、期待値(1トレードあたりの平均Rマルチプル)、またはネットRの最適化を選
Sqn Max Indicator Sqn Max is an exclusive indicator to trade the market with high effectiveness. The indicator is based on price action, volatility and trend. This indicator is as simple as possible but not too simple. The indicator can generate alerts to ease the trading process. You don't have to stay all day in front of your screen. The indicator can be used with any class of assets and with any time frame. It is possible to achieve better results trading our list of selected assets. We achi
Smc Pro ToolKit
Talal N Z Aljarusha
5 (14)
SMC PRO TOOLKIT — SMART MONEY ANALYSIS & STRUCTURED TRADE PLANNING SMC Pro ToolKit is a professional Smart Money Concepts analysis workspace for MetaTrader 5. It combines market structure, multi-timeframe analysis, institutional price zones, setup evaluation, confirmation tools, volume context, alerts, and risk planning inside one organized chart environment. One workspace. Multiple layers of confirmation. One structured trading plan. OPEN COMPLETE USER GUIDE MULTI-CONDITION SETUP ENGINE At
SIO Oscillator:自己最適化型セミバリアンス・インバランス・オシレーター インジケーターをご購入いただくと、それをベースにしたエキスパートアドバイザー(EA)を無料でお受け取りいただけます。 多くのオシレーターは、すべての価格変動を同じように扱います。SIOは上昇圧力と下降圧力を分けて捉え、その間のインバランス(不均衡)を測定することで、買い手と売り手のどちらが本当に相場を支配しているかを示します。インバランスが極値に達すると、SIOはエントリー、ストップロス(Stop Loss)、テイクプロフィット(Take Profit)の水準を伴う明確なシグナルを表示します。 SIOの大きな特長は、固定パラメーターに頼らないことです。内蔵の自己最適化機能が、現在の銘柄と時間足に適したパラメーターを継続的に探索し、使用する前に検証します。 2つのシグナルモード 平均回帰(Mean Reversion):インバランスの極値で取引し、均衡への回帰を狙います。 トレンドフォロー(Trend Following):持続的で優勢なインバランスの方向に取引します。 自動モード:最適化機能が直近のデ
Power Candles V3 - 自己最適化型強弱インジケーター Power Candles V3は 、通貨や銘柄の強さを、適用されたすべてのチャート上で実行可能なトレードプランに変換します。単にローソク足を色分けするだけでなく、バックグラウンドでリアルタイムの自動最適化を実行し、目の前の銘柄に対して最適なストップロス、テイクプロフィット、およびシグナルの閾値を提示します。ワンクリックで実取引に適用でき、エントリーポイント、ストップロス、テイクプロフィットのラインが正確な価格位置にチャート上に表示され、方向性を示すアラートがリアルタイムで発動します。 このツールは、Stein Investmentsのエコシステムの一部です。  18種類以上のツールをすべて閲覧し、AIを活用したセットアップの推奨事項を入手し、  https://stein.investments でコミュニティに参加しましょう クローズしたバーごとに3,000回以上のトレードシミュレーション。9つの強さの状態。2つの戦略を並行してテスト。勝率の高い設定をワンクリックで適用。 なぜこれが必要なのか ほとんどの強
Atomic Analyst — MetaTrader 5 ご購入後、MQL5で私にメッセージをお送りいただくと、Smart Universal Expert Advisorを無料で受け取れるほか、オンライン講座、PDFマニュアル、非公開グループへのアクセスもご利用いただけます。 Atomic Analystは、プライスアクション、トレンドの方向、エントリー・決済シグナル、損切り水準、複数の利確水準をチャート上にまとめて表示します。 シグナルを確認し、取引の状況を理解する Atomic Analystは、分析結果をわかりやすい視覚情報として表示します。 • エントリーの候補を見つけるための買い・売りの矢印。 • 取引計画に役立つ損切り水準と複数の利確水準。 • 市場の方向性を評価するトレンド、強さ、モメンタムの指標。 • より広い市場背景を比較する複数時間足の分析。 • 変化する状況を追うための色分けされたローソク足とアラート。 シグナルと補助分析を併せて確認し、その取引機会がご自身のルールに合うかを判断してください。 短期の取引機会から、より大きな値動きまで Atomic A
Unix Scalper — MetaTrader 5 ご購入後、MQL5で私にメッセージをお送りいただくと、Smart Universal Expert Advisorを無料で受け取れるほか、オンライン講座、PDFマニュアル、非公開グループへのアクセスもご利用いただけます。 セットアップを見つけ、取引プランを確認し、取引方法を選ぶ。 UNIX Scalperは、市場分析、BUY/SELL/WAITの判断、Entry、Stop Loss、TP1、TP2の水準を、見やすいパネルにまとめています。 シグナルと取引プランを確認 • 明確な判断:BUY、SELL、WAIT。 • 明示された水準:Entry、Stop Loss、TP1、TP2。 • 複数時間足の一覧:パネル上で各時間足のシグナルを比較。 • 判断を支える分析:トレンド、モメンタム、出来高、ボラティリティ、サポートとレジスタンス、市場の質。 • 選べるレイアウト:Minimized、Compact、Standard、Full。 シグナルと各水準を確認し、そのセットアップがご自身の取引ルールに合うか判断してください。 ゴール
Tokyo Indicatorは、トレンドの方向性、潜在的な取引シグナル、および市場状況を視覚的に分かりやすく表示します。 色分けされた階段状のトレンドラインにより、強気局面(青色)と弱気局面(マゼンタ色)が明確に区別されます。トレンドの変化に合わせて表示される方向矢印は、売買の好機を強調します。 統合されたダッシュボードには、現在のシグナル、市場のバイアス(傾向)、モメンタム、ボラティリティ、シグナルの品質がひと目で分かるようにまとめられています。これにより、トレーダーはパネルを切り替えることなく、価格変動(プライスアクション)とインジケーターの数値を照らし合わせて分析を行うことができます。 すっきりとしたチャート表示と簡潔な市場概要により、Tokyo Indicatorはトレンド分析や取引判断における体系的なアプローチをサポートします。 あらゆる時間足や銘柄に対応しており、特に金(ゴールド)の取引に適しています。 トレンド スキャナーの強力なサポートを利用して、無料のインジケーターを入手し、プライバシーを守ります。あーみー!     設定 ShowHUD - チャート上のパネ
Astral Structure セットアップを評価し、初期プランを確認。 発売記念価格 - $99. 発売記念期間終了後は $149。 市場構造に基づくセットアップでは、上位の見方が一致しているか、ストップの参照値はどこか、目標はどう定義されるかという複数の疑問が生じます。Astral Structure は、市場構造を判断の軸とする裁量トレーダーのために、これらを一つの画面にまとめます。 対象のセットアップに集中。 最新の適格なセットアップ、その方向、条件の充足状況をまとめて確認できます。 時間足間の一致を確認。 評価中のセットアップを見失わずに、選択した時間足の値を比較できます。 初期プランとのつながりを維持。 各要素を別々に組み合わせることなく、そのセットアップに紐づくストップと目標の参照値を確認できます。 Structure は、最新の条件を満たしたセットアップを一貫した手順で評価するために活用できます。背景と初期の価格プランを同時に確認できます。 セットアップを背景とともに読む 最新の BUY または SELL セットアップ、その Structure Level、選択した
Crystal Heikin Ashi Signals—Professional Trend & Signal Detection Indicator Advanced Heikin Ashi Visualization with Intelligent Signal System for Manual & Automated Trading Final Price: $149 ---------> Price goes up $10 after every 10 sales . Limited slots available — act fast . Overview User Guide PDF Crystal Heikin Ashi Signals is a professional-grade MetaTrader 5 indicator that combines pure Heikin Ashi candle visualization with an advanced momentum-shift detection system. Designed for both m
トレンドキャッチャーインジケーター トレンドキャッチャーインジケーターは、開発者独自の適応型トレンド分析指標を組み合わせることで、市場価格の動きを分析します。短期的なノイズを除去し、根底にあるモメンタムの強さ、ボラティリティの拡大、価格構造の挙動に焦点を当てることで、真の市場方向性を特定します。また、移動平均線、RSI、ボラティリティフィルターなどの平滑化およびトレンドフィルタリング機能を備えたカスタマイズ指標も使用します。 実際の運用状況のモニタリングやその他の製品については、こちらをご覧ください: https://www.mql5.com/en/users/mechanic/seller ご注意ください。私はTelegramでEAや設定を販売していません。詐欺です。すべての設定はブログで無料で公開しています。 重要!ご購入後すぐにご連絡ください。手順とボーナスをお送りします!
マルチ通貨強度・モメンタム・インジケーター MT5 Dynamic Forex28 Navigator は、長年ご愛用いただいている人気インジケーターの進化形であり、5つの力を1つにまとめたものです。 Advanced Currency Strength28 Indicator (700件のレビュー) Advanced Currency IMPULSE with ALERT (530件のレビュー) Currency Strength EXOTICS GOLD Impulse with Alert CS28 Combo Signals (最近のボーナス) 4つのインジケーターを購入してチャートに重ねる必要はありません。すべてが1つの強力なインジケーターに統合されています。28通貨ペアの強度、それらを導く市場のモメンタム、そして両方のアラートを、1つのウィンドウ、1つのチャートで。 上記のプログラムは MQL5 Market で1,200件以上のレビューを獲得し、2016年から MT4 コミュニティで定番となっています。Dynamic Forex28 Navigator MT5 は、実証済
作者のその他のプロダクト
Perfect Day Scalper Pro Your Daily 5-Point Routine for a 5-Figure Income. Price: $150 USD (Stop Chasing, Start Cashing) ---   One Trade. One Target. One Victory Lap. Your Day is Done. (Forget the 1000+ pip dreams that turn into 100+ pip losses. Real wealth is built on consistency, not complexity. What if your entire trading day was over in 15 minutes, with a single, high-probability trade that hands you a clean, professional profit? Welcome to the Perfect Day Scalper.) ---   What is The
FREE
ADVANCED MARKET ANALYSIS INDICATOR        Overview of the Indicator This is not a simple indicator — it’s a multi-analysis predictive system. It combines: Volume Profile (POC, VAH, VAL) Fibonacci Extensions Pivot Levels (Daily, Weekly, 4H) Trend Determination (MA-based) Smart Money Concepts & Pattern Detection (basic placeholders for expansion) Prediction Engine (projects price forward for 1 hour) It gives you: Target Price Line (projection) Stop Loss Line (usually at Volume POC)
FREE
LEVEL 3 POWER INDICATOR   The Professional’s Timing Masterpiece Stop guessing market turns. Start seeing them before they happen. ---   Are You Missing Out on Big Moves? Entering trades just before the market reverses? Unsure whether a trend is truly over—or simply pausing? Struggling with confidence when holding trades? You’re not alone. Most traders wrestle with these exact challenges… until they discover the Level 3 Power Indicator. ---   The Game-Changing “Traffic Light” Syst
FREE
N/B: All our product purchase comes with our free ‘’DAILY   SCALPER EA’’ -   bit.ly/4qlFLNh Whatsapp Developer for yours after successful purchase THE PERFECT ENTRY INDICATOR  Enter Trades Like a Pro With the Perfect Entry Indicator! No More Guesswork. Just Precision. Double-ZigZag + Fractal Confirmation = Only the Strongest Buy & Sell Setups. Are you tired of false signals, late entries, and endless chart confusion? The Perfect Entry Indicator was built to give traders crystal-clear e
SMART SD ARROW INDICATOR  Trade Smarter, Not Harder: The Smart SD Arrow Indicator That Paints Clear Buy & Sell Signals Right On Your Chart!  Finally, an All-in-One Supply & Demand Tool That Doesn’t Just Draw Zones—It Gives You Precise, Actionable Entry Arrows. Stop Analyzing, Start Executing. Dear Trader, Let's be honest. You've tried indicators that draw complicated zones all over your chart. They look smart, but when it's time to pull the trigger, you're left with the same old question:
FREE
N/B: All our product purchase comes with our free ‘’DAILY   SCALPER EA’’ -   bit.ly/4qlFLNh Whatsapp Developer for yours after successful purchase   SEER SPIKE DETECTOR The Ultimate Market-Reversal & Spike Forecasting Tool for Crash & Boom Indices, Forex & Synthetic Markets Best on M1 and M5 Stoploss: 10 Candles Maximum.   What is SEER SPIKE DETECTOR? The SEER SPIKE DETECTOR is a next-generation market prediction indicator designed to detect and confirm spikes, reversals, and momentum sh
ZPOWER BUY & SELL INDICATOR   Trade Smarter. Trade Confidently. Trade Profitably. Are you tired of second-guessing your trades? Do you enter late and exit too early — leaving money on the table? It’s time to upgrade your strategy with the ZPOWER BUY & SELL INDICATOR, built with institutional-grade logic that helps you catch high-probability trade setups with precision.   Why ZPOWER is Different Unlike ordinary indicators that flood your charts with noise, ZPOWER is engineered with advanced
FREE
N/B: All our product purchase comes with our free ‘’DAILY   SCALPER EA’’ -   bit.ly/4qlFLNh Whatsapp Developer for yours after successful purchase Eternal Spike Detector Pro - M5 Mastery System   HOW TO TRADE THIS SYSTEM   TRADING RULES For CRASH 500/900/1000: SELL SETUP: · Wait for RED DOWN ARROW to appear · Enter SELL at the close of the M5 candle where arrow appears · Stop Loss: 1.5x ATR above the entry high · Take Profit: 2-3x ATR below entry · Only trade maximum 7 signals per day
THE ADVANCE PRICE PREDICTOR - GURU EDITION   Tired of Guesswork? Meet the AI-Powered "Almighty Predictor" – Pinpoints High-Probability Targets Before the Move, With Surgical Precision     Stop chasing pips. Start attracting them. Our proprietary algorithm fuses Multi-Timeframe Analysis + Smart Money Concepts + Real-Time Confluence Scoring to give you a clear, calculated edge on every trade.   Are You Constantly Wondering…   "Is this the top, or will it keep going?"   "Where should I real
FREE
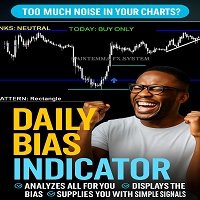
INTRODUCING the Powerful Daily Bias Indicator  The Daily Bias Indicator Stop Guessing. Start Trading with Confidence. Tired of staring at your charts and not knowing if today is a buy day or a sell day? The Daily Bias Indicator does the heavy lifting for you. It scans the market using 7 powerful tools (EMA trend, RSI, MACD, ADX, Volume, Pivot Points & Price Action). It tells you in plain language: “TODAY: BUY ONLY” “TODAY: SELL ONLY” Or “NO CLEAR BIAS” (so you don’t waste money
FREE
N/B: All our product purchase comes with our free ‘’DAILY   SCALPER EA’’ -   bit.ly/4qlFLNh Whatsapp Developer for yours after successful purchase OMEGA ONE SPIKE DETECTOR: Catch Every Explosive Move /Spikes with Surgical Precision   "I Used To Watch Spikes Fly By - Now I Catch Them Consistently Using Institutional Order Levels"   WATCHING 500-POINT SPIKE and not profiting?   ENTERING TOO LATE after the big move already happened?   GETTING STOPPED OUT right before the explosion? What If
Price Predictor Pro Turn Market Patterns into Predictable Profits! Are you tired of guessing where the market will go next? With Price Predictor Pro , you’ll trade with confidence by spotting powerful chart patterns and receiving precise price projections —directly on your MT5 chart. What Price Predictor Pro Does: ️ Detects high-probability chart patterns like Double Tops, Double Bottoms, Head & Shoulders, Flags, Pennants, and more . ️ Instantly projects the next price target using adv
FREE
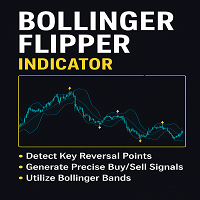
Introducing the Bollinger Flipper Indicator – Your Ultimate Trading Edge!   Are you tired of second-guessing your entries and exits? The Bollinger Flipper Indicator is here to flip the game in your favor.   Built with the power of Bollinger Bands + Level 3 Power System + ZigZag Fractals, this advanced tool is designed to spot high-probability buy & sell signals with precision. SPECIAL BONUS (VALID TILL JUNE 2026)- OUR DAILY SCALPER EA for BTCUSD and VIX75 •································
Unlock the Market's Hidden Blueprint with Advanced Pattern Recognizer Tired of staring at charts, struggling to spot high-probability trading opportunities? What if you had a professional analyst scanning the markets 24/7, drawing perfect trendlines, and calculating precise profit targets for you? Introducing Advanced Pattern Recognizer for MetaTrader 5 – Your Automated Technical Analysis Powerhouse. This isn't just another indicator. It's a sophisticated algorithmic engine designed to do the he
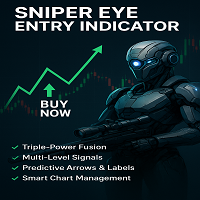
SNIPER SALES COPY Tired of Spraying and Praying? Get the Sniper's Edge with the Sniper Eye Indicator. From Trader to Tactician: Execute Trades with the Precision of a Market Sniper. The market is a battlefield. Most traders are like infantry—firing wildly, hoping a shot lands. They're plagued by noise, false signals, and emotional decisions that decimate their accounts. It's time to change your role. It's time to become a Sniper. Introducing the Sniper Eye Indicator for MetaTrader 5. This i
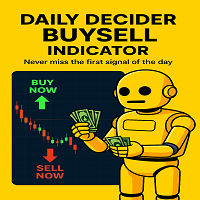
THE DAILY DECIDER BUYSELL PRO INDICATOR OVERVIEW Unlock the Market's Daily Secret: The Daily Decider BuySell Indicator is Here! Tired of analysis paralysis? Struggling with false signals and noisy markets? What if you could know the market's primary intention within the first few hours of the day and trade with unwavering confidence? Introducing the Daily Decider BuySell Indicator for MetaTrader 5. Pro Tip: Never Miss the first signal of the day This isn't just another indicator cluttering yo
N/B: All our product purchase comes with our free ‘’DAILY   SCALPER EA’’ -   bit.ly/4qlFLNh Whatsapp Developer for yours after successful purchase UNLEASH THE SPARTAN-ARROW SPIKE DETECTOR The Ultimate Boom & Crash Trading Weapon That Never Sleeps --- ️ THIS IS NOT JUST AN INDICATOR - IT'S YOUR PERSONAL 300 SPARTAN ARMY SPECIAL BONUS (VALID TILL JUNE 2026)- OUR DAILY SCALPER EA for BTCUSD and VIX75 •·································································•
N/B: All our product purchase comes with our free ‘’DAILY   SCALPER EA’’ -   bit.ly/4qlFLNh Whatsapp Developer for yours after successful purchase The Holy Grail MotherBar Indicator: Your Ultimate Path to Consistent Trading Profits   The Problem With Every Other Indicator You've Tried Let me guess - you've spent countless hours and hundreds (maybe thousands) of dollars on indicators that promise the world but deliver mediocre results. You've tried: · Lagging indicators that tell you what
N/B: All our product purchase comes with our free ‘’DAILY   SCALPER EA’’ -   bit.ly/4qlFLNh Whatsapp Developer for yours after successful purchase   DAY TRADER PLUS: The Institutional Order Flow System   Finally See Where Banks Place Their Orders - And Profit With Them   ARE YOU SICK OF THIS? "I entered the trade at what seemed like the perfect time... only to watch price reverse immediately and hit my stop loss." "I took profits too early, then watched the market run another 100 pips w
N/B: All our product purchase comes with our free ‘’DAILY   SCALPER EA’’ -   bit.ly/4qlFLNh Whatsapp Developer for yours after successful purchase HolyGrail Premium System: The Ultimate Supply & Demand Trading Solution   Finally Discover the "Unfair Advantage" That Professional Traders Have Been Using For Years "I went from inconsistent guessing to precision trading with 83% accuracy once I started combining multi-timeframe confirmation with institutional order flow zones" Note: After pur
N/B: All our product purchase comes with our free ‘’DAILY   SCALPER EA’’ -   bit.ly/4qlFLNh Whatsapp Developer for yours after successful purchase DayTrader Premium System Indicator: Complete Trading Mastery The DayTrader Premium System Indicator represents the culmination of institutional trading methodology made accessible to retail traders. By combining order block analysis, supply/demand zone identification, and multi-factor confirmation, it provides a comprehensive framework for consis
HolyGrail M   N/B: All our product purchase comes with our free ‘’DAILY   SCALPER EA’’ -   bit.ly/4qlFLNh Whatsapp Developer for yours after successful purchase m ost wanted Edition Overview   ATTENTION ALL TRADERS!  FINALLY UNVEILED: The "HolyGrail MostWanted" Indicator - Your All-in-One Institutional Trading Dashboard for MetaTrader 5 SPECIAL BONUS (VALID TILL JUNE 2026)- OUR DAILY SCALPER EA for BTCUSD and VIX75 •·································································•
N/B: All our product purchase comes with our free ‘’DAILY   SCALPER EA’’ -   bit.ly/4qlFLNh Whatsapp Developer for yours after successful purchase Premium Breakout Scanner Indicator: Your Institutional-Grade Breakout Trading System   DISCOVER HIGH-PROBABILITY BREAKOUTS BEFORE THEY HAPPEN THIS IS A FOUR-CANDLE BREAKOUT STRATEGY/SYSTEM WITH 70%+ ACCURACY . Tired of missing breakout moves? Entering too late? Getting stopped out by false breakouts? The Premium Breakout Scanner combines instit
N/B: All our product purchase comes with our free ‘’DAILY   SCALPER EA’’ -   bit.ly/4qlFLNh Whatsapp Developer for yours after successful purchase   PATTERN 123 PRO - REVOLUTIONARY TRADING SIGNALS INDICATOR     WHY 98% OF TRADERS FAIL - AND HOW WE FIXED IT Traders lose money not because they can't read charts, but because they can't filter NOISE from REAL OPPORTUNITIES. They see patterns everywhere, but which ones actually work? Which signals are still valid by the time they spot them? WE
N/B: All our product purchase comes with our free ‘’DAILY   SCALPER EA’’ -   bit.ly/4qlFLNh Whatsapp Developer for yours after successful purchase UNLOCK THE 4-CANDLE SECRET: Trade Like a PRO with "Inside Bar Dominator"   ATTENTION ALL TRADERS! Are you tired of: · Losing trades from false breakouts? · Missing entries because you're stuck analyzing charts? · Complex indicators that give conflicting signals? · Struggling to find clear stop loss and take profit levels? What if I told you th
N/B: All our product purchase comes with our free ‘’DAILY   SCALPER EA’’ -   bit.ly/4qlFLNh Whatsapp Developer for yours after successful purchase PROFESSIONAL DOUBLE TOP/BOTTOM PATTERN SCANNER The Ultimate Reversal Trading System for Forex & Crypto Traders  TRANSFORM YOUR TRADING WITH INSTANT PATTERN RECOGNITION Are you tired of missing profitable reversal setups? Exhausted from staring at charts for hours, trying to spot double tops and bottoms? Frustrated with false breakouts and misse
N/B: All our product purchase comes with our free ‘’DAILY   SCALPER EA’’ -   bit.ly/4qlFLNh Whatsapp Developer for yours after successful purchase PIN BAR POWER REVERSAL SCANNER MT5   UNLOCK THE SECRET OF INSTITUTIONAL TRADING WITHOUT THE HEDGE FUND BUDGET What If I Told You There's a Way to Spot Reversals BEFORE They Happen? Professional traders know: Pin bars at key levels are where fortunes are made. The institutions use them. The smart money follows them. And now, YOU can trade them w
N/B: All our product purchase comes with our free ‘’DAILY   SCALPER EA’’ -   bit.ly/4qlFLNh Whatsapp Developer for yours after successful purchase REVERSAL ENTRY PRO INDICATOR The Smart Money's Secret Weapon for Pinpointing Extreme Reversal Zones INTRODUCTION: THE TRADER'S DILEMMA Every trader knows the frustration: You see a market reaching extremes, but when do you enter? How do you distinguish between a minor pullback and a major trend reversal? Where do you place your stop loss that'
GOLD MASTER TRADER 3.0 Professional Institutional-Grade Gold Trading System --- UNLOCK THE PROFESSIONAL'S EDGE IN GOLD TRADING What if you could see the gold market through the eyes of institutional traders? What if you had a system that didn't just show you where price is, but where the big money is likely to move it next? Gold Master Trader 3.0 isn't another lagging indicator that shows you what already happened. It's a comprehensive institutional-grade trading system that reveals order f
N/B: All our product purchase comes with our free ‘’DAILY   SCALPER EA’’ -   bit.ly/4qlFLNh Whatsapp Developer for yours after successful purchase CONTRACTION + EXPANSION BOX SCANNER The SIMPLE Guide for Regular Traders   WHAT THIS INDICATOR DOES (IN PLAIN ENGLISH) Think of the market like a rubber band: 1. CONTRACTION = Rubber band being squeezed tight (price moves in a small range) 2. EXPANSION = Rubber band SNAPS and stretches out (price makes a big move) This indicator does ONE SI
フィルタ:
レビューなし
レビューに返信