IndicatorLab MT5 Standard

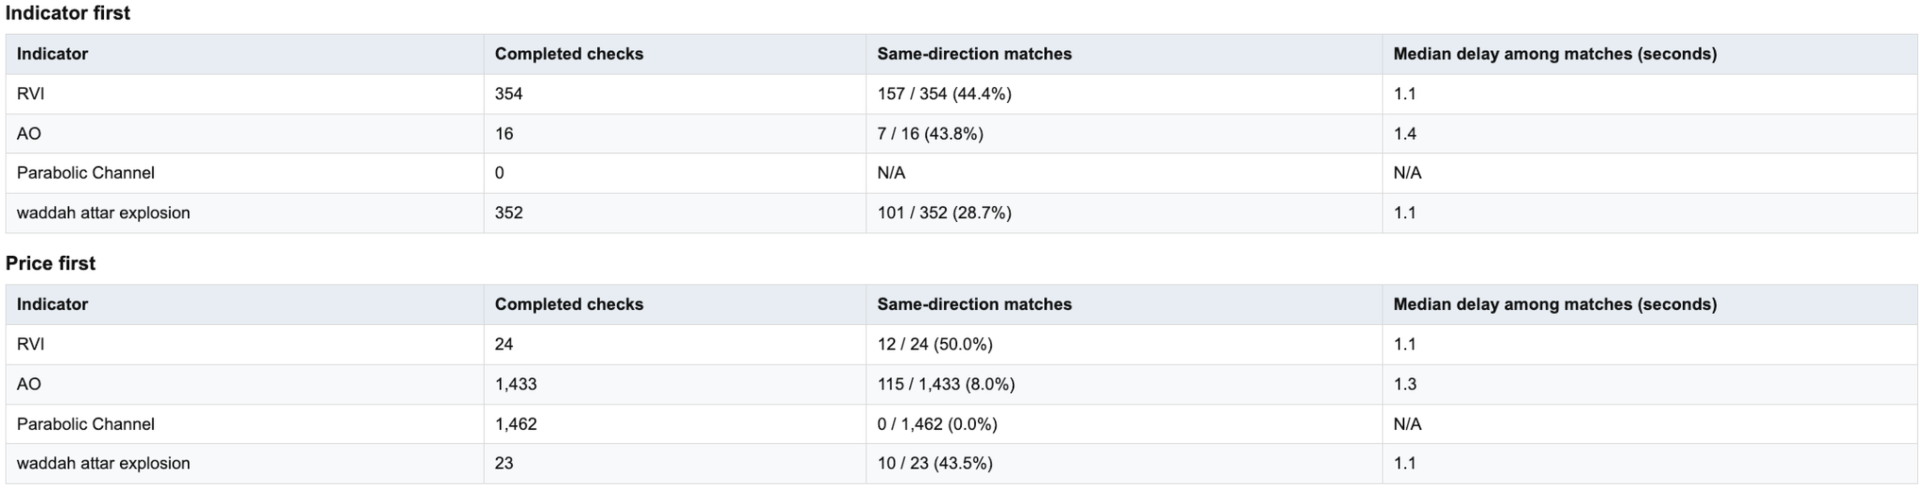
When your indicator changes direction, do you know what price does next?  Does your indicator tend to move before price, after it, or within the same observation window?  Do you know how responsive your indicator is across symbols, timeframes, and market periods?

IndicatorLab MT5 can help with that!  IndicatorLab MT5 is a utility that samples indicator values alongside price and analyzes their movement and timing relationships, presenting the results in clear HTML reports built from CSV data checked for integrity and consistency.

It was developed for indicator-based traders who want to explore and compare a variety of indicators, understand how they relate to price across symbols and changing market activity, and evaluate them conveniently before putting real money at risk.

See how your indicators behaved on your chosen symbol and timeframe, through an HTML report and supporting CSV data.

HOW IT WORKS

IndicatorLab MT5 has two test modes: Buffer Probe and Main.

  1. Check outputs if needed. If you’re unsure which indicator buffers to use or whether they provide readable values, configure your indicators in Buffer Probe and run it. Review the results before selecting buffers for Main.

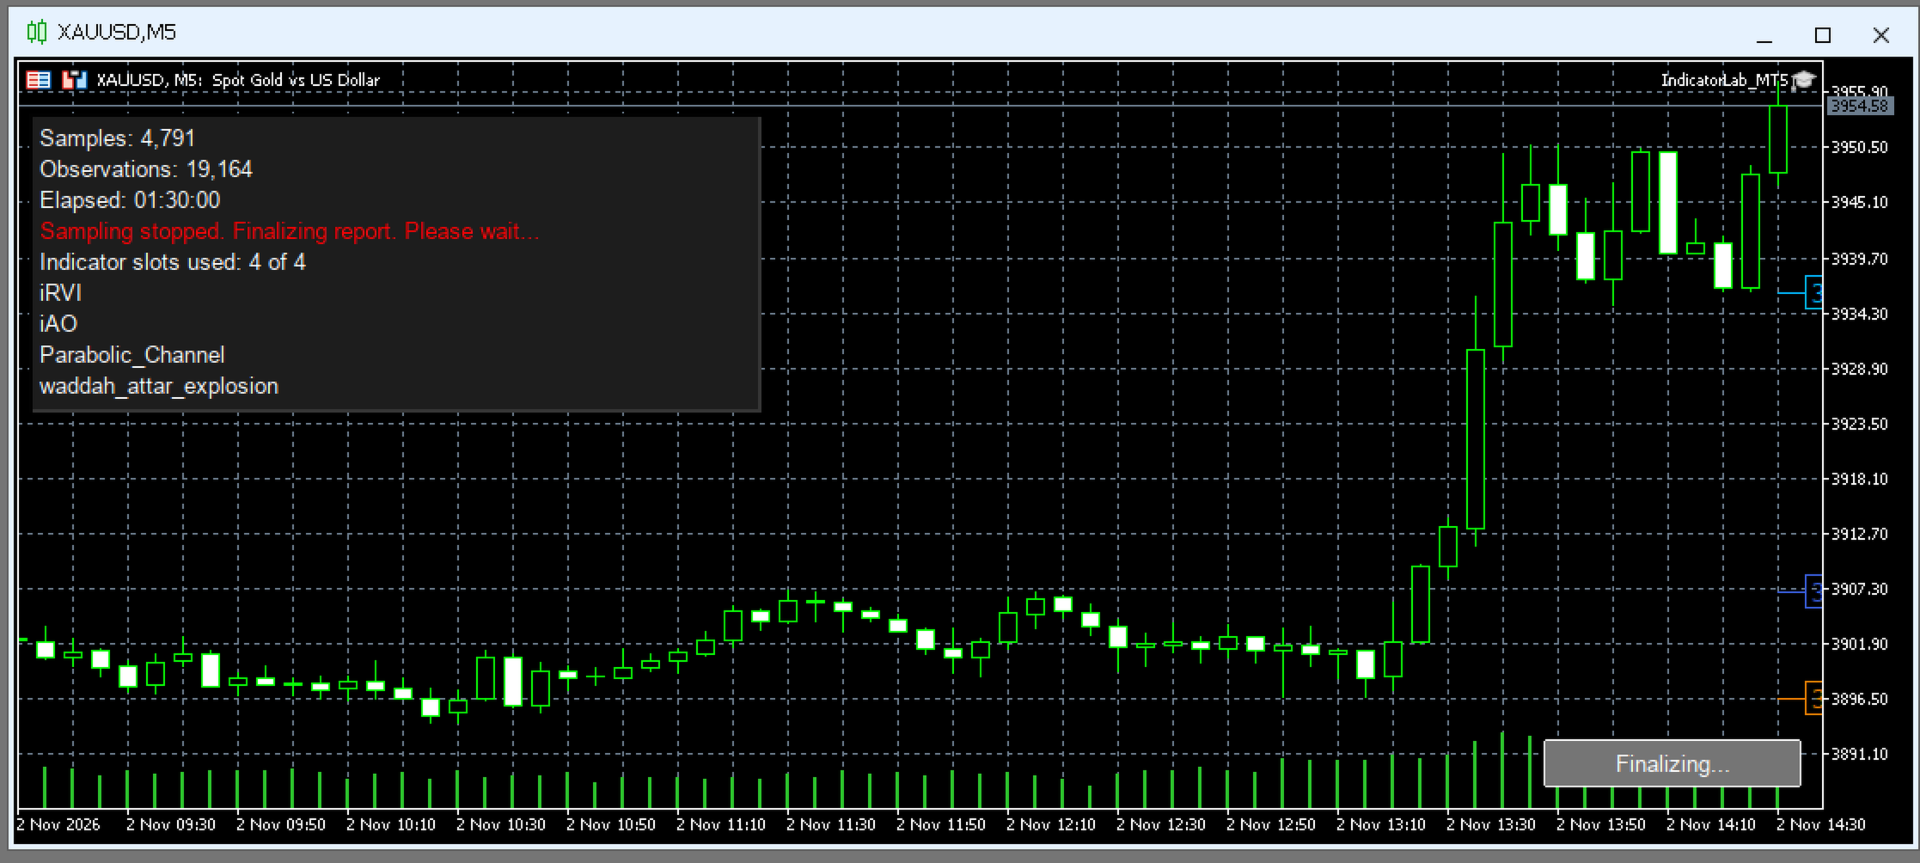
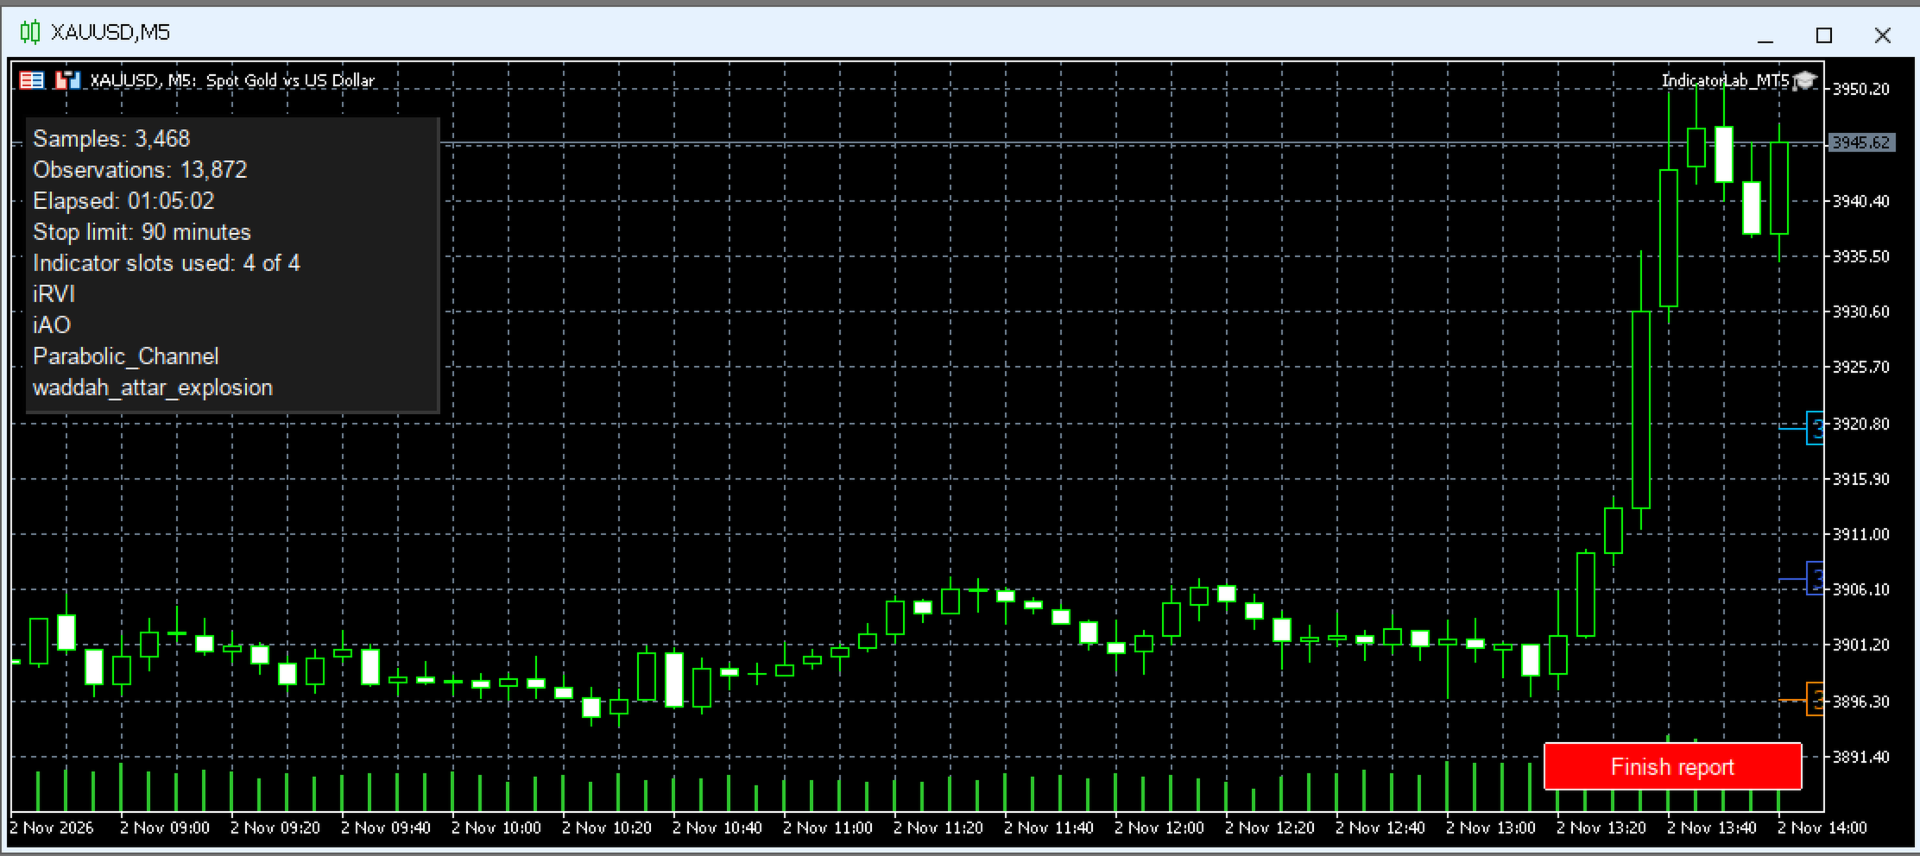
  2. Configure and run Main. Choose a symbol, timeframe, and one to four built-in or compatible installed custom indicators, including mixed combinations. Select their output buffers, test duration, and maximum indicator read time. Run on a chart or in the local Strategy Tester. Collection stops automatically when the selected duration elapses; on a chart, you can also stop early with Finish report. Allow finalization to complete before opening the report.

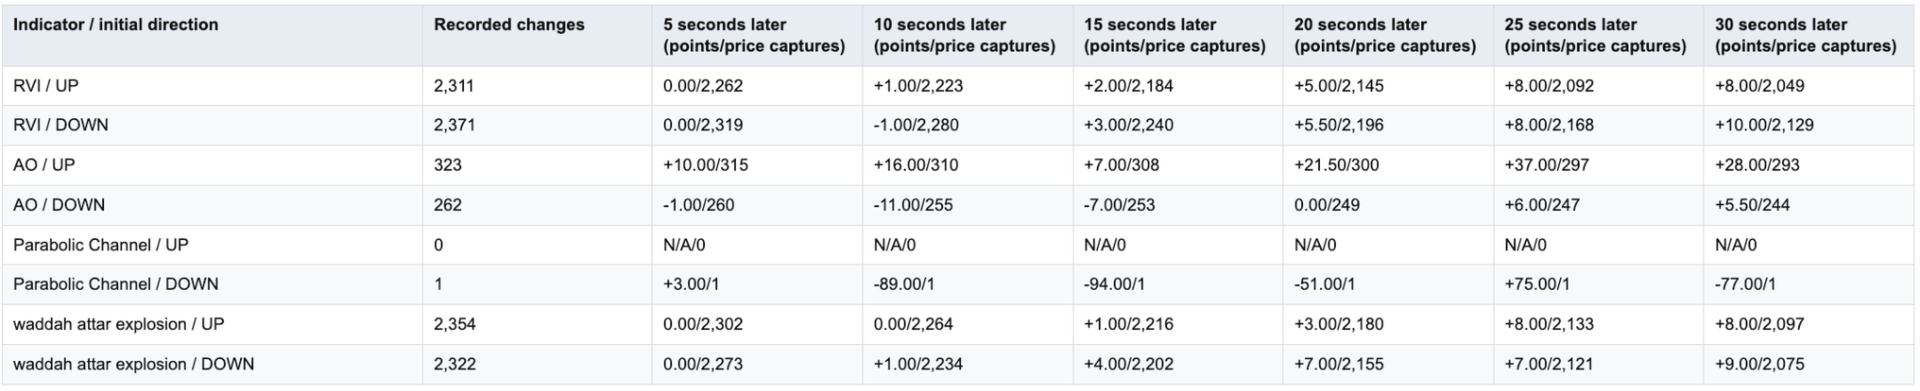
  3. Review the results. After finalization, open the HTML report to examine indicator-to-price movement, response timing, and data coverage. Supporting CSV files are available for reference or further analysis in spreadsheets and other tools.

  4. Build and refine your own strategy. Use what you learn to select indicators, define your trading rules, and test your ideas across symbols, timeframes, and market conditions. You decide what fits your approach, then evaluate it in strategy testing and demo trading before risking real money.

IndicatorLab MT5 helps you move from chart impressions to recorded evidence:

  • See what follows an indicator change: examine subsequent price movement and observed response timing.

  • Compare indicators on common ground: evaluate built-in and compatible custom indicators over the same recorded period.

  • Explore different market conditions: compare behavior across the symbols, timeframes, and periods you test.

  • Know what supports your conclusions: distinguish usable observations from missing data and limited coverage.

  • Keep the evidence: revisit HTML reports or explore the supporting CSV data in Excel, Google Sheets, Python, and other tools.

  • Make the strategy your own: use your findings to choose indicators and refine your trading ideas before putting money at risk.

Don’t just watch your indicators. Understand their behavior—and decide how they fit your strategy.


COMPATIBILITY AND LIMITS

  • Indicator access: Custom indicators must be installed, licensed where required, and provide readable buffer values. Chart drawings alone may not be readable. Required dependencies must also be installed.

  • Settings: IndicatorLab uses indicator defaults with supported Period / Length adjustments. Arbitrary custom parameter lists and Parameter Probe are not available.

  • Markets and testing: Tested examples include currencies and gold. Symbols and history depend on your broker; local Strategy Tester support depends on the indicator. Remote/cloud use with custom indicators and Market-demo exports are not guaranteed.

  • Interpretation: Sampling can miss activity between observations. Results describe recorded behavior, not predictions, trading signals, or proof of simultaneous movement.

Runs directly in MT5. No separate launcher or Python required.
Support: Product comments or MQL5 messaging.


INDICATORLAB MT5 USER GUIDE

Record indicator and price activity, then explore their relationships in an HTML report with supporting CSV data. IndicatorLab observes; it does not place or manage trades.

1. Install and prepare

Install IndicatorLab through your Market purchase, or place an authorized EX5 file in MQL5/Experts. Install custom indicators and their required dependencies according to the supplier’s instructions.

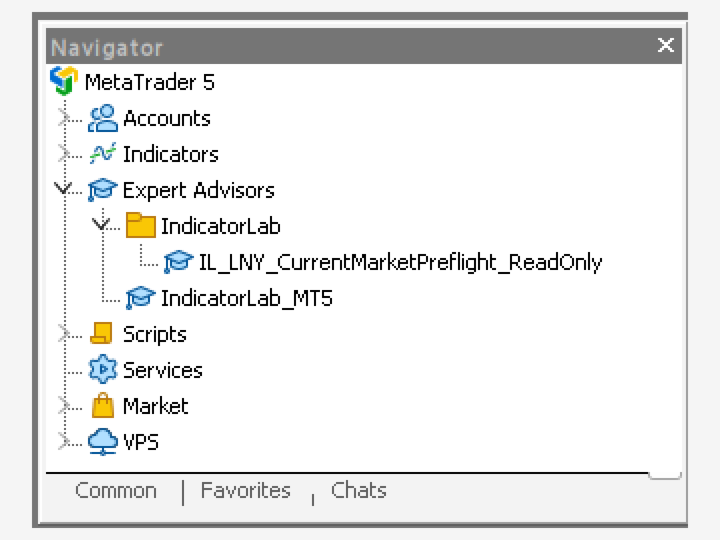
Open your chosen symbol and timeframe, then attach IndicatorLab from Navigator → Expert Advisors. Load a preset or enter your settings in Inputs. A preset does not change the chart’s symbol or timeframe. Review your settings and capture any screenshots before clicking OK.

No separate launcher, Python, or configuration file is needed. Do not enable DLL access or trading permissions just to run IndicatorLab.

2. Check buffers if needed

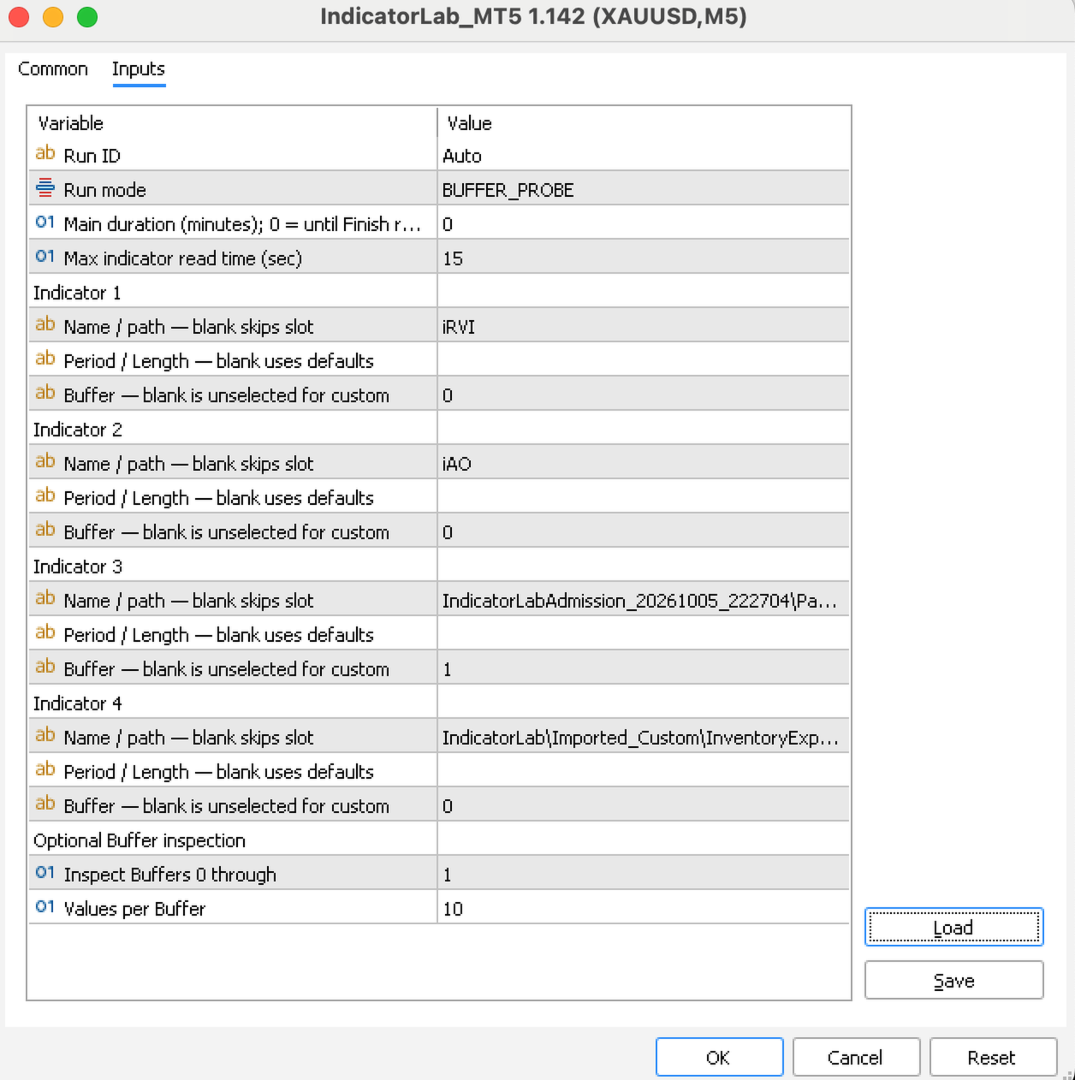
Choose Buffer Probe if you’re unsure which outputs to read. Configure up to four indicators and set the buffer range and values to inspect. The probe checks each enabled indicator, saves its findings, and finishes automatically.

A zero can be a valid value; an empty buffer does not necessarily mean an indicator is broken. Review the findings, then select the intended custom buffer in Main yourself. Probe does not transfer settings automatically.

3. Configure and run Main

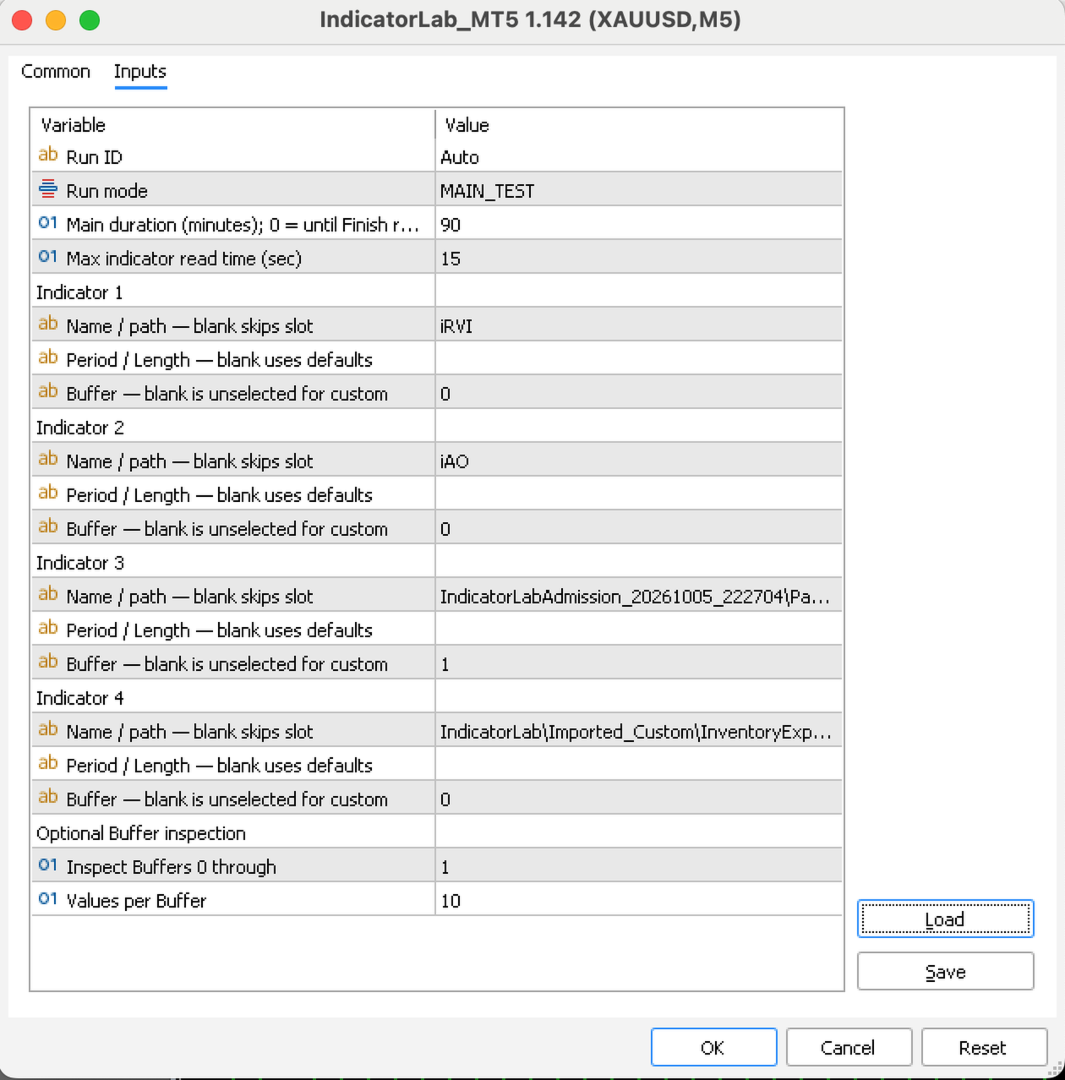
Select MAIN_TEST and configure one to four built-in or compatible custom indicators:

  • Name/path: Enter a built-in name, such as iRSI, or a custom path relative to MQL5/Indicators. Leave unused slots blank.

  • Period/Length: Leave blank for defaults. Only supported adjustments are accepted; this is not a general custom-parameter editor.

  • Buffer: Select the custom output you want to examine. A blank custom buffer is unselected. Built-ins can use their supported primary output when left blank.

  • Duration: The default is 8 minutes. Choose another positive duration, or 0 to continue until you select Finish report on a chart.

  • Run ID: Leave Auto selected to keep each run’s results separate.

  • Maximum read time: The default is 15 seconds.

For a simple first test, use iRSI, Period 14, Buffer 0, and leave the other slots blank. Settings on a separate chart indicator do not configure IndicatorLab’s reads.

4. Finish and review

Let the duration expire or click Finish report. Wait for finalization before closing the terminal or removing IndicatorLab. Saving may take several minutes; check Experts for confirmation. Normal completed closeout removes IndicatorLab from the chart.

For chart results, open File → Open Data Folder → MQL5 → Files → IndicatorLab, then the run folder shown in Experts. Open IndicatorLab_IndicatorLab_Report.html and keep its companion CSV files. You can export a PDF through your browser.

Start with the outcome, stopping reason, duration, and data health:

  • PASS: The run met its success requirements; this is not a trading recommendation.

  • Completed with limited coverage: Useful results are available, with stated limitations.

  • FAIL: Review the reported cause before drawing conclusions.

Finishing early or recording fewer than 500 observations does not, by itself, reduce an otherwise successful result. The sample-size recommendation is advice, not a configurable requirement.

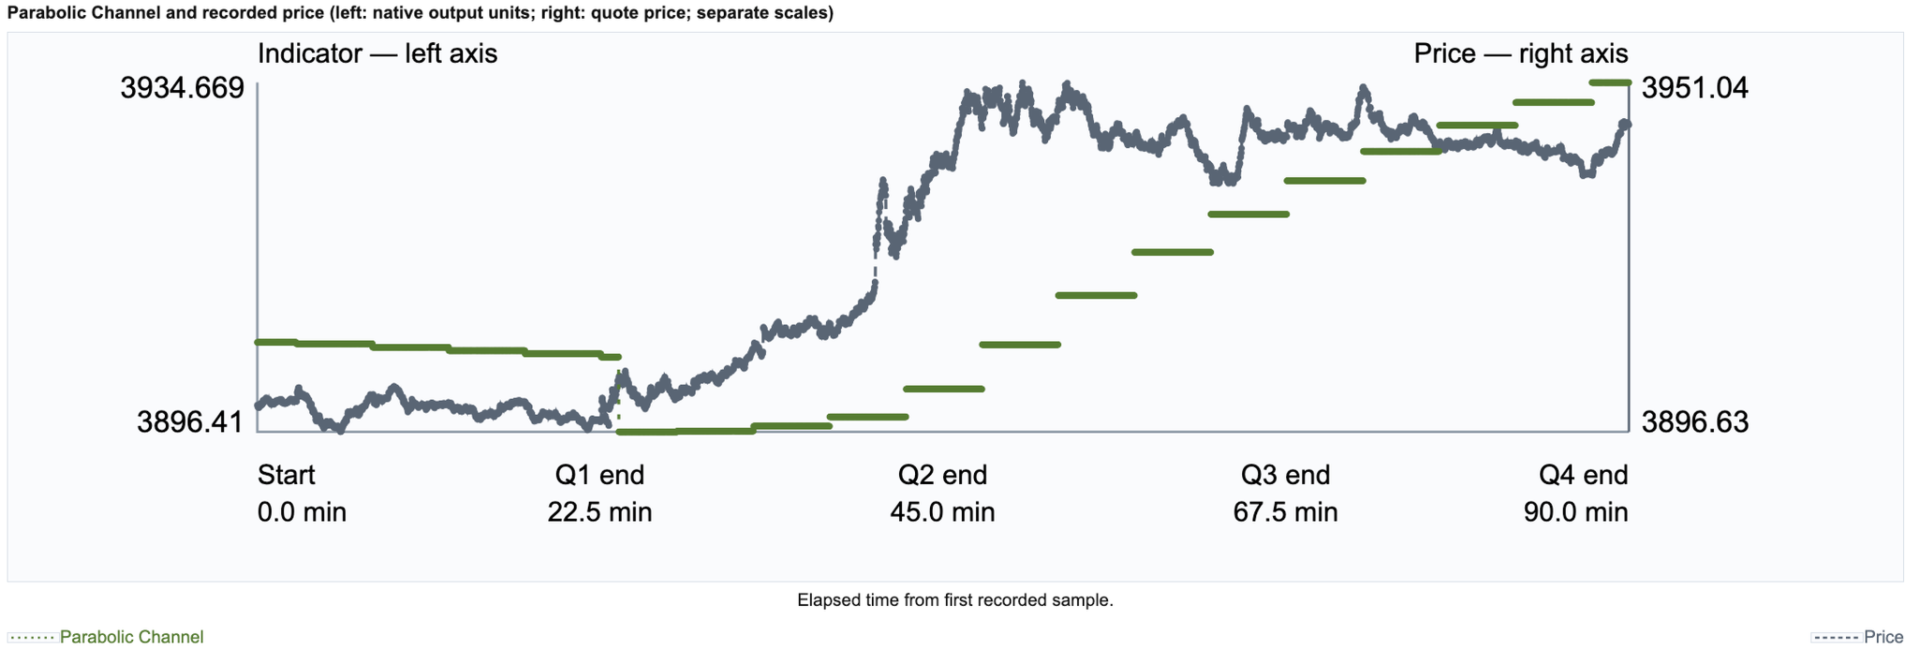
Read chart labels carefully: indicators may share price units or use separate scales. Coverage notes explain overlapping lines and missing comparisons. Results describe sampled behavior, not predictions or trading signals.

USING STRATEGY TESTER

Select IndicatorLab as the Expert Advisor, choose the symbol, timeframe, historical dates, and tick model, then configure Main. Custom indicators and their dependencies must work in that local Tester environment.

Let the test finish by duration or available history; do not rely on an interactive Finish button in a nonvisual test. Local Main testing is supported. Grouped Buffer Probe in Tester, remote/cloud custom delivery, and Market-demo exports are not guaranteed.

IMPORTANT LIMITS

  • Sampling has a one-second minimum interval, but ticks, data availability, and read time affect the actual rate. Activity between samples can be missed.

  • Reads are sequential. The read-time limit detects an overrun only when the call returns; it cannot interrupt a frozen indicator.

  • Supported Period/Length edits are limited to mapped indicators. Arbitrary custom parameter lists and Parameter Probe are unavailable.

  • Symbols, history, indicator access, and Tester compatibility depend on your broker and indicator supplier.

TROUBLESHOOTING AND SUPPORT

If a run does not start or save, check Experts/Journal and retain its diagnostics. Do not restart over an unfinished run.

Contact support through product comments or MQL5 messaging. Include the version, mode, symbol/timeframe, Run ID, exact message, and relevant files, with private account information removed.
おすすめのプロダクト
Fabii Half Trend Baseline
Fabien Georges Andre Guillemaud
上位足のトレンドに逆らう取引をやめましょう。2本のベースライン、1つのチャート。リペイントなし。 どの通貨ペアでも、どの時間足でも。2分でチャートに表示。Strategy Tester で無料デモを試せます。 Get more indicators here Baselines, volatility filters and oscillators. No repaint. 必要な理由 チャート上のラインが緑になったので、あなたはエントリーします。その後、上位足を開くと、大きなトレンドは逆方向を向いています。シグナルは本物でした。しかし、その背景のトレンドはあなたの味方ではありませんでした。 大きなトレンドに逆らう取引は、そのたびにエントリーの優位性を失わせます。 得られるもの Fabii Half Trend Baseline は、現在の時間足のトレンドと上位足のトレンドを1つのチャートに表示します。ウィンドウを切り替えて全体像を確認する必要がなくなります。 上位足の2本目のベースラインがメインのラインの後ろに描かれるため、別のチャートを開かずに大きなトレンドが分かります。 ベ
プレミアムレベルは、正しい予測の精度が80%を超える独自の指標です。 この指標は、最高のトレーディングスペシャリストによって2か月以上テストされています。 あなたが他のどこにも見つけられない作者の指標! スクリーンショットから、このツールの正確さを自分で確認できます。 1は、1キャンドルの有効期限を持つバイナリーオプションの取引に最適です。 2はすべての通貨ペア、株式、商品、暗号通貨で機能します 手順: 赤い矢印が表示されたらすぐにダウントレードを開き、青い矢印が表示されたら閉じます。青い矢印の後に開くこともできます。 試してテストしてください!推奨設定はデフォルトです! 日足チャートで最高の精度を示します! インディケータは、2600 Pipsの収益性に対して、約10Pipsという非常に小さなマージンを使用します。
Trading Utility for Forex Currency Pairs Only not for Gold  Functions Auto Lot Calculation based on Risk Auto stoploss  Auto TakeProfit Breakeven Auto Close Half % Close in percentage with respect to the PIPs Pending Orders BuyLimit Sell Limit with distances BuyStop Sell Stop    with distances Trading Informations Risk in percentage For Multiple trades Combine Takeprofit and Combine Stoplosses
Noize Absorption Index - is the manual trading system that measures the difference of pressure between bears forces and bulls forces. Green line - is a noize free index that showing curent situation. Zero value of index shows totally choppy/flat market.Values above zero level shows how powerfull bullish wave is and values below zero measures bearish forces.Up arrow appears on bearish market when it's ready to reverse, dn arrow appears on weak bullish market, as a result of reverse expectation.
CosmiCLab SMC FIBO CosmiCLab SMC FIBO is a professional trading indicator designed for traders who use Smart Money Concepts (SMC), market structure analysis and Fibonacci retracement levels. The indicator automatically detects market swings and builds Fibonacci levels based on the latest impulse movement. It also identifies market structure changes such as BOS (Break of Structure) and CHOCH (Change of Character), helping traders understand the current market direction. CosmiCLab SMC FIBO also pr
Confluence Meter:26本のインジケーターを1つの総合レーティングに Confluence Meter は、人気の高い26本のインジケーターのシグナルを計算し、「売り/中立/買い」というシンプルなレーティングにまとめます。何十ものウィンドウを開いて数値を手作業で見比べる必要はありません。パネルをひと目見るだけで、選択した時間足で相場がどちらに傾いているかが分かります。 MT4-version:  https://www.mql5.com/en/market/product/199466 Our products: https://www.mql5.com/en/users/trendhunter/seller チャートに表示される内容 **Oscillators ゲージ。**11本のオシレーターのレーティングです。RSI、Stochastic、CCI、ADX、Awesome Oscillator、Momentum、MACD、Stochastic RSI、Williams %R、Bulls/Bears Power、Ultimate Oscillator が含まれます。 *
Inverted_Chart_EA Utility Expert Advisor Inverted_Chart_EA creates and maintains a mirror-inverted chart of any symbol and timeframe. It automatically generates a custom instrument (e.g. US30_INV ) and keeps its price history updated in real time, with bars mirrored around a chosen pivot. This utility gives traders a new way to analyze the market from a different perspective by flipping the chart upside down. Why use an inverted chart? Highlight hidden patterns – price formations that look ordin
TradePilotmt5
Hossein Khalil Alishir
TradePilot Expert Advisor (EA) for MetaTrader 5 TradePilot is a professional and user-friendly Expert Advisor (EA) for MetaTrader 5 (MT5) . It simplifies automated trading , risk management , and trade execution with a smart trading panel . Perfect for beginners and experienced traders looking for a reliable trade manager EA with automated lot size calculation and smart position management. Key Advantages User-Friendly Trading Panel: Customizable panel with buttons and hotkeys for fast ex
TradePad
Ruslan Khasanov
5 (1)
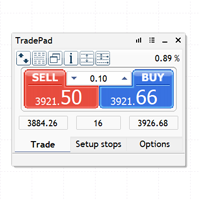
TradePad は、手動取引とアルゴリズム取引の両方に使用できるツールです。複数の取引商品での迅速な取引操作とポジション管理のためのシンプルなソリューションを提供します。 注意: アプリケーションは戦略テスターでは動作しません。 デモアカウント用のアプリケーションの試用版とすべてのツールの説明 アプリケーション インターフェイスは高解像度のモニターに適応しており、シンプルで直感的です。快適な作業のために、トレーダーには次のツール セットが提供されます: 取引操作の管理、メイン チャートの期間の切り替え、TradePad 商品の切り替えを行うホット キー マネージャー。 ポジションを開くときや保留中の注文を設定するときに、ドローダウンのリスクを評価し、潜在的な利益を計算するために取引レベルをマークするツール。 複数の取引シンボルを視覚的に監視し、アルゴリズム取引の取引シグナルを受信するための MultiCharts ツール。利便性のために、取引ペアのセットを整理できます。これにより、複数の時間枠で価格を監視し、複数の通貨取引を行うことができます。 履歴の任意の期間の取引統計を表示するた
HMA Scalper Pro EA
Vladimir Shumikhin
5 (2)
HMA Scalper Pro EA — Hull Moving Average (HMA) インジケーターに基づく MetaTrader 5 用自動売買アドバイザー 概要 HMA Scalper Pro EA は、Hull Moving Average (HMA) の方向にトレードする MetaTrader 5 用のプロフェッショナルなトレーディングロボット(Expert Advisor)です。HMA インジケーターは現在のトレンド方向を判定し、アドバイザーはその方向にトレードを執行し、Smart Risk キャピタルマネジメント、アダプティブグリッドトレーディング、トレイリングストップ、ブレイクイーブン、タイムフィルターでエントリーを補完します。 このアドバイザーは Netting アカウントと Hedging アカウントの両方をサポートし、金(XAU/USD)、外国為替通貨ペア、原油、指数、暗号資産の取引に適しています。 HMA SCALPER PRO EA を選ぶ理由 - Hull Moving Average シグナル — HMA の方向に基づくエントリー。HMA
Overview Mirror Signals Service EA (Text only)   is a powerful monitoring Expert Advisor that automatically sends   real-time Telegram notifications   for all important trade events on your MetaTrader 5 account. It is engineered specifically for   signal providers ,   trade-copier operators ,   auditors ,   educators , and   professional trading services   that require immediate, detailed, and reliable reporting. Everything from   entries, exits, SL/TP changes, comment changes, trailing sto
Was: $249  Now: $99   Market Profile defines a number of day types that can help the trader to determine market behaviour. A key feature is the Value Area, representing the range of price action where 70% of trading took place. Understanding the Value Area can give traders valuable insight into market direction and establish the higher odds trade. It is an excellent addition to any system you may be using. Inspired by Jim Dalton’s book “Mind Over Markets”, this indicator is designed to suit the
AXOS Liquidity Sweep – MT5向けスマート需給ゾーンとリアルタイム流動性分析インジケーター リアルタイム流動性分析 | 需給ゾーン | リクイディティスイープ検出 | スマートマネーコンセプト(SMC)| 出来高分析 | BUY・SELLシグナル はじめに AXOS Liquidity Sweep は、MetaTrader 5向けに開発された高度なテクニカル分析インジケーターです。リアルタイムの流動性分析、需給ゾーン(Supply & Demand)、プライスアクション、スイング構造、出来高情報を組み合わせ、トレーダーが潜在的な取引機会を特定できるよう支援します。 トレードにおける大きな課題の一つは、どの流動性レベルが重要なのかを判断することです。 多くのトレーダーはサポート、レジスタンス、供給ゾーン、需要ゾーンを特定できますが、どの流動性エリアに注目すべきかを判断するのは簡単ではありません。 AXOS Liquidity Sweepは、関連するゾーンを自動的に特定し、流動性に関連する価格変動を監視し、リクイディティスイープの検出条件が満たされた際に方向性を示す矢
インディケータは現在のクオートを作成し、これを過去のものと比較して、これに基づいて価格変動予測を行います。インジケータには、目的の日付にすばやく移動するためのテキスト フィールドがあります。 オプション: シンボル - インジケーターが表示するシンボルの選択; SymbolPeriod - 指標がデータを取る期間の選択; IndicatorColor - インジケータの色; HorisontalShift - 指定されたバー数だけインディケータによって描画されたクオートのシフト; Inverse - true は引用符を逆にします。false - 元のビュー。 ChartVerticalShiftStep - チャートを垂直方向にシフトします (キーボードの上下矢印)。 次は日付を入力できるテキストフィールドの設定で、「Enter」を押すとすぐにジャンプできます。
Mine Farm is one of the most classic and time-tested scalping strategies based on the breakdown of strong price levels. Mine Farm is the author's modification of the system for determining entry and exit points into the market... Mine Farm - is the combination of great potential with reliability and safety. Why Mine Farm?! - each order has a short dynamic Stop Loss - the advisor does not use any risky methods (averaging, martingale, grid, locking, etc.) - the advisor tries to get the most
Painel Profit is an operational trading panel for MetaTrader 5 created to make manual execution and visual order management easier directly on the chart. The operating principle is simple: the trader selects the symbol, timeframe, volume, entry type, and exit strategy. Based on these commands, the panel sends or organizes the trade through the interface, displaying the entry, take profit, and stop loss levels on the chart for visual monitoring. This product is not a signal robot and does not mak
Range Volume Hybrid Generator
Trade The Volume Waves Single Member P.C.
1. Introduction Range Volume Hybrid (RVH) is a MetaTrader 5 Expert Advisor that creates custom chart symbols using a unique dual-condition bar formation method. Unlike traditional charts where bars close based on a single criterion (time, range, or volume), RVH bars close only when BOTH a minimum price range AND a minimum volume threshold are met simultaneously.  Download also and install RVH Monito r Indicator - to control the EA from the custom charts (it's Free)  https://www.mql5.com/en/marke
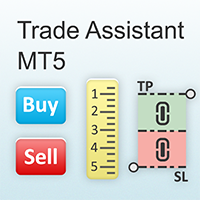
Trading Assistent is a multifunctional trading panel that combines all necessary tools for professional trading. The panel provides complete control over positions, in-depth risk analysis, and fast order execution. MAIN FUNCTIONAL BLOCKS Position Management: - Real-time viewing of all open positions - Sorting by symbol, profit, volume, and type - Visual indication of profitable and losing positions - Bulk closing operations - Breakeven function for profit protection Trading Operations: - I
Smart Support And Resistance Indicator See the Market Levels That Matter. Make your chart clearer and your technical analysis more organized with Smart Support And Resistance Indicator — a powerful trading tool designed to help traders identify important support and resistance levels directly on their MetaTrader 5 charts. Whether you trade Forex, Gold, Indices, or other available markets, this indicator helps you focus on key price areas, monitor potential market reactions, and analyze price act
Japanese このインジケーターは、チャートパターンでのトレードを好むトレーダーにとって、高度なチャート分析アシスタントとして機能します。目視での分析負担を軽減し、利益を上げるための精度を高めるように設計されています。 実際の使用においての、このインジケーターの主な利点と特徴は以下の通りです: 1. 自動パターン検出 (Automated Pattern Detection) 時間の節約とバイアスの軽減: 手動でトレンドラインを引く必要はありません。価格のスイングポイント(Pivot High/Low)を検索し、価格構造が条件を満たすと、ライジングウェッジ(上昇楔形)とフォーリングウェッジ(下降楔形)を自動的に描画します。 あらゆる状況を網羅: パターン形成中、ブレイクアウト、さらにはパターン失敗(Failed)まで検出でき、市場の全体像を明確に把握できます。 2. ターゲットとフィボナッチTPの内蔵 (Built-in Targets & Fibonacci TP) ターゲットを自動計算: ブレイクアウトが発生すると、システムはウェッジの開き幅に基づいてメインターゲットの距離を即
Passband Filter Pro Passband Filter Pro is a trend and cycle oscillator for MetaTrader 5. It is built on the Ehlers Super Passband Filter, a band pass filter that removes long term trend drift and short term noise so that only the dominant market cycle remains. The result is a clean oscillator with a color cloud that shows overbought and oversold conditions, cycle turns, and momentum on forex, gold, indices, stocks and crypto. Most traders enter too early or too late. Simple moving averages la
SolarTrade Suite 金融ロボット: LaunchPad Market Expert - 取引を開始するために設計されています! これは、革新的で高度なアルゴリズムを使用して値を計算する取引ロボットであり、金融​​市場の世界でのアシスタントです。 SolarTrade Suite シリーズのインジケーター セットを使用して、このロボットを起動するタイミングをより適切に選択してください。 説明の下部にある SolarTrade Suite シリーズの他の製品をご覧ください。 投資と金融市場の世界を自信を持ってナビゲートしたいですか? SolarTrade Suite 金融ロボット: LaunchPad Market Expert は、情報に基づいた投資決定を行い、利益を増やすのに役立つ革新的なソフトウェアです。 SolarTrade Suite 金融ロボット: LaunchPad Market Expert の利点: - 正確な計算: 当社のロボットは、高度なアルゴリズムと分析方法を使用して、市場の動きを正確に予測します。 資産を売買するのに最適なタイミングを
##   ONLY GOLD ##   Тiльки Золото ## **Mercaria Professional Trading Zones - Complete Guide** ## **Mercaria Professional Trading Zones - Повний посібник** ### **How Mercaria Zones Work / Як працюють зони Mercaria** **English:** Mercaria Zones is an advanced trading indicator that identifies high-probability support and resistance areas using ZigZag extremes combined with mathematical zone calculations. The indicator works on multiple timeframes simultaneously, providing a comprehensive view
Bastion is a monitor-and-close-only risk manager for prop-firm traders. It watches your account against your firm's daily-loss and maximum-drawdown limits in real time and force-closes your open positions BEFORE you cross a line. It never opens a trade of its own, so it stays fully within the tools allowed by FTMO, FundedNext, The5ers, FTUK and FXIFY. Why traders fail challenges A large share of failed evaluations end on a single daily-loss breach: a moment of inattention, a news spike, one tra
TRI Visualizer Enhanced - 熱力学的市場分析の革命 概要 TRI(Thermal Range Indicator)Visualizer Enhanced は、従来のテクニカル分析を超越した、物理学の熱力学理論を応用した革新的なマーケット分析インジケーターです。市場の価格変動を「熱力学的エネルギー」として捉え、これまで見落とされていた市場の微細な変化を高精度で検出します。 革新的な仕組み 1. デュアル計算エンジン クラシックTRIモード 基本公式: |終値-始値| + (高値-安値) ローソク足の実体とヒゲを統合した純粋なボラティリティ測定 シンプルで直感的、あらゆる市場環境で安定動作 熱力学的TRIモード(独自開発) 価格加速度 :2次微分による価格変化の勢いを測定 出来高変化率 :相対的な出来高の変化を動的に評価 ポジションエネルギー :正規化された価格変動エネルギーを計算 熱力学的係数 :物理学の熱力学法則を市場分析に応用 2. 高度な平滑化システム SMA(単純移動平均) :基本的なノイズ除去 EMA(指数移動平均) :最新データ重視の平滑化
Headline ShikaaTraders Gold Grid Pro is a high-performance trade management utility designed specifically for XAUUSD (Gold) and high-volatility pairs. It allows traders to execute complex grid-layering strategies with a single click, ensuring you never miss an entry during fast market moves. Why Choose Gold Grid Pro? Manual trading on Gold requires speed. Manually calculating distances and opening multiple positions takes too much time. This utility automates the "Scaling-In" process, allowing y
Free Access for the First 10 Downloads! I'm giving away this panel completely free to the first 10 traders who download it. After that, a price will be added. If you're one of the lucky first 10, please leave an honest review and any questions you have – your feedback means the world to me. Thank you in advance! Overview Peril Trader is a trading panel designed to assist with the execution of a dual pending order breakout strategy. The panel places a Buy Stop order above the current market
FREE
Open Risk Budget Cap enforces a total open stop-loss risk budget across your account. It does not choose direction and does not open discretionary trades on a live chart. Attach it to one chart; the symbol and timeframe do not matter. What it measures Every open position and every pending order is priced to its stop-loss in account currency using OrderCalcProfit. Positions or orders without a stop-loss are counted and shown on the panel as "without stop-loss". They are excluded from the budget
EMA256 Fourier Cycle Trader EMA256 Fourier Cycle Trader is an advanced MetaTrader 5 Expert Advisor combining a long-term EMA or TEMA trend model, causal Fourier cycle analysis, configurable averaging and a unified basket take-profit system. The Expert Advisor is designed primarily for CENT accounts and for traders who understand basket recovery strategies, geometric lot progression and the risks associated with trading without a mandatory Stop Loss. RECOMMENDED STARTING CONFIGURATION Recommended
NRP Risk Manager Pro Institutional-Grade Trade Management & Prop Firm Protection Get the MetaTrader 4 Version Here: https://www.mql5.com/en/market/product/179888 Get the MetaTrader 5 Version Here: https://www.mql5.com/en/market/product/179885 Trading isn't just about finding the right entry; it is about flawlessly executing your edge while fiercely protecting your capital. NRP Risk Manager Pro is not an automated trading robot—it is a comprehensive, institutional-grade trade terminal d
このプロダクトを購入した人は以下も購入しています
Trade Assistant MT5
Evgeniy Kravchenko
4.43 (216)
取引 ごとのリスクの 計算、新規注文 の 簡単 な 設置、部分的 な 決済機能 を 持 つ 注文管理、 7 種類 のトレーリングストップなど 、便利 な 機能 を 備 えています 。 追加の資料と説明書 インストール手順   -   アプリケーションの手順   ライン機能 チャート上にオープニングライン、ストップロス、テイクプロフィットを表示します。この機能により、新規注文を簡単に設定することができ、注文を出す前にその特徴を確認することができます。   リスク計算 リスク計算機能は、設定されたリスクとストップロス注文のサイズを考慮して、新規注文のボリュームを計算します。ストップロスの大きさを自由に設定できると同時に、設定したリスクを守ることができます。 Lot calc ボタン - リスク 計算 を 有効 / 無効 にします 。 Risk フィールドでは 、必要 なリスクの 値 を 0 から 100 までのパーセンテージまたは 預金通貨 で 設定 します 。 設定」 タブで 、 リスク 計算 の 種類 を 選択 します :「 $ 通貨」、「 % 残高」、「 % エクイティ 」、「
Trade Manager EAへようこそ。これは、取引をより直感的、正確、そして効率的にするために設計された究極の リスク管理ツール です。これは単なるオーダー実行ツールではなく、包括的な取引計画、ポジション管理、リスク管理のためのソリューションです。初心者から上級者、迅速な実行を必要とするスキャルパーまで、Trade Manager EAはあらゆるニーズに対応し、為替、指数、商品、暗号通貨などさまざまな市場で柔軟に対応します。 Trade Manager EAを使用すると、複雑な計算が過去のものになります。市場を分析し、エントリーポイント、ストップロス、テイクプロフィットのレベルをチャート上のラインでマークし、リスクを設定するだけで、Trade Managerが最適なポジションサイズを即座に計算し、SLとTPをピップ、ポイント、口座通貨でリアルタイムに表示します。すべての取引が簡単かつ効果的に管理されます。 主な機能: ポジションサイズ計算機 :定義されたリスクに基づいて取引サイズを瞬時に決定します。 簡単な取引計画 :エントリー、ストップロス、テイクプロフィットを設定するためのド
Farmed Hedge Yield Farming | All Markets (Manual - Hybrid - Semi/Automated EA) VERIFIED TRADING RESULTS - Farmed Hedge Yield Axi Copy:  https://www.mql5.com/en/signals/2356376 - Farmed Hedge Yield Exn Copy:   https://www.mql5.com/en/signals/2356404 - Farmed Hedge Yield V Copy:  https://www.mql5.com/en/signals/2357156 IMPORTANT NOTICE: FarmedHedge is a MANUAL-FOCUSED TRADING UTILITY ,not a fully automated EA. Results shown on this Signal include manual trades and overall strategic management.
Telegram to MT5 Multi-Channel Copier   は、 Telegram と Discord チャンネルのトレードシグナルを MetaTrader 5 へ自動コピーします。ボット不要、ブラウザ拡張不要、手動コピー不要。Telegram や Discord にシグナルが届くと、EA が数秒であなたのターミナルに注文を出します。 さらに、チャンネルをコピーする前に、内蔵バックテスターでそのチャンネルがあなたの口座でどう動いたかを確認できます。 製品は 2 つのコンポーネントで構成されます:Telegram チャンネルを監視する Windows アプリと、MT5 ターミナルでシグナルを執行する本 EA です。MT4 版もあります   こちら . 購入前にお試しください:   アプリは無料でダウンロードできます。ご自身のチャンネルを接続し、各シグナルがどのように読み取られるかをご確認ください。Backtest タブと実際の取引には、購入またはレンタルした EA が必要です。このページの無料デモはストラテジーテスターでのみ動作し、テスターでは Telegram と D
自分の取引ルールで Telegram のシグナルをコピー Telegram to MT5 Signal Trader は、Telegram の公開・非公開チャンネルやグループから、テキスト形式の取引シグナルを MetaTrader 5 へ自動でコピーします。1つのデスクトップアプリで複数の配信者と MT5 口座を管理し、 配信者ごとにリスクと取引設定を個別に指定 できます。 シグナルのコピーに Telegram ボットや API 設定は必要ありません。 電話番号または QR コードでご自身の Telegram アカウントにログインし、すでに参加しているチャンネルやグループを選ぶだけです。ボットの作成や、Telegram API トークン、API ID、API hash の入力は不要です。 ポジションサイズを選び、複数の利確水準に分けて決済し、建値へのストップ移動やトレーリングストップを自動化できます。配信者のシグナルを受け取りながら、実際の取引方法は自分で管理できます。 本製品は、この MT5 エキスパートアドバイザ(EA)と、必須の Windows 連携アプリで構成されます。 インス
TradePanel MT5
Alfiya Fazylova
4.88 (170)
Trade Panelは多機能なトレーディングアシスタントです。アプリには手動取引用の50以上のトレーディング機能が搭載されており、ほとんどの取引作業を自動化することができます。 アプリの説明書: https://www.mql5.com/en/blogs/post/756482 デモ口座用アプリの試用版: https://www.mql5.com/en/blogs/post/750865 アプリのインストール方法: https://www.mql5.com/en/blogs/post/756239 アプリをビジュアルモードでテストする方法: https://www.mql5.com/en/blogs/post/770277 VPSのMetaTraderにアプリをインストールする方法: https://www.mql5.com/en/blogs/post/770190 取引。 ワンクリックで取引操作を行うことができます: リスクを自動計算して指値注文やポジションを開く。 複数の注文やポジションをワンクリックで開く。 注文のグリッドを開く。 保留中の注文やポジションをグループごとに閉じる
VirtualTradePad PRO SE MT5 — MetaTrader 5向けプロフェッショナル取引コントロールセンター VirtualTradePad PRO SE は、 MetaTrader 5 向けのプレミアムなチャートベースの取引パネルであり、トレード管理ワークスペースです。より速い執行、明確なポジション管理、構造化されたトレード管理、視覚的なレベル計画、そしてチャート上で完結するプロフェッショナルなワークフローを求めるトレーダー向けに設計されています。 これは単なる BUY / SELL パネルではありません。PRO SE は、手動取引、予約注文、ポジション管理、部分決済、バスケット損益管理、平均化レベル、ATMルール、シグナル監視、リアルタイム市場情報、ストラテジーテスター (Strategy Tester) ワークフロー、VPS向け運用を、1つの連携されたインターフェースに統合します。 MT4版 | 完全な説明とスクリーンショット | 購入方法 | インストール方法 | ログファイルの取得方法 | テストと最適化の方法 | Expforex のすべての製品 PRO
================================================================================ POC BREAKOUT - V20.72. Full Professional Grade Toolkit ================================================================================ POC Breakout is a full MetaTrader 5 trading dashboard for discretionary traders who want breakout signals, Point of Control (POC) context, volume profiles, order flow, market structure, news, alerts, and advanced trade planning in one professional workspace. Attached directly to you
REVDEN AI Desk:あなた自身の AI との一つの会話で、REVDEN のマーケットコンテキストをもとにトレードを運営する トレードのすべてを一つの会話で運営する姿を想像してみてください。 REVDEN AI Desk はそれを MetaTrader 5 にもたらします。あなた自身の AI に相場をどう読んでいるかを尋ねると、AI はあなたが取引する銘柄について REVDEN の完全なコンテキストをもとに答えます。銘柄の状態、リスク像、今後の指標発表まで含めてです。AI の提案はエントリー、ストップ、ターゲット、リスクとともに届き、合うものをあなたが承認します。ルールの変更も同じ方法です。変えたい点を書けば、AI が新しいルールブックの草案を作り、採用するかどうかはあなたが決めます。会話の周りには、マーケット全体が一つの画面にまとまっています。 デスクとセットアップガイドをご覧ください。 すべての画面、すべての設定、そしてあなた自身の AI との最初のステップ: stein.investments/products/revden-ai-desk AI との一つの会話、マーケッ
MT5 to Telegram Signal Provider は、Telegramのチャット、チャンネル、またはグループに 指定された シグナルを送信することができる、完全にカスタマイズ可能な簡単なユーティリティです。これにより、あなたのアカウントは シグナルプロバイダー になります。 競合する製品とは異なり、DLLのインポートは使用していません。 [ デモ ] [ マニュアル ] [ MT4版 ] [ Discord版 ] [ Telegramチャンネル ]  New: [ Telegram To MT5 ] セットアップ ステップバイステップの ユーザーガイド が利用可能です。 Telegram APIの知識は必要ありません。必要な全ては開発者から提供されます。 主な特長 購読者に送信する注文の詳細をカスタマイズする機能 例えば、Bronze、Silver、Goldといった階層型のサブスクリプションモデルを作成できます。Goldサブスクリプションでは、すべてのシグナルが提供されます。 id、シンボル、またはコメントによって注文をフィルターできます 注文が実行されたチャート
News Trade EA MT5
Konstantin Kulikov
4.55 (11)
僕自身が数年間使っている便利なロボットをご紹介します。半自動モードでも完全自動モードでもお使いいただけます。 >>> Chat <<< 当プログラムは経済指標カレンダーで発表されるニュースをもとにした取引の柔軟な設定が可能です。戦略テスターでは確認不可です。実際の取引のみです。 最新の設定アーカイブをダウンロードしてください: https://www.mql5.com/en/blogs/post/747929 シグナルモニタリング: https://www.mql5.com/en/signals/author/test-standart 当該エキスパート・アドバイザーのためのカスタマイズ設定セットを作る場合は、ブログの全パラメータの説明を参照してください :   https://www.mql5.com/en/blogs/post/748545 。 基本的なデフォルト設定について 一つのチャートからGBPとの通貨ペア(GBPUSD、EURGBP、GBPJPY、GBPCAD、GBPAUD、GBPCHF)で取引をします。GBPは最もボラティリティの高い通貨のため、取引が成功するチ
The Patch It never opens a trade. It walks behind the ones that did. Every open position, every pending order — checked twice a second for the one thing that's easy to forget: a stop, a target. Found bare, it doesn't ask. It writes the missing number in, measured in points from wherever the position began, and moves on to the next. No strategy, no opinion on direction. Just the quiet assumption that nothing should ever sit on the market unprotected — not because someone decided it shouldn't,
EA Overfitter
Stephen J Martret
5 (2)
That backtest looks great. But will it still be making money tomorrow, next week, next month? EA Overfitter re-runs your EA on 100 price histories it has never seen. One score tells you if the edge is real. A backtest tells you what an EA did on one price history — the one that happened to occur. What you cannot tell from it is how much of that result was the strategy and how much was the particular path. EA Overfitter answers that. It builds up to 100 synthetic price histories your EA has n
次回アップデート — バージョン 2.52 近日公開!【新機能】 市場分析とトレードワークフローを強化する、4つの主要な新機能にご期待ください 皆様のトレードニーズに応える4つの新機能により、市場分析を次のレベルへと引き上げます。新機能をご紹介します: 1. TRADE OVERVIEW DASHBOARD 2. CONFLUENCE AT ZONE 3. STRONG & WEAK HIGH/LOW 4. OTE 1. TRADE OVERVIEW DASHBOARD 市場全体の状況をより簡単に把握できるダッシュボードです。トレード判断をサポートするガイダンスを提供し、市場分析とトレード計画を体系的に行えるよう支援します。すべてを1つの画面で確認できます。 マルチタイムフレーム市場概要(Multi-Timeframe Market Overview) 市場の方向性と価格構造をより明確に把握 市場状況をすばやく確認 体系的な市場分析とエントリー計画のためのガイダンス 2. CONFLUENCE AT ZONE 価格が重要なゾーンに入るとき…いくつのサポート要因が一致しているかを確認で
The product will copy all telegram signal to MT5 ( which you are member) , also it can work as remote copier.  Easy to set up, copy order instant, can work with almost signal formats, image signal,  s upport to translate other language to English Work with all type of channel or group, even channel have "Restrict Saving Content", work with  multi channel, multi MT5 Work as remote copier: with signal have ticket number, it will copy exactly via ticket number. Support to backtest signal. How to s
RETAILBERG FOOTPRINT CHART PRO — Order-Flow Workspace for MetaTrader 5 Version 7.00  |  Professional System  |  31 tools  |  One chart A full 150-page illustrated User Manual is included. Please read the full manual to understand this feature packed footprint chart elements and ui. https://www.mql5.com/en/blogs/post/777982 DEMO / STRATEGY TESTER — PLEASE READ FIRST
25% discount on the release of the tool: only for the next 3 buyers Send a message to receive a demo version. AstroTrade Trading Assistant AstroTrade is a comprehensive multi-functional trading utility developed for the MetaTrader 5 platform. It integrates essential tools for trade execution, risk management, and technical monitoring into a single unified interface. The application is designed to assist traders in managing their daily operations through a visual and structured environment. Vi
Floor Watch
Syed Tauqeer Hussain Shah
Floor Watch One number, watched every thirty seconds: how far equity has fallen since the day began — or since its highest point, if it's told to trail the peak instead of the open. Cross the line and it doesn't argue. Every open position closes, every pending order vanishes, and anything that slips through afterward gets shut the moment it appears. Not asked. Removed. The floor holds until the clock turns 5 AM Pakistan time — then, and only then, does the day start over. One rule. No except

Power Candles Strategy Scanner - 自動最適化型マルチシンボル設定ファインダー パワーキャンドル・ストラテジー・スキャナーは 、パワーキャンドル・インジケーターを駆動するのと全く同じ自己最適化エンジンを、マーケットウォッチに登録されているすべての銘柄に対して並行して実行します。1つのパネルで、現在統計的に取引可能な銘柄、各銘柄で勝率の高い戦略、最適なストップロス/テイクプロフィットの組み合わせが表示され、新たなシグナルが発生した瞬間に通知が届きます。 このツールは、Stein Investmentsのエコシステムの一部です。  18種類以上のツールをすべて閲覧し、AIを活用したセットアップの推奨を受け取り、  https://stein.investments でコミュニティに参加しましょう 市場動向を網羅。銘柄ごとに3,000件以上の自動最適化。2種類のアラート。ワンクリックでチャートを切り替えて即座にアクション。 なぜこれが必要なのか 多くのマルチ銘柄スキャナーは、 価格の動き (ボラティリティ、変動率、銘柄ごとのRSI)を表示するだけです。それ
Trader Evolution
Siarhei Vashchylka
5 (7)
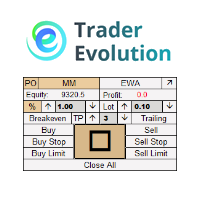
" Trader Evolution " - A utility designed for traders who use wave and technical analysis in their work. One tab of the utility is capable of money management and opening orders, and the other can help in making Elliott wave and technical analysis. Manual (Be sure to read before purchasing) | Version for MT4 Advantages 1. Trading in a few clicks. Immediate and pending orders are available in the panel 2. Money management. The program automatically selects the appropriate lot size 3. Simplifies
MT5 Professional Copy Trading System(MT5版) MT5 Professional Copy Trading System は、工業レベルの超高速 LOCAL トレードコピア であり、プロトレーダー、シグナル提供者、機関レベルのマルチアカウント運用のために設計されています。一般的なクラウド型やリテール向けコピーシステムとは異なり、本システムは同一 Windows 環境で動作することを前提とした LOCAL アーキテクチャに基づいて構築されています。 工業級 LOCAL アーキテクチャ LOCAL 設計により、同一 PC または同一 Windows VPS 上で稼働する複数のターミナル間で、低遅延かつ高い安定性を実現します。不要なネットワーク依存を減らすことで、より高速な同期、正確な約定、Master と Receiver 間の高い一貫性を確保できます。これは高頻度取引や 24/7 無人運用に適した環境を提供します。 Master / Slave / Self-Copier + Cross Copy(MT4 ↔ MT5) MT5 版は Master
YuClusters
Yury Kulikov
4.93 (43)
Attention: You can view the program operation in the free version  YuClusters DEMO .  YuClusters is a professional market analysis system. The trader has unique opportunities to analyze the flow of orders, trade volumes, price movements using various charts, profiles, indicators, and graphical objects. YuClusters operates on data based on Time&Sales or ticks information, depending on what is available in the quotes of a financial instrument. YuClusters allows you to build graphs by combining da
DrawDown Limiter
Haidar Lionel Haj Ali
5 (23)
DrawDown Limiter v5.0 — 高度な口座保護コントローラー DrawDown Limiter v5.0 は、取引口座を監視し、設定されたリスク、利益、ニュース、スケジュール、ロールオーバー、またはポジション数の制限に達した際に自動的に対応する、クライアント側で動作する口座保護コントローラーです。 1つの専用チャートから、 手動取引、自動売買戦略、複数のExpert Advisor、指値・逆指値注文、保有ポジション を監視できます。口座全体を保護することも、Magic Numberを使用して特定のEAまたは複数のEAのみを監視することもできます。 DrawDown Limiter の目的は、単にドローダウンを表示することではありません。 設定した取引ルールを積極的に適用し 、保護条件が有効である限り、そのルールを継続的に実行することを目的としています。 DrawDown Limiter v5.0 は、損失額だけを監視するのではなく、戦略がいつ取引を継続できるのか、どのエクスポージャーを維持できるのか、いつ取引を停止すべきか、そして自動売買環境をいつ安全に再開できるのかま
Your EAs cannot see each other, but Anchor can. Anchor gives you one place to coordinate your EAs, manage risk, and decide when trading is allowed. It works alongside the trading bots you already use without any changes to them. The Problem One EA opens a trade. Then another starts trading. The next thing you know, you wake up to multiple grids built across your account. Each EA may be doing exactly what it was designed to do, but together they can place far more risk on your account than you in
Master Your Trading Discipline   Stop losing your hard-earned gains to overtrading and emotional decisions. The Discipline Tool is your ultimate trading assistant, ensuring strict risk management in real-time. Key Protection Features: Advanced Drawdown Defense : Automatically halts trading if your daily drawdown exceeds a preset threshold (percentage or dollar amount). Real-Time Equity Lock : Safeguard profits by referencing peak equity, ensuring drawdown stays within control. Hard Profit Target
Grid Manual MT5
Alfiya Fazylova
4.7 (23)
「Grid Manual」は、注文のグリッドを操作するための取引パネルです。 ユーティリティはユニバーサルで、柔軟な設定と直感的なインターフェイスを備えています。 それは、損失を平均化する方向だけでなく、利益を増やす方向でも注文のグリッドで機能します。 トレーダーは注文のグリッドを作成して維持する必要はありません。 すべてが「Grid Manual」によって行われます。 注文を開くだけで十分であり、「Grid Manual」は注文のグリッドを自動的に作成し、非常に閉じるまでそれに付随します。 完全な説明とデモバージョン ここ。 ユーティリティの主な機能と機能 ユーティリティは、モバイル端末から開かれた注文を含め、あらゆる方法で開かれた注文を処理します。 「制限」と「停止」の2種類のグリッドで機能します。 グリッド間隔の計算には、固定と動的(ATRインジケーターに基づく)の2つの方法で機能します。 オープンオーダーグリッドの設定を変更できます。 チャート上の各注文グリッドの損益分岐点を表示します。 各注文グリッドの利益率を表示します。 ワンクリックでグリッドから収益性の高い注文を閉じるこ
Dealer's Panel No signal decides anything here — a hand does. One click, and the panel calculates what's underneath: lot size from risk, target from a 30-step balance ladder that remembers exactly how far an account has climbed. Toggle between market and pending without touching an input field. Set a stop, and the take-profit can write itself — a fixed share of the balance, translated into price with no arithmetic left for the trader to get wrong. One trade live at a time; it won't let a seco
My Chart Generator
Trade The Volume Waves Single Member P.C.
5 (1)
What if your chart adapted to the market instead of the clock?   THE PROBLEM IT SOLVES   Instead of trying to find the best indicator that fits your timeframe chart, build a chart and find the most appropriate indicator.   My Chart Generator is a MetaTrader 5 background service that builds  live, fully historical three types of custom charts :1. Range/Volume Balanced chart, 2.  Range/Volume Absorption chart and 3. Constant Volume chart from any symbol — Forex pairs, crypto, indices, commodities,
Auto DCA EA
Truong Giang Hoang
5 (1)
All new interface and function Add telegram notify (you have to get Telegram bot API and chat ID). With this ea, you can earn 10-40% even more profit/month! 1. This EA is used to automatically take profit or DCA your orders on MT5 according to the parameters you set. You can enter first order on your phone or MT5 terminal on your computer and it automatically take profit or DCA your orders. 2. Enter buy/sell limit-stop price * Buy limit price/ Sell limit price/ Buy stop price/ Sell stop price:
Trade Manager は、リスクを自動的に計算しながら、取引を迅速に開始および終了するのに役立ちます。 過剰取引、復讐取引、感情的な取引を防止する機能が含まれています。 取引は自動的に管理され、アカウントのパフォーマンス指標はグラフで視覚化できます。 これらの機能により、このパネルはすべてのマニュアル トレーダーにとって理想的なものとなり、MetaTrader 5 プラットフォームの強化に役立ちます。多言語サポート。 MT4バージョン  |  ユーザーガイド + デモ Trade Manager はストラテジー テスターでは機能しません。 デモについてはユーザーガイドをご覧ください。 危機管理 % または $ に基づくリスクの自動調整 固定ロットサイズを使用するか、ボリュームとピップに基づいた自動ロットサイズ計算を使用するオプション RR、Pips、または価格を使用した損益分岐点ストップロス設定トレーリングストップロス設定 目標に達したときにすべての取引を自動的に終了するための 1 日あたりの最大損失 (%)。 過度のドローダウンからアカウントを保護し、オーバートレードを防ぎます
作者のその他のプロダクト
When your indicator changes direction, do you know what price does next? Does your indicator tend to move before price, after it, or within the same observation window? Do you know how responsive your indicator is across symbols, timeframes, and market periods? IndicatorLab MT4 can help with that! IndicatorLab MT4 is a utility that samples indicator values alongside price and analyzes their movement and timing relationships, presenting the results in clear HTML reports built from CSV data chec
フィルタ:
レビューなし
レビューに返信