SuperTrend Signals
- インディケータ
- Quang Huy Quach
- バージョン: 1.0
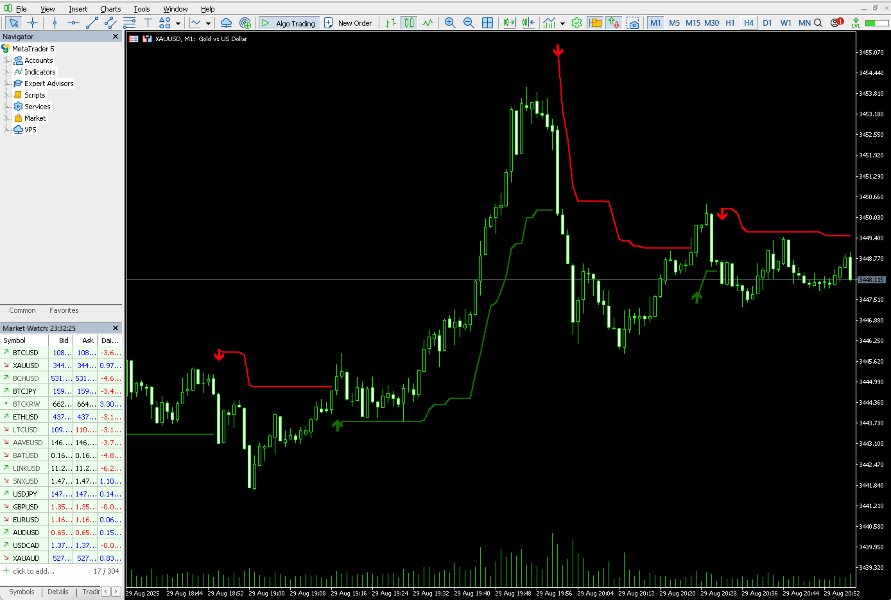
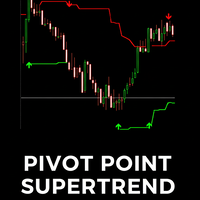
The Supertrend indicator is a trend-following technical analysis tool designed to help traders identify the direction of market trends and potential entry/exit points. It operates based on price data and Average True Range (ATR) to create a dynamic signal line that changes color depending on the current trend.
- Green color: Indicates an uptrend.
- Red color: Indicates a downtrend.
Supertrend is a useful indicator for both short-term and long-term trading, helping to filter out market noise and focus on the main direction of price.
How Supertrend Works
Supertrend calculates two main lines: the Upper Band and the Lower Band, based on the average price (usually (High + Low) / 2 ) and the ATR value.
- Upper Band: Calculated as Average Price + (Multiplier * ATR) .
-
Lower Band: Calculated as Average Price - (Multiplier * ATR) .
The actual Supertrend line will switch between the Upper and Lower bands depending on price action.
-
When the closing price crosses above the red Supertrend line, the indicator will turn green, and the Supertrend line will move below the price.
- When the closing price falls below the green Supertrend line, the indicator will turn red, and the Supertrend line will move above the price.
Input Parameters
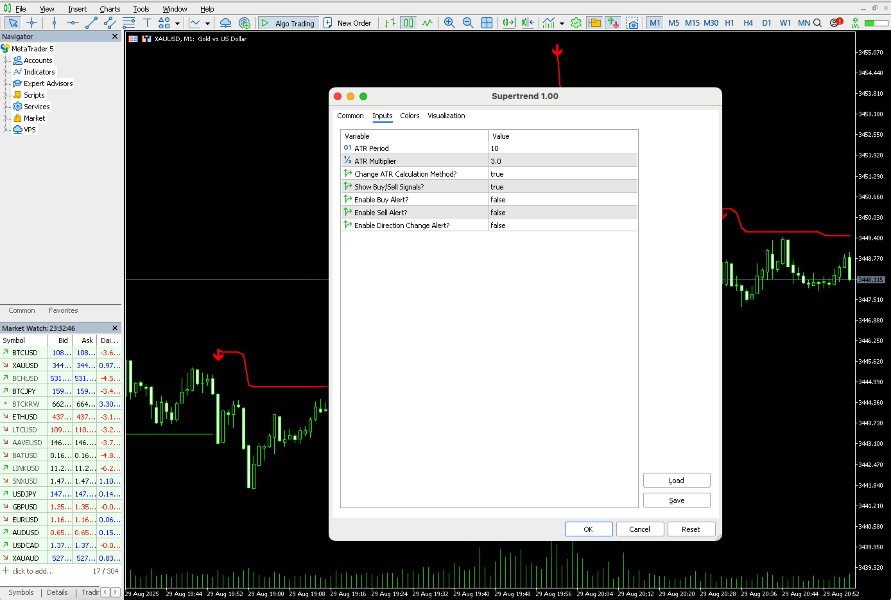
Your Supertrend indicator has customizable parameters to suit your trading strategy and asset pair:
- ATR Period :
- Description: The number of bars used to calculate the ATR value. ATR measures market volatility.
- Application:
- Smaller values (e.g., 7-10): Make the indicator more sensitive to price changes, potentially generating more signals but also more susceptible to noise.
- Larger values (e.g., 14-20): Make the indicator smoother, generating fewer signals but with higher reliability.
- Multiplier :
- Description: This value is multiplied by the ATR to determine the distance of the Supertrend line from the price.
- Application:
- Smaller values (e.g., 2.0-2.5): The Supertrend line will be closer to the price, generating earlier signals but also more prone to false breakouts.
- Larger values (e.g., 3.0-3.5): The Supertrend line will be further from the price, generating later signals but less susceptible to minor fluctuations.
- changeATR (Change ATR Calculation Method?):
- Description: If true (default), the indicator uses MetaTrader 5's standard ATR calculation (based on RMA - Relative Moving Average, similar to EMA). If false , it uses the SMA (Simple Moving Average) method of True Range, as in the original Pine Script.
- Application: This option allows you to fine-tune how ATR is smoothed, affecting the overall sensitivity of the indicator.
- showsignals (Show Buy/Sell Signals?):
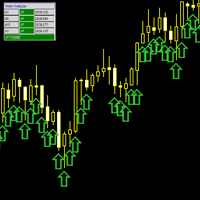
- Description: If true , buy (green arrow) and sell (red arrow) signal arrows will appear on the chart when Supertrend changes direction.
- Application: Helps visualize trend reversal points.
- enableBuyAlert (Enable Buy Alert?):
- Description: If true , an alert will appear when a buy signal occurs.
- Application: Notifies you immediately of potential buying opportunities.
- enableSellAlert (Enable Sell Alert?):
- Description: If true , an alert will appear when a sell signal occurs.
- Application: Notifies you immediately of potential selling opportunities.
- enableChangeAlert (Enable Direction Change Alert?):
- Description: If true , an alert will appear whenever Supertrend changes direction (from uptrend to downtrend or vice versa).
- Application: Useful for monitoring overall trend shifts, even if you're not trading every specific buy/sell signal.
Trade Application
Supertrend is a powerful indicator for trend identification and trade management.
Identifying Trends
- Uptrend: When the Supertrend line is green and located below the price. This indicates that buying pressure is dominant.
- Downtrend: When the Supertrend line is red and located above the price. This indicates that selling pressure is dominant.
Entry Signals
- Buy Signal:
- When the Supertrend line changes from red to green and the closing price crosses above the Supertrend line.
- A green arrow appears (if showsignals is enabled).
- Application: This is a signal to consider opening a long position.
- Sell Signal:
- When the Supertrend line changes from green to red and the closing price falls below the Supertrend line.
- A red arrow appears (if showsignals is enabled).
- Application: This is a signal to consider opening a short position.
Exit Signals & Risk Management
One of Supertrend's most powerful applications is as a dynamic risk management tool.
- Exit Buy Order/Set Stop Loss:
- When you hold a buy position and the Supertrend line changes from green to red (a sell signal appears).
- Application: This is a signal to close your buy position or to move your stop loss above the green Supertrend line as the price rises. The Supertrend line acts as a trailing stop, helping you protect profits as the trend continues.
- Exit Sell Order/Set Stop Loss:
- When you hold a sell position and the Supertrend line changes from red to green (a buy signal appears).
- Application: This is a signal to close your sell position or to move your stop loss below the red Supertrend line as the price falls.
Combining with Other Indicators
While Supertrend is a powerful indicator, it should not be used in isolation. Combine it with other analytical tools to enhance signal reliability:
- Trend Confirmation: Use other trend indicators like Moving Averages or ADX to confirm the strength of the trend.
- Entry/Exit Confirmation: Use Oscillators like RSI, Stochastic, or MACD to look for divergence or overbought/oversold conditions at Supertrend signal points.
- Support and Resistance: Combine with key support and resistance zones to identify potential reversal points.
Detailed Usage in MetaTrader 5
Attaching the indicator to a chart
- Open MetaTrader 5.
- In the "Navigator" window (Ctrl+N), find the "Indicators" section.
- Drag and drop the "Supertrend" indicator onto the chart you wish to analyze.
Configuring parameters
- After dragging the indicator onto the chart, a "Properties" window will appear.
- Go to the "Inputs" tab.
- Here, you can adjust parameters such as ATR Period , Multiplier , changeATR , showsignals , enableBuyAlert , enableSellAlert , and enableChangeAlert as desired.
- Click "OK" to apply the changes.
Enabling/Disabling alerts
- In the indicator's "Properties" window (right-click on the indicator on the chart and select "Properties").
- Go to the "Inputs" tab.
- Check (tick) the box next to enableBuyAlert , enableSellAlert , or enableChangeAlert to enable the corresponding alert. Uncheck to disable.
- Click "OK".
- When an alert is triggered, a dialog box will appear on your MT5 screen.
Important Notes
- Sideways/Choppy Markets: Supertrend performs poorly in sideways or non-trending markets. It can generate many false signals under these conditions.
- Lagging Indicator: Like most trend-following indicators, Supertrend is a lagging indicator. It confirms a trend after it has already begun, rather than predicting it.
- Backtesting: Always perform backtesting of the indicator with different parameters on historical data of your traded asset pair to find the optimal settings for your strategy.

