VIX Fix Market Reversal
- インディケータ
- バージョン: 1.30

The Vix_Fix indicator, or "Vix Fix," is a tool designed to identify potential market bottoms. It operates on the principle of measuring extreme fear or pessimism among the crowd, which are moments when the market often has a high probability of reversing to the upside.
Main Purpose: To help traders find high-probability BUY (Long) entry points by identifying when the market is "oversold."
How it Works
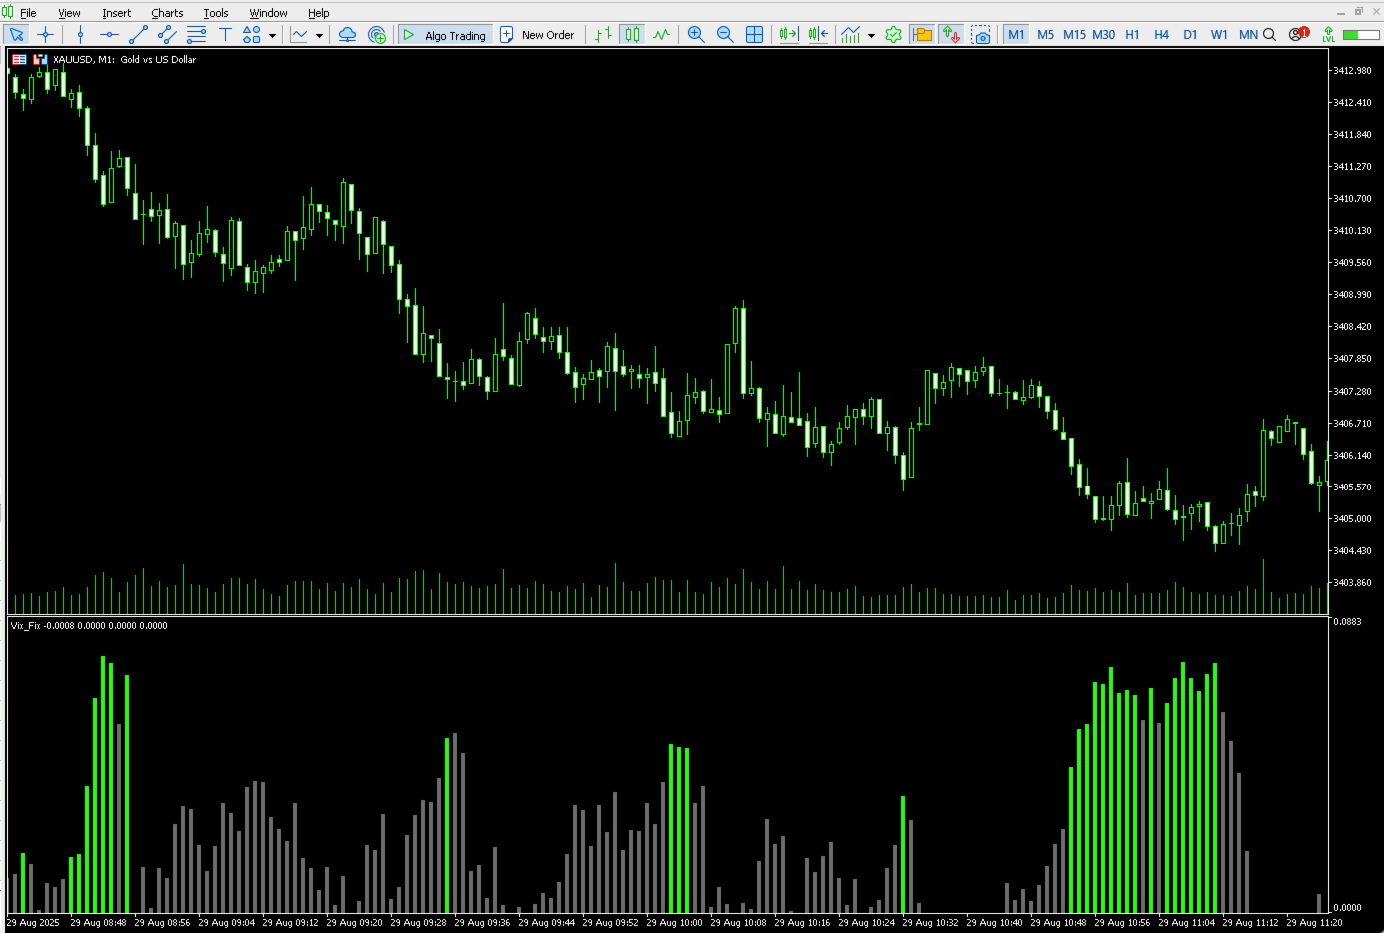
In simple terms, the Vix Fix measures the distance between the current bar's Low and the Highest Closing price over a recent lookback period (default is 22 bars).
- When the market drops sharply, the current low will be very far from the recent peak. This pushes the Vix Fix indicator's value higher.
- A high Vix Fix value suggests that panic is setting in. History has shown that the moments of greatest panic are often the best buying opportunities.
The indicator uses two dynamic thresholds to identify a signal:
- The Upper Bollinger Band (aqua line): A volatility-based threshold based on standard deviation.
- The Range High Percentile (orange line): A threshold based on the highest value over a longer period.
When the Vix Fix histogram crosses above either of these thresholds, it turns green, signaling a potential opportunity.
Installation and Settings
Installation
- Copy the .ex5 file into the MQL5\Indicators folder within your MT5 installation directory.
- Open MT5, go to the View -> Navigator menu.
- Right-click on Indicators and select Refresh .
- Find the indicator in the list and drag it onto a chart.
Input Parameters
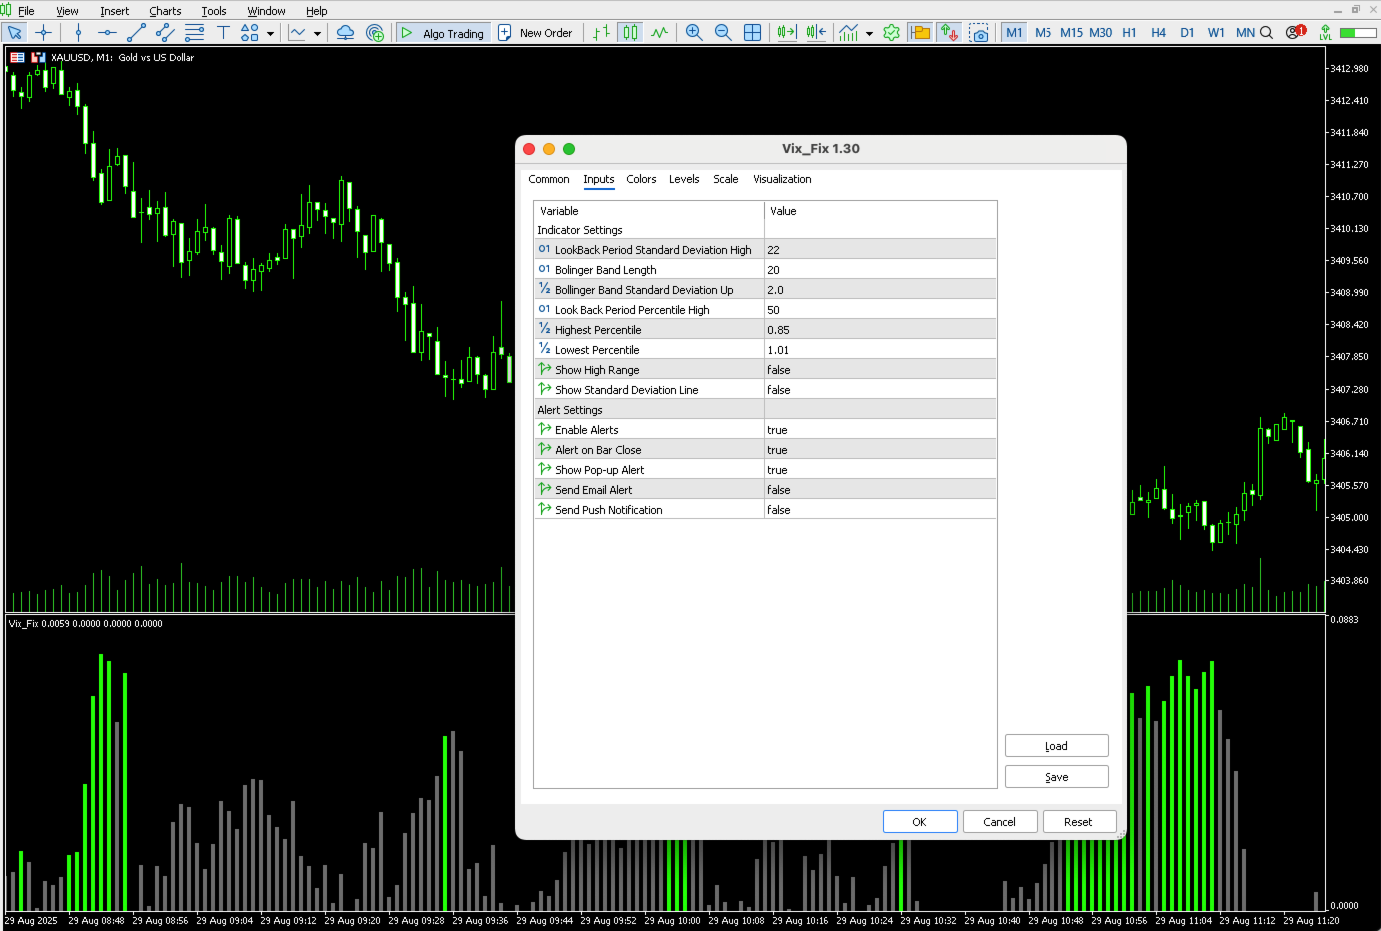
Indicator Settings
- LookBack Period Standard Deviation High (pd) : The lookback period for finding the highest close. Default is 22. Increasing this value makes the indicator less sensitive; decreasing it makes it more sensitive.
- Bolinger Band Length (bbl) : The period for calculating the Bollinger Band. Default is 20.
- Bollinger Band Standard Devaition Up (mult) : The standard deviation for the Bollinger Band. Default is 2.0. Increasing this value will raise the signal threshold, leading to fewer but potentially more reliable signals.
- Look Back Period Percentile High (lb) : The period for calculating the orange Percentile line. Default is 50.
- Highest Percentile (ph) : The percentage level for the Percentile line. Default is 0.85 (i.e., 85%).
- Show High Range (hp) : Toggles the visibility of the orange line.
- Show Standard Deviation Line (sd) : Toggles the visibility of the aqua Bollinger Band line.
Alert Settings
- EnableAlerts : Enables or disables all types of alerts.
- AlertOnNewBar : Alerts only once when the signal bar has closed. It is highly recommended to keep this true to avoid continuous alerts on the current, developing bar.
- AlertNative : Enables the pop-up alert box in MT5.
- AlertEmail : Enables email alerts (requires email configuration in MT5).
- AlertPush : Enables push notifications to your phone (requires MetaQuotes ID configuration).
How to Apply in Trading
The Primary Buy Signal
The core and only signal from this indicator is when the histogram turns GREEN.
This signifies that fear in the market has reached an extreme level, and a bottom is likely being formed.
Suggested Trading Strategy
-
Identify the Signal: Wait for a green histogram bar to appear. For safety, wait for the bar to close to confirm the signal.
-
Seek Confirmation (Crucial!): NEVER enter a trade based solely on the Vix Fix signal. Combine it with at least one of the following factors to increase the probability of success:
- Price Action: Does the green signal coincide with a bullish reversal candlestick pattern (e.g., Hammer, Bullish Engulfing, Morning Star)?
- Support/Resistance: Is the green signal occurring at a known historical support level?
- Divergence: Does the price make a new low while the Vix Fix indicator makes a lower high? This is a bullish divergence and strengthens the case for a reversal.
-
Entry: After getting a green signal and a confirmation factor, you can consider entering a BUY (Long) position.
-
Stop Loss: Place a logical stop loss, for instance, below the low of the signal candle or below the nearest support zone.
-
Take Profit: Set a take profit target at the nearest resistance level or use a reasonable Risk:Reward ratio (e.g., 1:2, 1:3).
Example:
- The market is in a downtrend.
- A green histogram bar appears on the Vix Fix indicator.
- Simultaneously, a Hammer candle forms right on top of a major support level.
- This is a high-probability trading setup. You could enter a BUY order on the close of the Hammer candle, placing a Stop Loss below the Hammer's tail.