MTF Candles Overlay MT5

MTF Candles Overlay

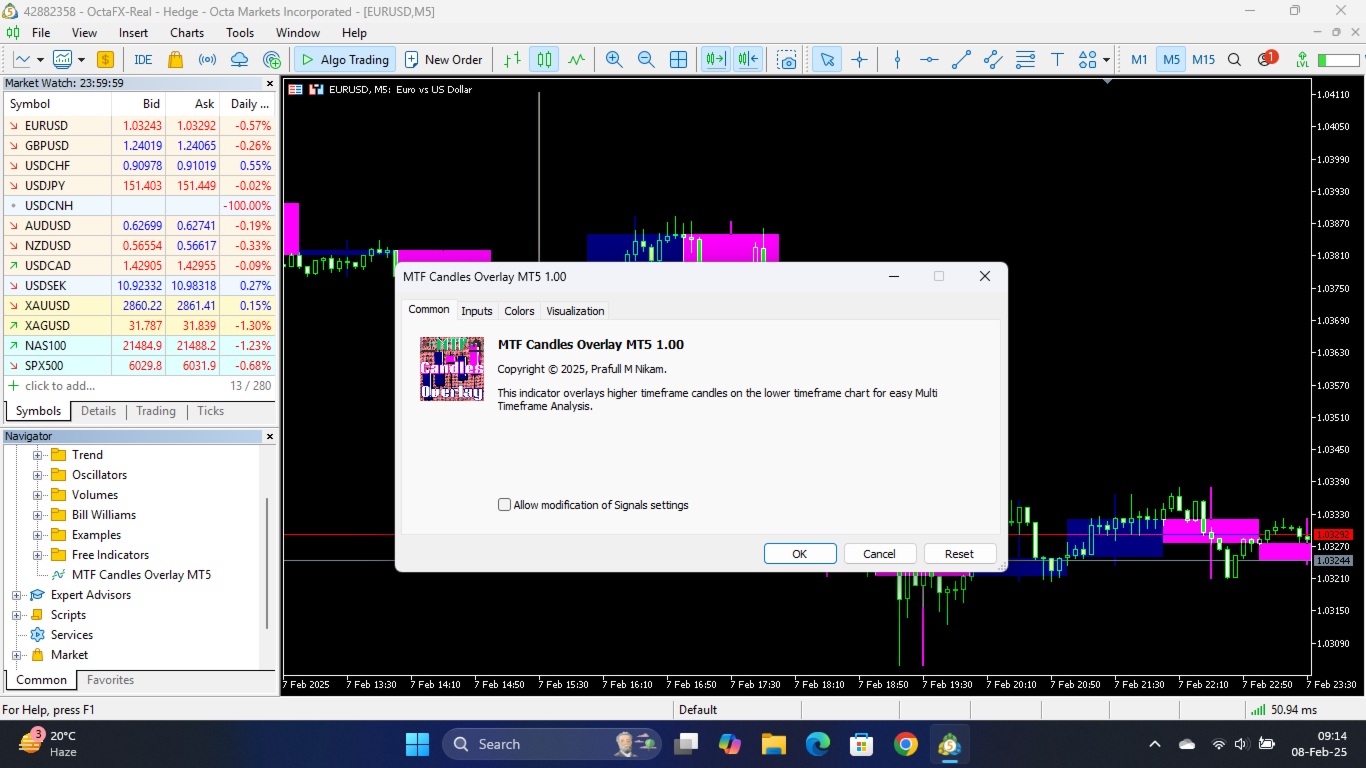
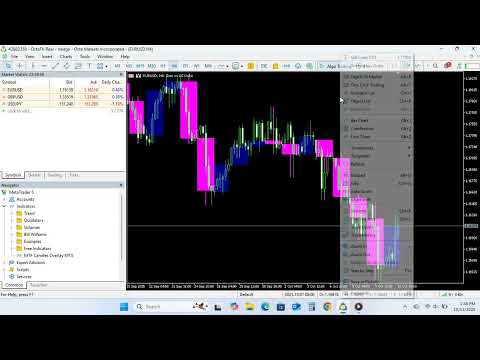
View higher timeframe candles directly on your current chart without switching between multiple windows.

MTF Candles Overlay displays complete higher timeframe candles (OHLC, body and wicks) as an overlay on any chart, allowing you to analyze market structure, trend direction and key price levels from multiple timeframes at the same time.

Includes support for all standard MetaTrader timeframes plus a unique Yearly (Y1) timeframe for long-term market analysis.

Key Features

Multi-Timeframe Visualization

Display higher timeframe candles directly on your active chart.

Supported Timeframes:

  • M1, M2, M3, M4, M5, M6

  • M10, M12, M15, M20, M30

  • H1, H2, H3, H4, H6, H8, H12

  • D1

  • W1

  • MN1

  • Y1 (Yearly)

Yearly Candle Support

Analyze long-term market structure using yearly candles aggregated from historical daily data.

Ideal for:

  • Position traders

  • Long-term investors

  • Market cycle analysis

  • Major support and resistance identification

Complete Candle Structure

Displays:

  • Open

  • High

  • Low

  • Close

  • Candle body

  • Candle shadows (wicks)

Each overlay candle accurately represents the selected higher timeframe.

Fully Customizable

Customize the appearance to match your trading environment:

  • Bull candle color

  • Bear candle color

  • Filled or outlined candle bodies

  • Wick visibility

  • Border thickness

  • Number of candles displayed

Real-Time Updates

The overlay updates automatically as new higher timeframe candles develop.

Optimized Performance

Efficient rendering designed for smooth operation even when displaying large numbers of candles.

Trading Applications

Multi-Timeframe Analysis

  • View higher timeframe structure without changing charts

  • Identify trend direction faster

  • Spot major support and resistance levels

  • Confirm lower timeframe trading signals

Entry Timing

Use lower timeframe precision while maintaining awareness of higher timeframe market structure.

Risk Management

  • Place stop losses around higher timeframe highs and lows

  • Identify logical profit targets

  • Avoid trading against dominant higher timeframe trends

Strategic Planning

Different timeframes serve different purposes:

  • H1 / H4 for intraday trading

  • D1 for swing trading

  • W1 and MN1 for position trading

  • Y1 for long-term market analysis

Input Parameters

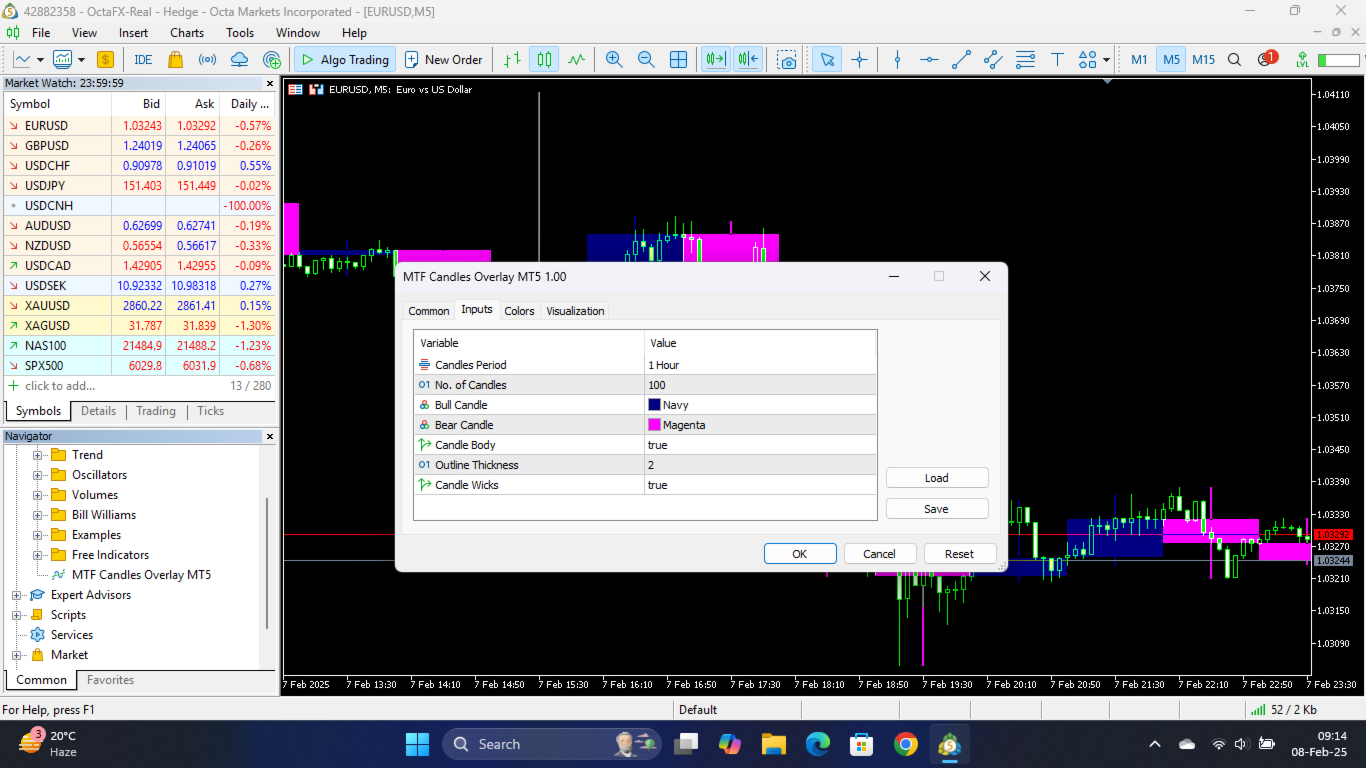
Higher Timeframe

Select the timeframe to display.

Default: H1

Number of Candles

Choose how many higher timeframe candles to display.

Default: 100

Bull Candle Color

Color used for bullish candles.

Bear Candle Color

Color used for bearish candles.

Fill Candle Body

Enable or disable candle body filling.

Default: True

Outline Thickness

Controls the thickness of candle borders and wicks.

Default: 2

Display Shadows

Show or hide candle wicks.

Default: True

Why Use MTF Candles Overlay?

✓ View higher timeframe price action without chart switching

✓ Improve multi-timeframe analysis

✓ Unique Yearly (Y1) timeframe support

✓ Fully customizable appearance

✓ Clean and professional visualization

✓ Accurate historical and real-time candle representation

✓ Works on all symbols and markets

Important

The selected timeframe must be equal to or higher than the current chart timeframe.

Examples:

✓ Display H4 candles on an M15 chart

✓ Display D1 candles on an H1 chart

✓ Display Y1 candles on a Weekly chart

✗ Display M15 candles on an H4 chart
おすすめのプロダクト
Heiken_Ashi_Bars - MT5用 高度なトレンド可視化ツール 概要 Heiken_Ashi_Bars は、市場のノイズを取り除き、真のトレンドを浮き彫りにするために設計された、強力で視覚的に直感的なカスタムインジケーターです。従来のローソク足チャートは不規則な動きが多く、ダマシのシグナルにつながることがよくあります。価格データを平均化することで、このインジケーターはプライスアクションを滑らかにし、トレンドの継続、反転、および利益の出るエントリーポイントを非常に簡単に見つけることができます。 主な機能と利点 究極のノイズリダクション: 小さな価格のスパイクや持ち合いのノイズをフィルタリングします。 明確な視覚的シグナル: 色分けされたバーにより、強気および弱気のモメンタムを一目で確認できます。 リペイントなし (No Repaint): バーが確定するとシグナルは固定され、過去のバーを再計算しません。 高度に最適化: ターミナルの遅延をゼロにするクリーンなコード。 多用途: すべての金融商品 (FX、インデックス、貴金属、仮想通貨) で完璧に機能します。 トレード方法 上昇
IC Flat Pro The True Math
Aruncharan Ganapathy Sivakumar
IC FLAT PRO – THE TRUE MATH   Early Adopter Pricing Secure IC FLAT PRO – THE TRUE MATH at the current launch price. Once the first 10 purchases  have been sold, the price will increase by USD 300 . Institutional-Grade Market Structure Analysis for MetaTrader 5 IC FLAT PRO – THE TRUE MATH is a premium institutional-grade market structure indicator developed for serious traders who demand precision, consistency, and high-quality trade opportunities. Built using advanced mathematical algorithms
CosmiCLab SMC FIBO CosmiCLab SMC FIBO is a professional trading indicator designed for traders who use Smart Money Concepts (SMC), market structure analysis and Fibonacci retracement levels. The indicator automatically detects market swings and builds Fibonacci levels based on the latest impulse movement. It also identifies market structure changes such as BOS (Break of Structure) and CHOCH (Change of Character), helping traders understand the current market direction. CosmiCLab SMC FIBO also pr
TRI Visualizer Enhanced - 熱力学的市場分析の革命 概要 TRI(Thermal Range Indicator)Visualizer Enhanced は、従来のテクニカル分析を超越した、物理学の熱力学理論を応用した革新的なマーケット分析インジケーターです。市場の価格変動を「熱力学的エネルギー」として捉え、これまで見落とされていた市場の微細な変化を高精度で検出します。 革新的な仕組み 1. デュアル計算エンジン クラシックTRIモード 基本公式: |終値-始値| + (高値-安値) ローソク足の実体とヒゲを統合した純粋なボラティリティ測定 シンプルで直感的、あらゆる市場環境で安定動作 熱力学的TRIモード(独自開発) 価格加速度 :2次微分による価格変化の勢いを測定 出来高変化率 :相対的な出来高の変化を動的に評価 ポジションエネルギー :正規化された価格変動エネルギーを計算 熱力学的係数 :物理学の熱力学法則を市場分析に応用 2. 高度な平滑化システム SMA(単純移動平均) :基本的なノイズ除去 EMA(指数移動平均) :最新データ重視の平滑化
RBreaker Gold Indicatorsは、金先物の短期日内取引戦略であり、トレンドフォローと日内反転の2つの取引手法を組み合わせたものです。トレンド相場での利益を捉えるだけでなく、相場が反転した際には迅速に利確し、その流れに沿ってポジションを反転させることができます。 この戦略は、アメリカの雑誌『Futures Truth』において、15年連続で最も収益性の高い取引戦略トップ10に選ばれた実績を持ち、非常に長いライフサイクルを誇り、現在も国内外で広く使用・研究されています。 本インディケーターは、2026年の金先物の値動きに対応し、14日間のATR指標に基づいて、ブレイクアウト係数A、観察係数B、リバーサル係数Rをより合理的な値で定義しています。非常に優れたインディケーターであり、安定的な年間収益を実現しています。ぜひおすすめします〜
GDS Renko Pip ST Chart - Pip-Based Renko Chart Indicator for MetaTrader 5 GDS Renko Pip ST Chart is a pip-based Renko chart indicator for MetaTrader 5. It helps traders build and study cleaner Renko price movement using a practical fixed pip or point-based brick structure. This tool is designed as a Renko chart foundation for manual analysis. It does not predict the market, does not generate buy or sell signals and does not decide whether a trade should be opened. Renko EDGE EA Golden Delta | A
Gfx Institutional Order Flow Pro MT5 v3.02   Live results:  https://www.mql5.com/en/ Advanced Institutional Order Flow Analytics — analyzes market structure, liquidity, order blocks, imbalances, and institutional trading conditions. Adaptive Institutional Intelligence — dynamically evaluates market conditions and setup quality using multi-factor institutional analytics. Multi-Timeframe Market Confirmation — combines structure and directional information across multiple timeframes for stronger
BUY and SELL smart The BUY and SELL Smart Indicator is a next-generation trading tool engineered for precision scalpers, intraday strategists, and professional analysts who demand both speed and clarity in market visualization. It seamlessly integrates smart candle-based analytics, adaptive ATR logic, and real-time economic event awareness — giving you a fully synchronized view of market volatility and momentum. Through an elegant and optimized interface, FlashScalp delivers   instant signal fee
The Accumulation / Distribution is an indicator which was essentially designed to measure underlying supply and demand. It accomplishes this by trying to determine whether traders are actually accumulating (buying) or distributing (selling). This indicator should be more accurate than other default MT5 AD indicator for measuring buy/sell pressure by volume, identifying trend change through divergence and calculating Accumulation/Distribution (A/D) level. Application: - Buy/sell pressure: above
GDS Renko Pip ST - Fixed Brick Renko Chart Tool for MetaTrader 5 GDS Renko Pip ST is a Renko chart tool for MetaTrader 5 designed for traders who want to build and study fixed brick Renko movement using a practical pip or point-based setup. The purpose of this tool is simple: create a cleaner Renko structure so the trader can observe direction, brick runs, pullbacks, support and resistance behavior without normal candle noise. This is not a signal indicator and it does not predict the market. It

RSI Divergence Risk Target Signals RSI Divergence Risk Target Signals is a MetaTrader 5 indicator that detects confirmed bullish and bearish RSI divergence and combines the signals with optional trend filters, ATR-based Stop Loss levels, three Take Profit targets, alerts and an internal trade statistics dashboard. The indicator compares confirmed RSI pivot structure with corresponding price highs and lows. It is designed to help traders identify momentum divergence while providing a structure
MarketPredict Pro – 高度な多層型マーケット分析システム   仕組み MarketPredict Pro は、6つの独立した分析レイヤーを組み合わせ、次のローソク足を高精度で予測します。   6つの分析レイヤー Buyers/Sellers Pressure   – 買い手と売り手の強さを測定 Trend Strength   – SMA(20) によるトレンド強度計算 Volatility   – ATR に類似した14期間のボラティリティモデル Market Pressure   – 直近5本のローソク足の累積市場圧力 Prediction Engine   – 多因子による次のローソク足予測 Real‑time Panel   – リアルタイム市場統計パネル   技術アルゴリズム   圧力計算モデル 出来高、方向性、価格変動を組み合わせた加重圧力分析。   統計的精度 STRONG シグナル:   82–87% NORMAL シグナル:   73–78% SIDEWAYS / UNCERTAIN:   65–70%  
HAS RSI Signal — SL/TP自動計算機能付き プロフェッショナル・トレンドインジケーター HAS RSI Signal は、信頼性の高いクラシックな手法と最新のノイズ除去アルゴリズムを融合させた強力なトレーディングツールです。 平均足スムーズド(Heiken Ashi Smoothed) と RSI を組み合わせることで、トレンドの転換点や買われすぎ・売られすぎ圏からの脱出タイミングを正確に捉え、明確なエントリーシグナルを提示します。 主な特徴: 二重のフィルタリング: 平均足スムーズドで市場の「ノイズ」を除去し、RSIで勢い(モメンタム)の強さを確認します。 損切り・利確ラインの自動計算: 単にシグナルを出すだけでなく、ボラティリティ( ATR )に基づいた最適なストップロス(SL) と テイクプロフィット(TP)を自動で算出します。 視覚的な分かりやすさ: シグナルはチャート上にカラーキャンドルとして表示されるため、一目でトレンドを把握でき、取引画面をスッキリと保てます。 充実の通知機能: アラート、音声、スマートフォンへのプッシュ通知機能を搭載。チャンスを逃すこと
Price Magnet — Price Density and Attraction Levels Indicator Price Magnet is a professional analytical tool designed to identify key support and resistance levels based on statistical Price Density. The indicator analyzes a specified historical period and detects price levels where the market spent the most time. These zones act as “magnets,” attracting price action or forming a structural base for potential reversals. Unlike traditional Volume Profile tools, Price Magnet focuses on price-time d
Weis Wave Scouterは、MetaTrader 5向けに開発された革新的なインジケーターであり、WyckoffメソッドとVSA(Volume Spread Analysis)の確立された原則を組み合わせています。精度と深みを求めるトレーダー向けに設計され、累積ボリューム波の分析を通じて市場を戦略的に読み取り、トレンドの反転ポイントや継続ポイントを特定する支援を行います。 Weis Wave Scouterは、クラシック、ナイトビジョン、オーシャンブリーズといったカスタマイズ可能なカラーテーマで、上昇波と下降波を色分けしたヒストグラムで明瞭に表示します。主な機能には、ボリュームピークの検出、低アクティビティゾーン(DeadZone)の識別、およびボリュームベースの波の反転に関するカスタマイズ可能なアラートが含まれます。また、エフォート対リザルト分析、因果関係、需給バランスといったWyckoffおよびVSA理論の基本概念をサポートしています。Brick Size、Volume Scale Factor、Pivot Lookbackといったパラメータで柔軟に調整でき、あらゆるスタ
Order Book, known also as Market Book, market depth, Level 2, - is a dynamically updated table with current volumes of orders to buy and to sell specific financial instument at price levels near Bid and Ask. MetaTrader 5 provides the means for receiving market book from your broker, but in real time only, without access to its history. The indicator OrderBook Cumulative Indicator accumulates market book data online and visualizes them on the chart. In addition, the indicator can show the market
WickAndBody Volume Flow v5.2 Order Flow Analysis through Candle Segmentation The WickAndBody Volume Flow is an advanced diagnostic tool for MetaTrader that allows traders to "see" inside every Japanese candlestick. Unlike conventional volume indicators, this algorithm utilizes Multi-Timeframe (MTF) technology to break down real volume and determine exactly how much capital was traded in the wicks versus the candle body . Key Features Volume Detection: Uses lower timeframe data (M1/M5) to reconst
FREE
== LT RAINBOW TREND - 36本の移動平均線を持つトレンドインジケーター == 概要 LT Rainbow Trendは、36本の移動平均線を同時に処理し、スマートなカラーシステム(レインボー)を搭載した先進的なトレンド分析テクニカルインジケーターです。主力のトレンド方向へ最大の視覚的明瞭さをもって取引したいトレーダーのために開発され、マルチタイムフレーム分析の複雑さを、シンプルでカラフル、かつ非常に直感的なビジュアルへと変換します。 「トレンドは友達(The trend is your friend)」であることを理解しているトレーダーに最適です。このインジケーターは、トレンドの強さ、方向、そして潜在的な反転を常に事前に見極めることを可能にします。 仕組み インジケーターは、4つのトレンドゾーンに分散された36本の移動平均線を監視します: 赤(トレンド転換ゾーン) 31〜20番目の移動平均線 トレンドが反転する可能性を示す強いサイン オレンジ(トレンド減速ゾーン) 19〜10番目の移動平均線 トレンドの勢いが失われつつあるが、継続の可能性もあるサ
Enhanced Elliott Wave Pro – Advanced Market Structure & Wave Analysis   Enhanced Elliott Wave Pro is a lightweight, institutional-grade MT5 indicator that eliminates chart clutter by detecting and displaying only the current, active market structure: the 1-2-3-4-5 Impulse wave and the subsequent A-B-C Correction.   Built with classic Prechter wave rules and ATR-adaptive pivot detection, it delivers clean, real-time wave counts without bogging down your terminal.   ――――――――――――――――――――――――――――
Reversal Master for MT5 Reversal Master for MT5 は、MetaTrader 5 向けのノンリペイント型リバーサルインジケーターです。潜在的な市場の転換ポイントを検出し、各ヒストリカルシグナルの後に発生した最大の有利な値動きを表示することで、過去の類似した局面で価格がどのように動いたかをより深く理解するのに役立ちます。 MT5 版では、元の MT4 版 Reversal Master のおなじみの反転シグナルロジックを維持しつつ、ビジュアル面の強化、ヒストリカル統計、ポイントベースのサマリーパネルを追加しています。MetaTrader 5 がサポートするあらゆる銘柄・時間足で動作し、単体のリバーサルツールとしてはもちろん、既存ストラテジー内の追加フィルターや、Expert Advisor 用のシグナルソースとしても利用できます。 Key Features 潜在的なトレンド転換ポイントを自動検出。 ノンリペイントの矢印シグナル:バーが確定した後は位置が変わらず、消えません。 2 つの動作モード:Mode 1 Classic(従来型 MT4 ロジ
Overview Harmonic Patterns MT5 is a technical analysis indicator designed for the MetaTrader 5 platform. It identifies and displays harmonic price patterns, such as Butterfly, Cypher, Crab, Bat, Shark, and Gartley, in both bullish and bearish directions. The indicator calculates key price levels, including entry, stop loss, and three take-profit levels, to assist traders in analyzing market movements. Visual elements and customizable alerts enhance usability on the chart. Features Detects six ha
GDS Renko Entry Helper - Free Renko Price Interaction Indicator for MetaTrader 5 GDS Renko Entry Helper is a free Renko price interaction indicator for MetaTrader 5. It helps traders highlight important areas where price reacts, slows down, returns to a zone or changes behavior around support and resistance. The tool is designed for manual Renko analysis. It does not generate buy or sell signals and does not tell the trader when to enter the market. Its purpose is to help focus attention on area
Trend Follower — a trend map for MetaTrader 5 Trend Follower does not tell you where to buy or sell. It shows where the market is: uptrend, downtrend or consolidation, and whether the current trend is gaining or losing strength. You read the map and make the decision. HOW TO READ IT Green   — uptrend. Red — downtrend. Shade   — a full, strong color means the trend is in force. When momentum fades, the color fades step by step; in a consolidation it is at its palest. When the trend accelerates a
The   Trendlines Oscillator   helps traders identify trends and momentum based on the normalized distances between the current price and the most recently detected bullish and bearish trend lines. The indicator features bullish and bearish momentum, a signal line with crossings, and multiple smoothing options. USAGE The   Trendlines Oscillator   works by systematically: Identifying pivot highs and lows. Connecting pivots to form bullish (support) and bearish (resistance) trendlines. Measuring
A Média Móvel é um indicador que faz parte da Análise Técnica. Com ela, é possível identificar o equilíbrio dos preços no mercado, observando tendências de alta, neutra ou baixa. Este indicador customizado traz opções extras pera definir o método de cálculo podendo-se esclolher entre SMA,EMA,SSMA,LWMA,JJMA,JurX,ParMA,T3,Vidya,AMA,HULL MA. Também conta com varias opções para escolher o método de cálculo para o preço base a ser usado no cáculo da média.
Fabii Half Trend Baseline
Fabien Georges Andre Guillemaud
上位足のトレンドに逆らう取引をやめましょう。2本のベースライン、1つのチャート。リペイントなし。 どの通貨ペアでも、どの時間足でも。2分でチャートに表示。Strategy Tester で無料デモを試せます。 Get more indicators here Baselines, volatility filters and oscillators. No repaint. 必要な理由 チャート上のラインが緑になったので、あなたはエントリーします。その後、上位足を開くと、大きなトレンドは逆方向を向いています。シグナルは本物でした。しかし、その背景のトレンドはあなたの味方ではありませんでした。 大きなトレンドに逆らう取引は、そのたびにエントリーの優位性を失わせます。 得られるもの Fabii Half Trend Baseline は、現在の時間足のトレンドと上位足のトレンドを1つのチャートに表示します。ウィンドウを切り替えて全体像を確認する必要がなくなります。 上位足の2本目のベースラインがメインのラインの後ろに描かれるため、別のチャートを開かずに大きなトレンドが分かります。 ベ
XAUUSD OrderFlow Structure AutoPOC Pro is an advanced MetaTrader 5 indicator designed to analyze market structure, order flow, buying and selling pressure, liquidity, and volume distribution directly on the chart. The indicator is especially focused on XAUUSD (Gold) analysis, although it can also be used with other instruments available in MetaTrader 5. Its objective is to bring together several analytical tools that would normally require multiple indicators: market structure, BOS and CHOCH, Or
Caicai L&S Yield Histogram Important Notice: This indicator is an integral tool of the automated EA Caicai Long and Short Pair Trading . This indicator visually displays the percentage deviation (Yield %) of a pair's current spread relative to its own historical mean. It is an excellent tool for quickly visualizing the gross financial potential of a market distortion in Long & Short operations. Main Features: Percentage Visualization: Understand the size of the distortion in palpable percentage
HAshi-EはHeiken-Ashiシグナルを分析する強化された方法です。 説明 HAshi-Eは、Heiken-Ashiシグナルを分析するための強化された方法です。HAshi-Eは、Heiken-Ashiシグナルを分析するための強化された方法です。HAshi-Eは、Heiken-Ashiシグナルを分析するための強化された方法です。伝統的なローソク足チャートとは異なり、ヒーケンアシのローソク足は過去のバーの平均値を使って計算されるため、よりスムーズで解釈しやすい視覚的表現が可能です。 その主な利点は、ほとんどの人が本来の読み方をしない理由でもあります。Heiken-Ashiローソク足には平均値に関する情報が含まれており、通常、資産ローソク足の前に配置されているため、色や形に惑わされ、不適切な時間帯や遅い時間帯にエントリーやエグジットを行う人をよく見かける。 HAshi-Eは、伝統的なHeiken-Ashiインジケータの改良版です! HAshi-E(チャート版)の特徴: 同じデータを異なる角度から見る HAshi-Eは、伝統的なHeiken-Ashiローソク足だけでなく、ライ
Japanese このインジケーターは、チャートパターンでのトレードを好むトレーダーにとって、高度なチャート分析アシスタントとして機能します。目視での分析負担を軽減し、利益を上げるための精度を高めるように設計されています。 実際の使用においての、このインジケーターの主な利点と特徴は以下の通りです: 1. 自動パターン検出 (Automated Pattern Detection) 時間の節約とバイアスの軽減: 手動でトレンドラインを引く必要はありません。価格のスイングポイント(Pivot High/Low)を検索し、価格構造が条件を満たすと、ライジングウェッジ(上昇楔形)とフォーリングウェッジ(下降楔形)を自動的に描画します。 あらゆる状況を網羅: パターン形成中、ブレイクアウト、さらにはパターン失敗(Failed)まで検出でき、市場の全体像を明確に把握できます。 2. ターゲットとフィボナッチTPの内蔵 (Built-in Targets & Fibonacci TP) ターゲットを自動計算: ブレイクアウトが発生すると、システムはウェッジの開き幅に基づいてメインターゲットの距離を即
このプロダクトを購入した人は以下も購入しています
Neuro Poseidon is a new indicator by Daria Rezueva. It combines precise trading signals with adaptive TP/SL levels - creating best possible trades as a result! Message me and get  Neuro Poseidon Assistant  as a gift to automize your trading process! What makes it stand out? 1. Proven profitability on all assets and timeframes 2. Only confirmed BUY and SELL signals present on the chart 3. Adaptive TP & SL levels generated by the software for each trade 4. Easy to understand - suitable for al
ARIPoint
Temirlan Kdyrkhan
1 (4)
ARIPoint is a powerful trading companion designed to generate high-probability entry signals with dynamic TP/SL/DP levels based on volatility. Built-in performance tracking shows win/loss stats, PP1/PP2 hits, and success rates all updated live. Key Features: Buy/Sell signals with adaptive volatility bands Real-time TP/SL/DP levels based on ATR Built-in MA Filter with optional ATR/StdDev volatility Performance stats panel (Success, Profit/Loss, PP1/PP2) Alerts via popup, sound, push, or email Cu
トレーダーの皆さん、こんにちは! 多くの個人トレーダーは、動作の遅いウェブスクリプトに頼っています。真の収益性を実現するには、体系化されたフレームワークが必要です。 Astro AIインジケーターは、一般的なチャートオーバーレイではありません。これは、ターミナル上で直接動作する2つのエージェントを含む、コンパイル済みのニューラルネットワークです。 システムの具体的な技術は以下のとおりです。 1. エージェント1:アナリスト(グラフィカルニューラルネットワーク - GNN) 市場は孤立した価格バーではなく、相互に連結されたデータネットワークです。 機能:エージェント1は、グラフィカルニューラルネットワークを使用して、これらの複雑で非線形な関係をマッピングします。 利点:一般的なインジケーターは過去の移動平均しか考慮しませんが、当社のGNNは市場の深い構造的関係をリアルタイムで処理し、個人トレーダーの取引量が大きな影響を与える前に、隠れた相関関係を明らかにします。 2. エージェント2:エグゼキューター(近接戦略最適化 - PPO) パターン認識は、戦いの半分に過ぎません
もう勘でトレードしなくていい。 エントリーのタイミング、決済の場所、相場がどちらに傾いているか、そのすべてが1つのチャートで分かります。 RelicusRoad Proは、20種類近くのツールを1つのインジケーターにまとめました。自分のトレードスタイルに合うツールだけをオンにできます。 エントリーは明確に。決済も明確に。すべてのチャートに計画を。 心当たりはありませんか? 買った途端、1分もしないうちに価格が逆行する。 早めに決済してしまい、その後も値動きが続くのを眺めている。 チャートにインジケーターを5つ並べても、答えは5通りある。 ストップロスの位置は、なんとなく決めている。 開発した理由 私たちは18年間、FXを取引してきました。RelicusRoadの中核となるアルゴリズムは、最初は非公開で、私たちプロのトレーダー仲間のために作られました。 きっかけは個人的なものでした。毎回同じラインを手で引き、自分たちで決めたルールを破り、チャート上の重要な一点を見落とすことに、私たちは疲れていたのです。 私たちにとって効いたのは一貫性です。毎日同じ方法で相場を読み続け、それが体に染みつく
Boba Analysis Suite Boba Analysis Suite は、MetaTrader 5 向けの分析インジケーターです。市場構造、重要な価格帯、相場全体の状況を、一つのチャート画面にまとめて表示します。 トレーダーおよびトレーディング指導者としての実務経験をもとに開発され、市場の方向性の評価、重要な価格水準の特定、複数の時間足を組み合わせた分析など、体系的な分析プロセスを支援します。 相場の背景を踏まえた分析 個々のシグナルの意味は、相場の状況によって変わります。Boba Analysis Suite は、現在のチャート状況をより大きな市場構造と関連付け、あらかじめ定めたルールに沿って取引アイデアを検討するための分析を支援します。 主な分析機能: トレンドと市場構造: 市場の方向性と、その背景にある構造を評価します。 重要な価格帯と価格水準: さらに分析すべき重要な領域を視覚的に表示します。 複数の時間足: 異なる時間足の情報を組み合わせ、相場全体の状況を評価します。 視覚的な分析プロセス: 分析情報をチャート上で直接確認できます。 自主的な取引判断を支援 Boba
以下は Chimera Volume の日本語訳です。 MetaTrader 5用 Chimera Volume 高度な出来高分析と市場活動の可視化 Chimera Volumeは、MetaTrader 5向けに設計されたカスタムインジケーターです。正規化された出来高の動きを分析し、動的な視覚的フレームワークを通じて市場参加者の変化をリアルタイムで表示します。 このインジケーターは、適応型正規化アルゴリズムを用いてティック出来高データを処理し、出来高の強さ、蓄積フェーズ、および異なる市場条件下での活動シフトを構造化して表現します。 生の出来高を表示する標準的なインジケーターとは異なり、Chimera Volumeは追加の計算を適用することで、市場活動の相対的な変化を強調し、チャートの視認性を向上させます。 主な機能 ルート・インテント・ヒストグラム (Root Intent Histogram): 正規化された出来高の強さと市場参加度を視覚化する動的ヒストグラムです。適応型カラー・トランジションを採用しており、活動の活発化と参加の減少を明確に区別します。 慣性ライン (Inertia
UZFX {SSS} スキャルピング・スマートシグナル v5.0 MT5は、変動の激しい市場において正確かつリアルタイムのシグナルを求めるスキャルパー、デイトレーダー、スイングトレーダー向けに設計された、リペイントのない高性能な取引インジケーターです。(UZFX-LABS)によって開発されたこのインジケーターは、価格行動分析、トレンド確認、スマートフィルタリングを組み合わせることで、すべての通貨ペアおよび時間枠において、高確率の売買シグナル、警告シグナル、トレンド継続の機会を生成します。 トレードの判断に迷うのはもうやめましょう。明確さ、正確さ、そして規律ある市場執行を求めるトレーダーのために設計された、体系的なシグナルシステムに従い始めましょう。 間違いなく、MQL5で入手可能な最高のインジケーターの一つです。絶対に見逃さないでください!!「スマートなトレーダーのためのスマートシグナル」 最新バージョン5.0がリリースされました。価格は予告なく最大499.99ドルまで値上がりする可能性がありますので、チャンスを逃さないようお早めにお求めください!! 購入を決める前に!無料トライアル
Ace Trend
Mikhail Sergeev
5 (3)
私たちはあなたにトレンド取引の世界でゲームのルールを変える革命的な指標を提示します。 指標は、パフォーマンスを再考し、前例のない高さにあなたの取引経験を高めるように設計されています。 私たちの指標は、競合他社とは一線を画す高度な機能のユニークな組み合わせを誇っています。 "実質の価格設定要因"の先端技術は最も困難で、揮発市況の最高の安定性を保障する。 不安定なパターン、壊れた指標に別れを告げ、意識的で制御された取引を歓迎します。 指標は単なる美しい絵ではありません! 指標は、トレーダーの側にオッズをシフトし、それによって利益を得る必要があります。 インジケータ信号(完全自動モード)に基づいて取引結果に慣れる: https://www.mql5.com/ja/signals/2339244 AceTrendは、rbtiバージョンによるトレンド指標のランキングで第一位にランクされています。AceTrend-取引における最大の収益性と制御。 私たちの指標は、歴史ではなく、現在の市場相場に基づいて収益性を強調しています。 革命に参加-あなたの取引経験の可能性のロックを解除! インジケーターは、
IQ FX Gann Levels a precision trading indicator based on W.D. Gann’s square root methods . It plots real-time, non-repainting support and resistance levels to help traders confidently spot intraday and scalping opportunities with high accuracy. William Delbert Gann (W.D. Gann) was an exceptional market analyst, whose trading technique was based on a complex blend of mathematics, geometry, astrology, and ancient mathematics which proved to be extremely accurate. We don't offer free or bonus indic
Azimuth Pro
Ottaviano De Cicco
5 (7)
Azimuth Pro V2:MT5向けシンセティック・フラクタル構造分析と確認済みエントリー 概要 Azimuth Pro は Merkava Labs によるマルチレベルスイング構造インジケーターです。4つのネストされたスイングレイヤー、スイングアンカーVWAP、ABCパターン検出、3タイムフレーム構造フィルタリング、そして確定バーでの確認済みエントリー — 1つのチャートで、ミクロスイングからマクロサイクルまでを網羅するワークフロー。 これはブラインドシグナル製品ではありません。ロケーション、コンテキスト、タイミングを重視するトレーダーのための構造ファーストワークフローです。 ️ サマーセール — 夏至とThe Oracle Proの発売を記念して、Azimuth Proが30%オフ。現在279 USD(通常399 USD)。期間限定の夏季オファー。 1. V2での変更点 シンセティック・マルチタイムフレームエンジン 上位タイムフレーム分析をMeridian Proと同じ独自のシンセティックアーキテクチャで一から再構築。よりクリーンなHTFコンテキスト、安定したライブ動作、
First time on MetaTrader, introducing IQ Star Lines, an original Vedic Astrology Based Intraday Trading Indicator. We don't offer free or bonus indicators in exchange of reviews from you. You won't need any free products with this indicator to make it work. ;) Enjoy! Welcome to the new and updated  IQ Star Lines , the ultimate fusion of ancient planetary cycles and modern quantitative trading, published for the first time on Metatrader. This is an indicator built by the developer, who has spent
PainX 400 FAKEOUT DETECTOR MT5 Custom Indicator  ·  Sell-Side Bias  ·  Scalping  ·  RSI(6) Filtered   OVERVIEW   The Spike Fakeout Detector is a non repaint precision technical indicator built exclusively for Crash / PainX synthetic indices on the platform. It is engineered around one of the most consistent and exploitable patterns on this instrument — the false breakout above resistance followed by a sharp price drop. Crash/PainX is a growing index that produces a significant price drop appr
ARICoin is a powerful trading companion designed to generate high-probability entry signals with dynamic TP/SL/DP levels based on volatility. Built-in performance tracking shows win/loss stats, PP1/PP2 hits, and success rates all updated live. Key Features: Buy/Sell signals with adaptive volatility bands Real-time TP/SL/DP levels based on ATR Built-in MA Filter with optional ATR/StdDev volatility Performance stats panel (Success, Profit/Loss, PP1/PP2) Alerts via popup, sound, push, or email Cust
Quantum Momentum Guard (QMG) Advanced Breakout & Momentum Indicator for MetaTrader 5 Quantum Momentum Guard (QMG) is a next-generation MetaTrader 5 trading indicator designed to identify high-probability breakout opportunities using a powerful combination of advanced momentum analysis and high-level mathematical calculations . Unlike ordinary indicators that generate signals based on a single condition, QMG confirms every breakout with momentum strength and mathematical validation , ensuring
GEM Signal Pro GEM Signal Pro は、MetaTrader 5 向けのトレンドフォロー型インジケーターです。より明確なシグナル、より整理されたトレードセットアップ、そして実用的なリスク管理をチャート上で確認したいトレーダーのために設計されています。 単純な矢印だけを表示するのではなく、GEM Signal Pro はトレード全体の考え方を、より見やすく分かりやすい形で表示します。条件が確認されると、インジケーターはエントリー価格、ストップロス、利確目標をチャート上に表示し、トレードセットアップをより効率的に確認できるようにします。 動作の仕組み このインジケーターは、まず内部ロジックに基づいて有効なシードシグナルを検出します。 確認条件が満たされると、GEM Signal Pro はチャート上に完全なセットアップを表示します。これにより、トレーダーはトレード構造をより明確に把握し、手作業による分析を減らすことができます。 チャート上のトレードレベル 確認済みシグナルに対して、GEM Signal Pro は以下を表示できます。 エントリー価格 ストップロス テ
MERAVITH SCANNERは、MetaTrader 5用のプロフェッショナルな金融市場インジケーターで、複数の分析ツールを一つの統合システムにまとめています。独自の出来高加重平均価格(VWAP)手法を使用してすべての計算を自動で行い、主観的な解釈を完全に排除します。 このインジケーターは、すべての資産クラス(FX、株式、指数、商品、暗号通貨)およびM1から月足までのすべての時間軸で動作します。基本原理は「価格は出来高に従う」というものです。MERAVITHは機関投資家の出来高が集中するポイントを特定し、その集中から数学的に正確な価格レベルを導き出します。予測や投機は行わず、計算のみを行います。 MERAVITH SCANNERを使用すると、28の主要FX通貨ペアをすべての時間軸でわずか2~3分でスキャンできます。また、任意の市場をスキャンすることも可能です。例えば、約100銘柄の株式を約10分でスキャンできます。 インジケーターは、消耗レベル、均衡線、偏差、統計レベル、およびターゲット予測を算出します。 チャート要素 Origin Point :すべての計算が始まる起点です。イン
Presenting one-of-a-kind Gann Indicator for XAUUSD IQ Gold Gann Levels is a non-repainting, precision tool designed exclusively for XAUUSD intraday trading. It uses W.D. Gann’s square root method to plot real-time support and resistance levels, helping traders spot high-probability entries with confidence and clarity. William Delbert Gann (W.D. Gann) was an exceptional market analyst whose trading technique was based on a complex blend of mathematics, geometry, astrology, and ancient calculation
一言でいうと このインジケーターは RSI と MACD という2人の専門家を1つにまとめたもの です。2つのチャートを別々に見て判断する代わりに、両方が同意したときだけ「買い」または「売り」の矢印を表示します。 矢印は再描画されません 。一度出現すれば、そのまま固定されます。 「コンボ」の意味 通常、トレーダーは RSI(値動きの勢い)と MACD(トレンドの方向)を別々に見ます。しかし両者が矛盾することも多いです。 このインジケーターでは、 両方が同時に同意したときのみシグナル を出します。これにより、多くの偽シグナルが排除されます。 画面で見えるもの 価格チャートとは別のインジケーターウィンドウ 青と赤の矢印 —— そのまま使えるシグナル 拡大表示された MACD ヒストグラム(見やすく強調されている) RSI と MACD のラインも表示されるが、注目すべきは矢印 こんな人におすすめ 初心者 —— 2つのインジケーターを別々に解釈し、矛盾に対処する必要がない 経験者 —— シグナルの高速フィルタリングと、再描画しないクリアなロジック 迷いたくない人 —— 「買い」「売り」「待て
VTrende Pro
Andrii Diachenko
5 (1)
VTrende Pro - MTF indicator for trend trading with a display panel for MT5 *** Videos can be translated into any language using subtitles (video language - Russian) Although the signals of the VTrende Pro indicator can be used as signals of a full-fledged trading system, it is recommended to use them in conjunction with the Bill Williams TS. VTrende Pro is an extended version of the VTrende indicator. Difference between Pro version and VTrende: - Time zones - Signal V - signal 1-2 waves -    S
note: this indicator is for METATRADER4, if you want the version for METATRADER5 this is the link:  https://www.mql5.com/it/market/product/108106 TRENDMAESTRO ver 2.5 TRENDMAESTRO recognizes a new TREND from the start, he never makes mistakes. The certainty of identifying a new TREND is priceless. DESCRIPTION TRENDMAESTRO identifies a new TREND in the bud, this indicator examines the volatility, volumes and momentum to identify the moment in which there is an explosion of one or more of these da
MERAVITH は MetaTrader 5 向けのマルチタイムフレームの出来高・流動性インジケーターで、すべての時間足でトレンド、サポートとレジスタンスのゾーン、エントリー、ターゲット、ストップロスを表示します。市場の完全な流動性マップ、ヘッジファンド流の流動性ツールを提供し、独自の出来高加重平均価格の手法ですべての計算を自動で行うため、主観的な解釈はありません。 FX、ゴールド(XAUUSD)、指数、仮想通貨に対応し、すべての時間足で機能します。 購入後の特典:MERAVITH での取引方法を解説した動画レッスン集。購入後にメッセージをお送りください。 MERAVITH の機能 すべての時間足を分析し、それぞれで有効なトレンドを表示します。 流動性ゾーン(Volume Equilibrium)を示します。強気と弱気の出来高が等しくなる場所です。 すべての時間足の流動性レベルをチャート上に直接表示します。 参考用に市場のテキスト分析を書き出します。 現在のトレンドからエントリー、ターゲット、サポートレベル、ストップロスを計算します。 取引のリスクリワード比を計算します。 口座残高に
Cycles Plotter 移動平均と開始日を備えたカスタマイズ可能なサイクルインジケーター Cycles Plotter は、ユーザー入力のみに基づいて、完全にカスタマイズ可能な2つの正弦波サイクルを描画する高度なテクニカルインジケーターです。サイクルを自動生成しません。すべてのサイクルは、ユーザーが設定したパラメーターのみに基づいて計算され、価格の振動と潜在的なトレンド変化を研究するための視覚的ツールをトレーダーに提供し、自動シグナルや予測は生成しません。 重要なポイント: ユーザー定義のサイクル: サイクル 1 P1 と 2 P2 はユーザーが完全に設定できます。サイクルの長さ、振幅、移動平均、正確な開始日と時刻を設定できます。ユーザーがパラメーターを入力しない場合、サイクルは描画されません。 振幅の制御: 各サイクルは異なる振幅を持つことができ、基準となる移動平均に対して振動の高さを調整できます。 トレンド検出: 高速および低速移動平均はサイクルの方向を示します: Fast MA が Slow MA より大きい 上昇フェーズ 緑 lime Fast MA が Slow MA
AriX
Temirlan Kdyrkhan
1 (4)
AriX Indicator for MT5 A powerful trend-following and signal-evaluation tool AriX is a custom MT5 indicator that combines Moving Averages and ATR-based risk/reward logic to generate clear buy/sell signals. It visualizes dynamic SL/TP levels, evaluates past trade outcomes, and displays win/loss statistics in a clean on-chart panel. Key features include: Buy/Sell signals based on MA crossovers ATR-based SL/TP1/TP2/TP3 levels with visual lines and labels Signal outcome tracking with real-time stat

相場が本当は何をしているのかを見抜く。   3つの市場フェーズ(収縮・拡張・トレンド)を目の前でライブに捉え、トレンド・フェーズの初期段階でより優れたエントリーを取りましょう   。      当て推量はもう終わり。機関投資家やスマートマネーのように相場を読み始めましょう。   Apex Market Structure Pro(MT5版)は、ノイズを取り除き、あらゆるローソク足の下にある真の構造を見せる高精度のスマートマネー分析ツ   ールです。流動性、構造転換、蓄積ゾーン、トレンドバイアスを、ひとつのクリーンでプロフェッショナルなオーバーレイに集約します。遅行   指標に見切りをつけ、明晰さをもってトレードする準備のできた本気のトレーダーのために作られました。   重要:本インジケーターは Heikin Ashi(平均足)ローソク足での動作を前提に設計されています。使用前にチャートを Heikin Ashi   に設定し、その真価を解き放ってください。分析のすべては Heikin Ashi の価格の流れを軸に構築されています。Apex Market Structure Pr
Title:FX-AIEA Supply and Demand Zone Indicator (MT5) — Technical Overview Version: 2.51 | Platform: MetaTrader 5 Introduction Supply and demand zones are considered a core manifestation of institutional order flow, providing a more direct reflection of buying and selling pressure than traditional support/resistance levels. This indicator attempts to automate the identification of high-probability supply and demand zones using an adaptive ZigZag algorithm, reducing the subjectivity and time asso
ORB Seeker MT5
Marcela Goncalves De Oliveira
数量限定で特別価格!希少性を維持するための特別価格です! たったの599ドル! ご購入後、ボーナスとしてORB Seeker EAと個人最適化セットファイルをお受け取りいただくため、私にご連絡ください。 クリーンなセッションブレイクアウトを自信を持ってキャッチしましょう! ORB Seeker MT5は、正確性、シンプルさ、柔軟性、そして明確なチャート構造を求めるトレーダー向けに開発された、プロ仕様のオープニングレンジブレイクアウト(ORB)インジケーターです。 このシステムは、あらゆる銘柄のプレマーケットまたはカスタムセッションのレンジを自動的にプロットし、エントリー、ストップロス、テイクプロフィット、およびオプションの50%部分TPレベルを含む明確なブレイクアウトシグナルを提供します。すべての計算結果はリアルタイムでチャート上に表示されます。 ロンドンオープン、ニューヨークセッション、アジアセッション、または独自のカスタム市場時間帯で取引できます。ORB Seeker MT5は選択したセッション時間帯に合わせて調整されるため、市場レンジ、ブレイクアウトレベル、トレードレベルの位
Volume Arrow Signal Product Description Volume Arrow Signal is a smart trading indicator designed to help traders identify potential buy and sell opportunities using price action, volume behavior, and directional arrow signals. The indicator places clear arrows directly on the chart, making it easy to spot possible market reversals, trend continuations, and entry opportunities without spending hours analyzing charts manually. Whether you are trading Gold (XAUUSD) , Forex pairs, Indices, or Crypt
AriFocus - Non-Repainting Buy/Sell Signals AriFocus - one clear signal. AriFocus marks buy and sell signals directly on the chart and suggests a stop-loss level for each one. Every signal is confirmed on bar close and never repaints. - Buy/sell arrows, confirmed on bar close - Suggested stop-loss level for every signal - Trend band and candle coloring to show direction at a glance - 10 ready-made presets, or your own settings (14 calculation methods) - Pop-up, push and email alerts with entr
このインジケーターは、市場で 関心が示されたゾーン をハイライトし、その後に 注文の蓄積ゾーン を表示します。 これは、大規模な**板情報(オーダーブック)**のように機能します。 これは、 巨大な資金 のためのインジケーターです。その性能は卓越しています。 市場にどんな関心が存在していても、 必ず目に見えるようになります 。 (これは 完全に再設計され、自動化されたバージョン です。もはや手動分析は必要ありません。) トランザクションスピード(取引速度) は新しい概念のインジケーターで、市場で大口注文が どこに・いつ 集中しているかを示し、それに基づいたチャンスを提供します。 トレンドの変化を 非常に早い段階 で察知することができます。 FXでは「出来高」と呼ばれているものは誤解されています。実際には、これは 時間あたりの価格変動量 です。したがって、正しい名称は トランザクションスピード です。 考え方・行動・分析の仕方すべてが問われます。 分析パラダイムの転換は非常に重要です。 このインジケーターは、FXにおける出来高の考え方を 根本から再定義 し、論理的な形で正確に活用する、
Footprint は、オーダーフロー(Order Flow)と出来高分析のためのインジケーターです。 クラスターレベルでの市場構造の特定、アクティビティの高い主要ゾーンの発見、そして設定ウィンドウを毎回開くことなくチャート上で直接フィルター操作を行うのに役立ちます。 Footprintインジケーターの機能 Bid x Ask、Deltaのクラスターチャート; チャート上のコントロールパネル; フィルター調整用のスライダー; Absorption; Initiative; Stacked Imbalances; Big Trades; dPOC / Dynamic Point of Control; Delta; サイドマーケットプロファイル; 累積デルタ(Cumulative Delta)。 主な利点 高密度のティックフローに対する高速な計算とデータ表示; チャート内管理 — 設定を開くことなく、主要モードとフィルターを直接切り替え可能; 重要な価格レベルとクラスターを強調するためのフィルタリング; シグナルの視覚的ハイライト:吸収、主導権、インバランス、大口取引; 日、週、または現
作者のその他のプロダクト
Easy to use EA designed to auto trade. Works in every market condition. It uses reliable levels of MACD indicator combined with unique logic to perform fully automatic trading operations. *For MT4 version please go here! *If you don't like automated system and only need an alert system to help you in trading. Please check this arrow with alert system  here! FEATURES: Dangerous methods like martingale, hedge, grid or scalping are NOT used. Each position has Stop Loss and Take Profit. Positional
FREE
Trade BTN 4
Prafull Manohar Nikam
This is an ON CHART trade management panel. In other words, ON CHART Lot Size, Buy, Sell, Stop Loss, Take Profit, Close Buy, Close Sell and Close All buttons! *IMPORTANT NOTE: Input settings are NOT usable. You can change or insert Stop Loss and Take Profit values only on the chart panel. (See the below video!) This one is MT4 version! BUTTONS List: 1. Lot Size - (0.01) is default click on it and insert the lot size with which you want to open a trade. 2. Stop Loss - (0.0) is default click on i
FREE
M ulti Cross Alert! on your smartphone. Use multiple indicators to get a crossover signal on chart as well as on MetaTrader app. You can use all crossovers at the same time but it is not recommended cause your chart will look messy. Instead use combination of two indicators which will be better. IMP NOTE:- More indicators will be added in future updates. Any suggestions regarding indicators are welcome!   Indicators List: 1. MA (Cross) 2. RSI (OB/OS) 3. MACD Lines (Main Line & Signal Line Cross)
FREE
Trade BTN
Prafull Manohar Nikam
T his is an ON CHART trade management panel. In other words, ON CHART Lot Size, Buy, Sell, Stop Loss, Take Profit, Close Buy, Close Sell and Close All buttons! *IMPORTANT NOTE: Input settings are NOT usable. You can change or insert Stop Loss and Take Profit values only on the chart panel. (See the below video!) This one is MT5 version! BUTTONS List: 1. Lot Size - (0.01) is default click on it and insert the lot size with which you want to open a trade. 2. Stop Loss - (0.0) is default click on
FREE
The indicator is based on the concept of price channels, which are formed by plotting the highest high and lowest low prices over a specified period of time. The Donchian Channel Indicator consists of three lines: an upper channel line, a lower channel line, and a middle channel line. The upper channel line represents the highest high over a specified period, while the lower channel line represents the lowest low. The middle channel line is the average of the two and can be used as a reference f
FREE
The indicator is based on the concept of price channels, which are formed by plotting the highest high and lowest low prices over a specified period of time. The Donchian Channel Indicator consists of three lines: an upper channel line, a lower channel line, and a middle channel line. The upper channel line represents the highest high over a specified period, while the lower channel line represents the lowest low. The middle channel line is the average of the two and can be used as a reference f
FREE
Easy to use EA designed to auto trade. Works in every market condition. It uses reliable levels of MACD indicator combined with unique logic to perform fully automatic trading operations. *For MT5 version please go   here! *If you don't like automated system and only need an alert system to help you in trading. Please check this arrow with alert system  here! FEATURES: Dangerous methods like martingale, hedge, grid or scalping are NOT used. Each position has Stop Loss and Take Profit. Positiona
FREE
M ulti Cross Alert! on your smartphone. Use multiple indicators to get a crossover signal on chart as well as on MetaTrader app. You can use all crossovers at the same time but it is not recommended cause your chart will look messy. Instead use combination of two indicators which will be better. IMP NOTE:- More indicators will be added in future updates. Any suggestions regarding indicators are welcome!   Indicators List: 1. MA (Cross) 2. RSI (OB/OS) 3. MACD Lines (Main Line & Signal Line Cross)
FREE
S imple arrow with alert on chart. This is NOT an entry indicator but a direction indicator. It uses MACD signal line to show you possible future direction of a trend. Please use it with other filters or confirmations to trade properly. Recommended for scalping and short term trades. Made for EURUSD M5 but it should work on every major pair on M5 timeframe. For MT4 version please go here! *If you need fully automated trading system. Please check this EA  here! FEATURES: Very simple directional i
FREE
S imple arrow with alert on chart. This is NOT an entry indicator but a direction indicator. It uses MACD signal line to show you possible future direction of a trend. Please use it with other filters or confirmations to trade properly. Recommended for scalping and short term trades. Made for EURUSD M5 but it should work on every major pair on M5 timeframe. For MT5 version please go here! *If you need a fully automated trading system. Please check this EA here! FEATURES: Very simple directional
FREE
S imple scalping EA which uses martingale lot system. Scalping happens on candlestick pattern and candle size in pips. This is a full automatic trading system which has auto money management option too. FEATURES: 1. Martingale 2. NO Grid 3. Scalping 4. Hard Stop Loss 5. Easy Take Profit 6. Uses Candlestick Pattern Important Note : - As name suggests it is a Martingale System. Always better to use minimal/proper martingale settings and proper trading capital otherwise it can easily blow your acco
Count MACD 4
Prafull Manohar Nikam
Easy to use EA capable of full automatic trading. NO Martingale (Original Strategy), NO Grid, High Win Rate, Low Drawdown EA. It uses multiple signal confirmation of MACD indicator to open a trade. (Ideal Buy-Sell Count i.e. BS Count = 3)! *Important:   1. Do not use Auto Stop Out (keep it false!) if you want to get better results from this expert advisor. Because (BS Count=3) has relatively high win rate so you don't need to worry about drawdowns. 2. Do not use Martingale & Visible SL-TP. (Not
EMA Scalper 4
Prafull Manohar Nikam
V ery simple EA uses the famous trend scalping i.e. EMA Crossover scalping to open trades with martingale lot system. It includes 03 EMA i.e. Exponential Moving Averages to decide which direction to trade. It also checks distance of a fast moving average from the trend moving average. After all these conditions get fulfilled it opens a position. Single position at a time with hard stop loss and take profit. Features: 1. Martingale 2. Uses trend indicators 3. Automatic Trading 4. Hard Stop Loss
Bolli Plus 4
Prafull Manohar Nikam
T his EA trades with trend so it has high win percentage. Uses trend indicators like Bollinger Bands and Moving Averages. This is NO Martingale system but it uses lots multiplier to increase the gains. You can easily disable the lots multiplier by changing it to 1.   Features: 1. NO Martingale 2. NO Grid 3. High Win Rate Strategy. 4. Low Drawdown. 5. Uses STOP OUT Percent instead of usual Stop Loss. 6. But uses the usual Take Profit in pips.   Account Requirements: 1. Minimum Balance - 1000 USD
BB Scalper 4
Prafull Manohar Nikam
This is a trend scalping EA because it uses trend indicators like Bollinger Bands and Moving Average. Easy to use forex expert advisor designed for EURUSD H1 but fully capable of trading other forex pairs and other timeframes too.  Features: 1. NO Grid 2. NO Martingale 3. Smart Lot Sizing 4. Auto Take Profit in Money 5. Auto Stop Out at % of Balance 6. Minimal Inputs 7. Can trade 100 USD Account too. 8. High Win Rate 9. Positive Equity Curve Account Requirements: *Broker - Any *Account type - He
This is a simple arrow system based on MACD indicators Main/Base line and MACD Levels. It gives you alerts when MACD's Main Line crosses above/below certain level. Which type of alerts available? 1. It paints on chart Up/Down Arrows. 2. Popup message and sound alert in trading terminal window. 3. Push notification or Alert on your android and ios mobile phones (requires MT4 or MT5 app installed!)
This is a simple arrow system based on Engulfing Candlestick Pattern. It gives you alerts on your smartphone when there is an engulfing candlestick pattern happens. Which type of alerts available? 1. It paints on chart Up/Down Arrows. 2. Popup message and sound alert in trading terminal window. 3. Push notification or Alert on your Android and IOS mobile phones (requires MT4 or MT5 app installed!) *Note: Use it on higher timeframes like H4 (4 hours), D1 (1 Day) then find trade opportunities on s
Base MACD 4
Prafull Manohar Nikam
This is a modern MACD indicator based on regular MACD indicator. It also has alert system included. This indicator gives you alerts when base line of MACD indicator crosses above or below Zero level so you can look for Buy or Sell opportunity. Available Alerts: 1.          Audible Alerts on Chart / Trading Terminal window. 2.          Alerts on your email. 3.          Alerts on your mobile phone. Type of Alerts Explained: 1. Audible_Chart_Alerts   - Audible alerts and Popup message on your compu
If you are using naked eyes to find candlestick patterns on your chart it's a good thing but it requires your time and attention and still you miss some patterns here and there. Don't worry! This indicator will help you to find "Harami Candlestick Pattern" on your chart very easily. *Note:   Default inputs are set for EURUSD H1 (1 hour) timeframe. This is an alert system which gives you alerts whenever harami candlestick pattern happens. Types of alerts it can give you are: 1. Audible Alerts   -
This indicator uses candlesticks with large real bodies to predict possible market structure shift. Displacement is a very powerful move in price action resulting in strong selling or buying pressure. Generally speaking, displacement will appear as a single or a group of candles that are all positioned in the same direction. These candles typically have large real bodies and very short wicks, suggesting very little disagreement between buyers and sellers. Often, a displacement will occur just af
Live testing available. Please contact. This is a simple utility which will put Automatic Stop Loss and Take Profit. It also has Trailing Stop Loss and Break Even features. The input value of the Stop Loss and Take Profit is in Pips. Whenever you open a trade it will put stop loss and take profit in pips automatically. *If you need a more practical stop loss and take profit for your trades then you may like our ATR based stop loss utility. Inputs: 1. SL and Trailing SL - This is the Stop Los
Live testing available. Please contact. ATR Auto Stop Loss & Take Profit Manager Automatically apply volatility-based Stop Loss and Take Profit levels to every new trade using the Average True Range (ATR). Unlike fixed-pip stop losses, ATR-based levels adapt to current market conditions. During high volatility, wider stops help prevent premature exits. During low volatility, tighter stops help improve risk efficiency. The utility automatically calculates and applies Stop Loss and Take Profit le
This is a simple EA which works on the EMA crossover strategy. It uses fixed pips to put hard Stop Loss and Take Profit levels on every trade. Warning! This is a martingale system which may or may not wipe your trading account. If you want to take the risk anyway then must use it with proper money and risk management. NOTE: Martingale is good for compounding the account in less time. In other words, “Grow it or Blow it!” POINTS: 1. Martingale System 2. Works in all markets. 3. Very Risky! 4. Ha
Simple alert system which will alert you on your mobile terminal, email and on the chart whenever RSI crosses below the overbought level or above the oversold level. Use this alert system, so you don’t have to watch the chart all day for the RSI levels to break. INPUTS: 1.        RSI Period- (Default is 14). Number of candles the RSI indicator will look back for the calculations. 2.        OB Level- (Default is 70). This is the Overbought level or Upper level for the RSI indicator. 3.        OS
This trading robot is strictly made for 10K Capital Trading Account and EURUSD H1. DO NOT use it on smaller accounts, because it has minimum free margin limit i.e. Free Margin > 500 (this value is in "actual money" not in "percentage"!) This is a Simple Grid Trading System which works on ADX indicator's volatility and with High Winrate. IMPORTANT: Default input settings are the bare minimum settings (not ideal) instead use the recommended settings (OR find your own best settings) provided in th
This is a simple trading robot which works on the EMA crossover strategy. It uses ATR indicator based hard Stop Loss and Take Profit levels on every trade. Also uses very risky Martingale Lot System. As mentioned early, this is a martingale system which may or may not wipe your trading account. You must use it with proper input settings and proper money-risk management. Symbol: EURUSD Timeframe: H1 ACCOUNT REQUIREMENTS: Minimum balance             =    $1000 Minimum leverage            =     1
H1 Hedge EA 4
Prafull Manohar Nikam
This is a very simple EA which uses distance from EMA Crossover strategy to open automatic trades. It has NO stop loss but has the take profit in money feature. This is an optional martingale system, it has a lot multiplier option if you want to use it to increase the successive trade volume. Don't trust the description, just download the demo today and test it yourself to know more about this trading robot.  (Backtest on longer periods like 5-10-20 years with 99-100% tick quality). Recommended:
Warning! This is a Martingale Trading System. This EA uses the Bollinger Bands indicator to open automatic trades on your account. If price crosses the upper/lower Bollinger band with certain distance (in pips), it opens an initial trade. After that initial trade, if price moves certain distance (in pips) from the initial trade, EA will open next trade with Martingale Lot and so on. Not recommended to use it on trading accounts smaller than 10K. Even on 10K+ account you have to use it with caut
Multi Take Profit Manager Automatically close portions of your open trades at up to three profit targets. This utility is designed for manual traders who frequently open multiple positions and want to scale out of trades automatically as profit targets are reached. Instead of manually closing positions one by one, the utility can partially close your total open position at predefined Take Profit levels, helping you lock in profits while allowing the remaining positions to continue running. Key F
Hey there! If you are using Moving Average indicator into RSI indicator's window and always wondering if there could be a way to get alerts on your smartphone when those two indicators get a crossover that would be great, right!? Then you have found the right tool for that. This indicator is nothing but a mix of MA indicator and RSI indicator into one indicator window as well as it will give you alerts for crossovers on your smartphone app, email and also on your trading terminal's (desktop) cha
フィルタ:
レビューなし
レビューに返信