RSI crosses MA Alert 4

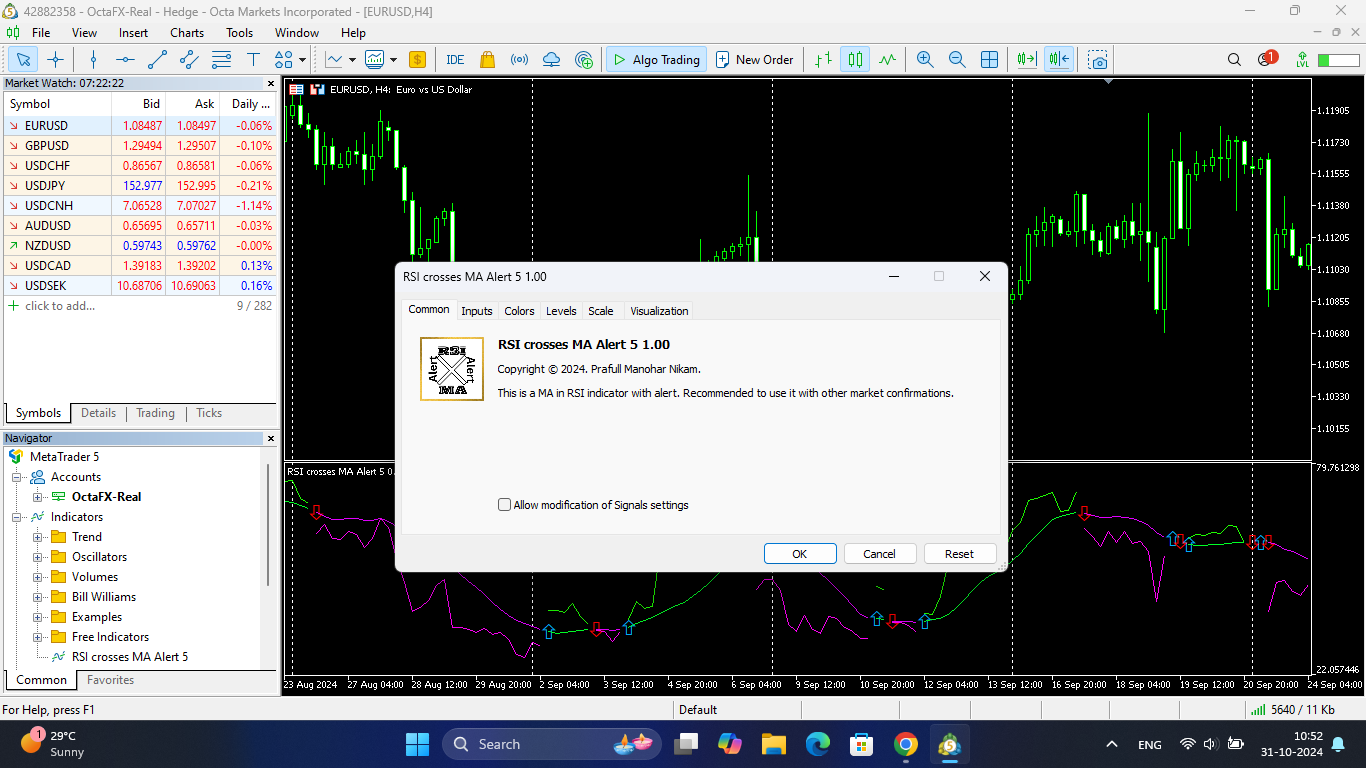
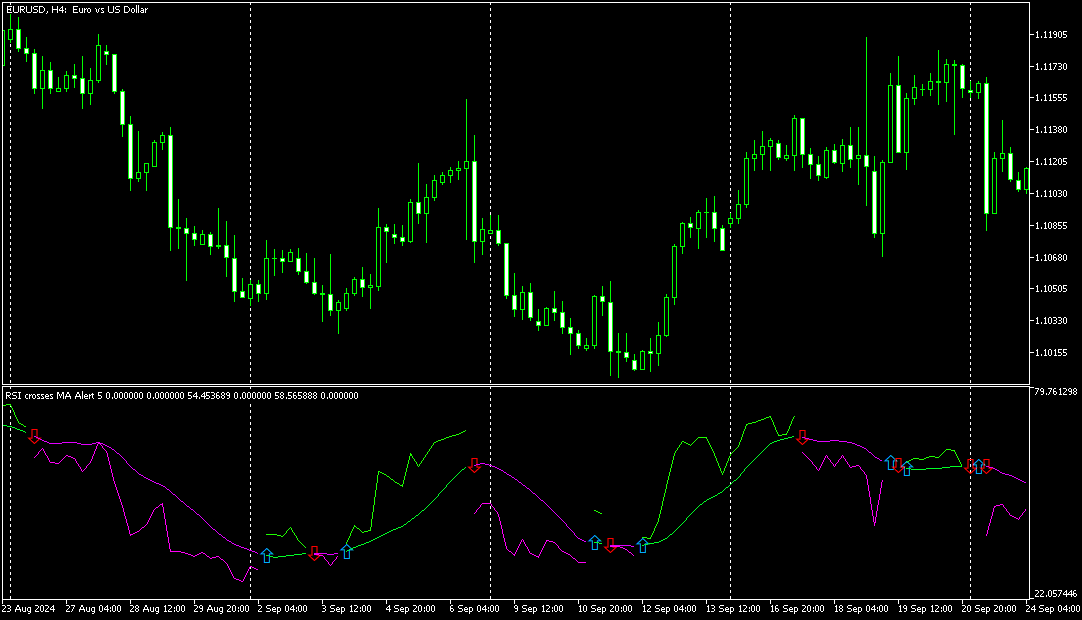
Hey there! If you are using Moving Average indicator into RSI indicator's window and always wondering if there could be a way to get alerts on your smartphone when those two indicators get a crossover that would be great, right!? Then you have found the right tool for that. This indicator is nothing but a mix of MA indicator and RSI indicator into one indicator window as well as it will give you alerts for crossovers on your smartphone app, email and also on your trading terminal's (desktop) chart window.

NOTE- This is NOT a Buy-Sell alert but a crossover alert system (crossovers are not meant for entering a trade blindly they are there to tell you, "Hey! be ready and look for a possible trade opportunity"). Recommended to use it with other market confirmations and best on higher timeframes.

FEATURES:

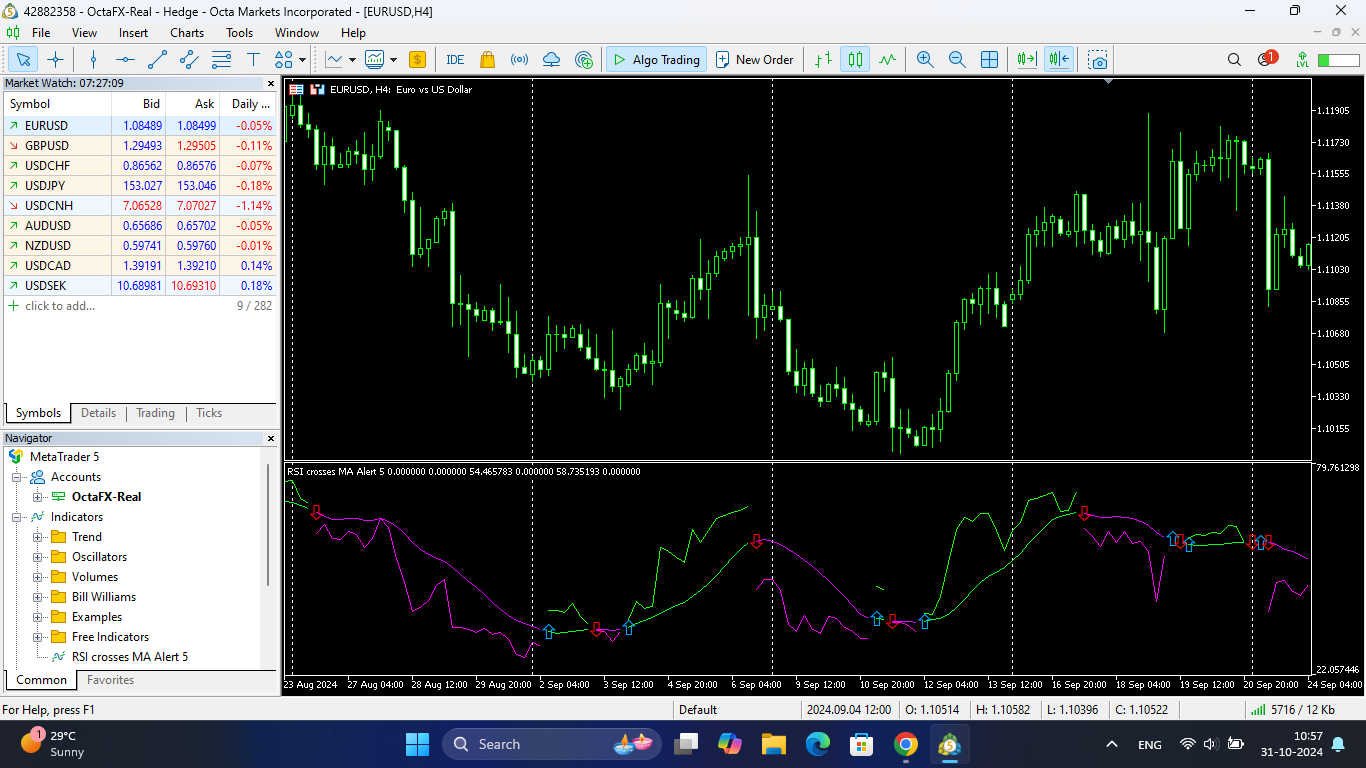
1. It uses a trend indicator which is Simple Moving Average (SMA).

2. It uses an oscillator indicator which is Relative Strength Index (RSI).

3. It has mobile alert which works on METATRADER (4 & 5) mobile apps.

4. It has email alert which you have to setup and activate inside your (METATRADER for desktop) trading terminal's settings.

5. It has pop up alert on your desktop trading terminal  as well.
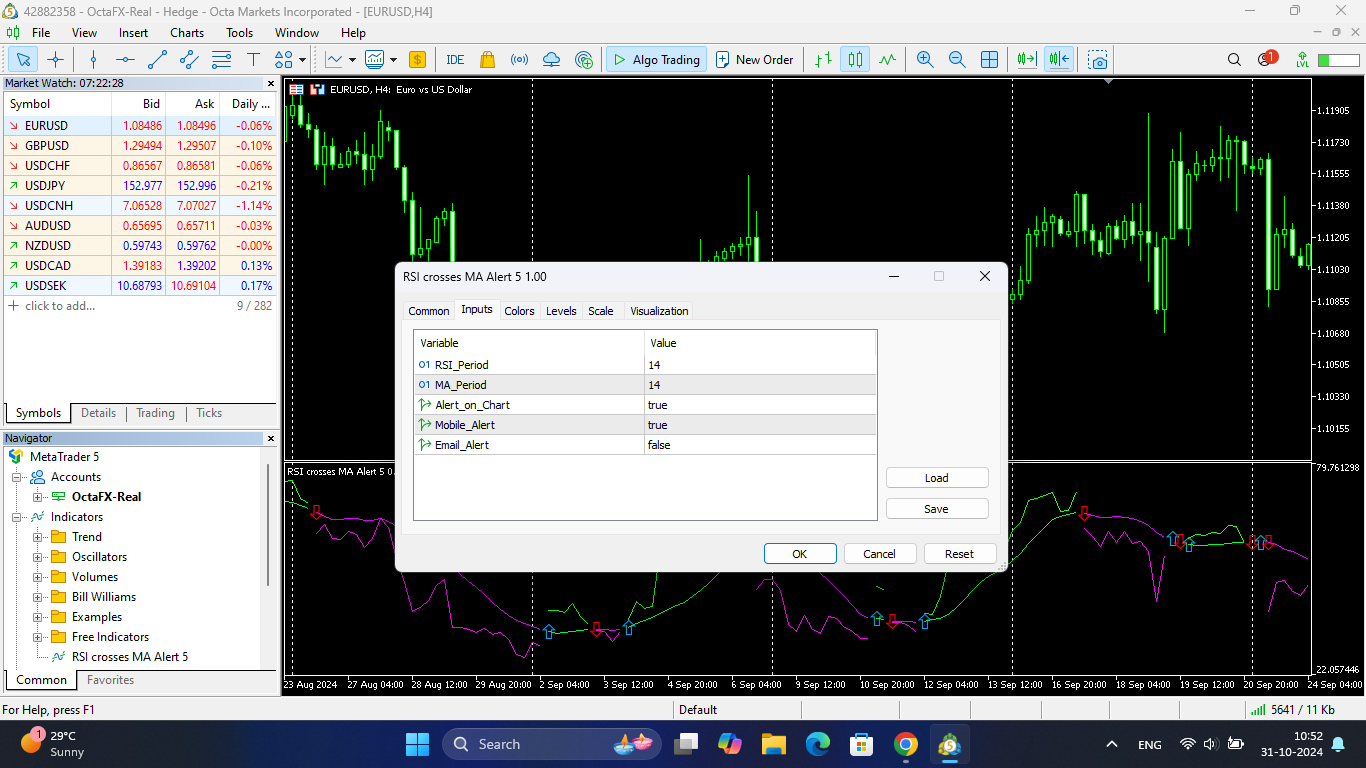
INPUTS EXPLAINED:

1. MA Period - (Default is 14) This is the value for the Simple Moving Average indicator.

2. RSI Period- (Default is 14) This is the value for the Relative Strength Index indicator.

3. Alert On Chart - If input value is "true" then you will get pop up alerts inside your desktop trading terminal.

4. Mobile Alert - If input value is "true"  and you have MT4 or MT5 app installed and alert activated with META ID in your mobile phone. Then you will receive alert notifications for this indicator.

5. Email Alert - This is a tricky one. If you want to receive alerts on your email ID then you will have to input it as "true" and also setup it properly inside your desktop's trading terminal. (Don't worry! You will find many easy to follow video tutorials on YT).

BASIC INFO:

The **Relative Strength Index (RSI)** is a popular technical indicator used in financial markets to assess the strength and speed of a price movement, typically for stocks, cryptocurrencies, or other assets. The **RSI period** refers to the number of previous data points (often days) that are used to calculate the RSI value.


Here's a closer look at what the RSI period means and how it impacts the RSI:


 1. **Understanding RSI Calculation**

   - The RSI measures the average gains and losses over a set period to gauge if an asset is overbought (typically above 70) or oversold (typically below 30).

   - Formulaically, RSI compares the magnitude of recent gains to recent losses over the chosen period, plotting the result on a scale of 0 to 100.


 2. **RSI Period (Lookback Period)**

   - **Standard Setting**: The default RSI period is typically **14 periods** (e.g., 14 days on a daily chart), which is used in most analysis to provide a balanced view of recent price action.

   - **Shorter Periods (e.g., 5 or 7)**: These make the RSI more sensitive, capturing sharper movements and generating signals more frequently but with higher volatility and noise.

   - **Longer Periods (e.g., 20 or 30)**: These smooth out short-term fluctuations, providing a more stable trend view, but may delay signals.


 3. **Implications of Different RSI Periods**

   - **Shorter Period**: Faster response to price changes but may generate more false signals.

   - **Longer Period**: Smoother signals, useful for long-term trends, though it may miss shorter, quick opportunities.


Choosing the best RSI period depends on the investor's goals, the asset's volatility, and the desired balance between signal sensitivity and reliability. 


おすすめのプロダクト
Quantum Falcon Signal Free is a smart visual trading indicator for MetaTrader 4 designed for Forex and Gold traders. The indicator combines: • Trend analysis • RSI momentum confirmation • MACD momentum filtering • ATR volatility filtering • Higher timeframe confirmation • Smart exit signal detection Main Features: • Smart Buy and Sell signals • Exit Buy / Exit Sell alerts • Real-time dashboard on chart • Professional candle arrows • Multi-timeframe trend confirmation • ATR market volatility filt
FREE
The indicator allows you to trade binary options. The recommended time frame is М1 and the expiration time is 1,2,3 minutes. The indicator suitable for auto and manual trading. A possible signal is specified as a arrows above/under a candle. You should wait until the candle closes! Arrows are not re-painted Trade sessions: TOKYO section (Half-end) Currency pairs: USD/JPY Working time frame: M1 Expiration time: 1,2,3 minutes. The indicator also shows good results when using the martingale strateg
FREE
Price Magnet — Price Density and Attraction Levels Indicator Price Magnet is a professional analytical tool designed to identify key support and resistance levels based on statistical Price Density. The indicator analyzes a specified historical period and detects price levels where the market spent the most time. These zones act as “magnets,” attracting price action or forming a structural base for potential reversals. Unlike traditional Volume Profile tools, Price Magnet focuses on price-time d
インディケータは現在のクオートを作成し、これを過去のものと比較して、これに基づいて価格変動予測を行います。インジケータには、目的の日付にすばやく移動するためのテキスト フィールドがあります。 オプション: シンボル - インジケーターが表示するシンボルの選択; SymbolPeriod - 指標がデータを取る期間の選択; IndicatorColor - インジケータの色; HorisontalShift - 指定されたバー数だけインディケータによって描画されたクオートのシフト; Inverse - true は引用符を逆にします。false - 元のビュー。 ChartVerticalShiftStep - チャートを垂直方向にシフトします (キーボードの上下矢印)。 次は日付を入力できるテキストフィールドの設定で、「Enter」を押すとすぐにジャンプできます。
VR Cub
Vladimir Pastushak
VR Cub は、質の高いエントリーポイントを獲得するためのインジケーターです。このインジケーターは、数学的計算を容易にし、ポジションへのエントリーポイントの検索を簡素化するために開発されました。このインジケーターが作成されたトレーディング戦略は、長年にわたってその有効性が証明されてきました。取引戦略のシンプルさはその大きな利点であり、初心者のトレーダーでもうまく取引することができます。 VR Cub はポジション開始ポイントとテイクプロフィットとストップロスのターゲットレベルを計算し、効率と使いやすさを大幅に向上させます。取引の簡単なルールを理解するには、以下の戦略を使用した取引のスクリーンショットを見てください。 設定、設定ファイル、デモ版、説明書、問題解決方法は、以下から入手できます。 [ブログ] レビューを読んだり書いたりすることができます。 [リンク] のバージョン [MetaTrader 5] エントリーポイントの計算ルール ポジションをオープンする エントリーポイントを計算するには、VR Cub ツールを最後の高値から最後の安値までストレッチする必要があります。 最初
SMC Venom Model BPR インジケーターは、スマート マネー (SMC) コンセプトで取引するトレーダー向けのプロフェッショナル ツールです。価格チャート上の 2 つの主要なパターンを自動的に識別します。 FVG   (フェアバリューギャップ) は、3 本のローソク足の組み合わせで、最初のローソク足と 3 番目のローソク足の間にギャップがあります。ボリュームサポートのないレベル間のゾーンを形成し、価格修正につながることがよくあります。 BPR   (バランス価格範囲) は、2 つの FVG パターンの組み合わせで、「ブリッジ」を形成します。これは、価格がボリュームアクティビティの少ない動きで動くときに、ブレイクアウトしてレベルに戻るゾーンで、ローソク足の間にギャップを作成します。 これらのパターンは、大規模な市場プレーヤーと一般参加者の相互作用が発生するチャート上のボリュームと価格動向の分析に基づいて、トレーダーが主要なサポート/レジスタンス レベル、ブレイクアウト ゾーン、エントリ ポイントを識別するのに役立ちます。 インジケーターは、長方形と矢印の形でパターンを視
Gioteen Volatility Index (GVI)   - your ultimate solution to overcoming market unpredictability and maximizing trading opportunities. This revolutionary indicator helps you in lowering your losing trades due to choppy market movements. The GVI is designed to measure market volatility, providing you with valuable insights to identify the most favorable trading prospects. Its intuitive interface consists of a dynamic red line representing the volatility index, accompanied by blue line that indicat
This indicator has been created for finding the probable reversal points of the symbol price. A small candlestick reversal pattern is used it its operation in conjunction with a filter of extremums. The indicator is not redrawn! If the extremum filter is disabled, the indicator shows all points that have a pattern. If the extremum filter is enabled, the condition works – if the history Previous bars 1 candles back contains higher candles and they are farther than the Previous bars 2 candle, such
FREE
SX Supply Demand Zones accurately identifies and draws high-probability Supply and Demand zones using a sophisticated algorithm. Unlike traditional indicators that clutter your chart, this indicator is designed with a focus on performance and a clean user experience. New Unique Feature: Interactive Legend System What truly sets this indicator apart from everything else is the Interactive Control Legend. You have a professional dashboard directly on your chart that allows you to: Show/Hide: Ins
FREE
EARLY REMINDER: The Starting price is 65 price will rise soon up to 365$ and then 750$ after first 10 copies of sales. Grab this offer now! Introduction Hello, traders! Welcome to the demonstration of the Forex Beast Indicator , a comprehensive tool designed to assist aspiring traders in navigating the complexities of the forex market. This indicator incorporates seven essential components to provide a well-rounded trading experience: Moving Averages Colored Zones Support and Resistance Levels
Market Structure Zig Zag
Lesedi Oliver Seilane
4.66 (29)
Free Market structure zig zag to assist in price action trading the screenshots describe how to use and how to spot patterns new version comes with alerts, email alert and  push notification alert can be used on all pairs  can be used on all timeframes  you can add additional confirmation indicators the indicator shows you your higher high and low highs as well as your lower lows and lower highs  the indication makes price action analysis easier to spot.
FREE
Smart FVG インジケーター MT4 – MetaTrader 4 向け高度なフェアバリューギャップ検出 Smart FVG インジケーター MT4 は、MetaTrader 4 上で Fair Value Gap(FVG)をプロフェッショナルレベルで検出・監視し、アラートまで行うツールです。ATR ベースのフィルタリングと相場構造を考慮したロジックを組み合わせることで、ノイズを取り除き、流動性に応じて適応し、本当に重要な不均衡だけを残して精度の高い判断をサポートします。 主な特長 正確な FVG 検出:単なるローソク足のギャップではなく、市場の本質的な非効率を捉えます。 ATR ベースの精度:市場や時間軸が変わっても、低品質なシグナルを自動的にフィルタリング。 有効性のリアルタイム追跡:価格がゾーンを埋める/ブレイクすると、ゾーンが自動で延長・調整・削除されます。 カスタマイズ可能な表示:色・ラインスタイル・塗りつぶしを自由に設定し、どんなテンプレートにも合わせられます。 実用的なアラート:新規 FVG や、埋められた/無効化されたゾーンをリアルタイム通知。 パフォーマンス
FREE
これは、キャンドルの終値を予測する指標です。 このインジケータは、主にD1チャートでの使用を目的としていますが. この指標は、従来の外国為替取引とバイナリオプション取引の両方に適しています。 インジケーターは、スタンドアロンのトレーディングシステムとして使用することも、既存のトレーディングシステムへの追加として機能させることもできます。 このインジケーターは、現在のキャンドルを分析し、キャンドル自体の内部の特定の強度係数と、前のキャンドルのパラメーターを計算します。 したがって、この指標は、市場の動きのさらなる方向性と現在のキャンドルの終値を予測します。 この方法のおかげで、この指標は、短期の日中取引だけでなく、中期および長期の取引にも適しています。 インジケーターを使用すると、市場の状況の分析中にインジケーターが生成する潜在的な信号の数を設定できます。 インジケーターの設定には、このための特別なパラメーターがあります。 また、インジケーターは、チャート上のメッセージの形式で、電子メールで、およびPUSH通知の形式で、新しい信号について通知することができます。 購入後は必ず私に書いて
The indicator detects and displays Shark harmonic pattern (see the screenshot). The pattern is plotted by the extreme values of the ZigZag indicator (included in the resources, no need to install). After detecting the pattern, the indicator notifies of that by a pop-up window, a mobile notification and an email. The indicator highlights the process of the pattern formation and not just the complete pattern. In the former case, it is displayed in the contour triangles. After the pattern is comple
Was: $249  Now: $99   Market Profile defines a number of day types that can help the trader to determine market behaviour. A key feature is the Value Area, representing the range of price action where 70% of trading took place. Understanding the Value Area can give traders valuable insight into market direction and establish the higher odds trade. It is an excellent addition to any system you may be using. Blahtech Limited presents their Market Profile indicator for the MetaTrader community. Ins
「Auto FIBO Pro」Crypto_Forex インジケーターは、取引の補助ツールとして最適です。 - インジケーターは、フィボナッチ レベルとローカル トレンド ライン (赤色) を自動的に計算してチャート上に配置します。 - フィボナッチ レベルは、価格が反転する可能性のある重要な領域を示します。 - 最も重要なレベルは、23.6%、38.2%、50%、61.8% です。 - リバーサル スキャルピングやゾーン グリッド取引に使用できます。 - Auto FIBO Pro インジケーターを使用して、現在のシステムを改善する機会も多数あります。 - Info Spread Swap Display があり、接続されている外国為替ペアの現在のスプレッドとスワップを表示します。 - ディスプレイには、アカウントの残高、エクイティ、マージンも表示されます。 - Info Spread Swap Display は、チャートのどのコーナーにも配置できます。 高品質のトレーディングロボットとインジケーターをご覧になるにはここをクリックしてください! これは、この MQL5 ウェブサイ
We present you the indicator "Candle closing counter", which will become your indispensable assistant in the world of trading. That’s why knowing when the candle will close can help: If you like to trade using candle patterns, you will know when the candle will be closed. This indicator will allow you to check if a known pattern has formed and if there is a possibility of trading. The indicator will help you to prepare for market opening and market closure. You can set a timer to create a pre
Rainbow MT4 is a technical indicator based on Moving average with period 34 and very easy to use. When price crosses above MA and MA changes color to green, it’s a signal to buy. When price crosses below MA and MA changes color to red, it’s a signal to sell. The Expert advisor ( Rainbow EA MT4) based on Rainbow MT4 indicator, as you can see in the short video below is now available here .
FREE
This multi time frame and multi symbol indicator alerts about Heiken Ashi Smoothed color changes. As a bonus it can also scan for Hull Moving Average trend (color) changes. Combined with your own rules and techniques, this indicator will allow you to create (or enhance) your own powerful trading system. Features Can monitor all symbols visible in your Market Watch window at the same time. Apply the indicator to just one chart and instantly monitor the entire market. Can monitor every time frame,
Indicateur Crypto_Forex « HTF Moving Averages Cross » pour MT4. - Améliorez vos méthodes de trading avec le puissant indicateur HTF Moving Averages Cross pour MT4. HTF signifie « période de temps supérieure ». - Cet indicateur est idéal pour les traders de tendance avec des entrées d'action de prix. - Il vous permet d'associer des moyennes mobiles rapides et lentes d'une période de temps supérieure à votre graphique actuel - une méthode professionnelle. - HTF Moving Averages Cross intègre des
Improved version of the free HMA Trend indicator (for MetaTrader 4) with statistical analysis. HMA Trend is a trend indicator based on the Hull Moving Average (HMA) with two periods. HMA with a slow period identifies the trend, while HMA with a fast period determines the short-term movements and signals in the trend direction. The main differences from the free version: Ability to predict the probability of a trend reversal using analysis of history data. Plotting statistical charts for analyzi
Super Reversal Pattern Indicator Unlock the power of advanced pattern recognition with our Super Reversal Pattern Indicator. Designed for traders seeking precision and reliability, this indicator identifies one of the most effective reversal patterns in technical analysis, offering a significant edge in your trading strategy. Key Features: Non-Repainting Accuracy: Enjoy the confidence of non-repainting technology. Once a Super Reversal Pattern is detected, it remains static, providing consiste
TMA AI Bands
Monique Ellen Miranda Dos Santos
TMA AI Bands インジケーターは、三角移動平均 (TMA) を基盤とし、動的な上バンドと下バンド、およびチャート上に直接プロットされた明確な買い/売り矢印を備えています。適応型最適化のための統合 AI を特徴とし、再描画なしを保証し、価格がバンドに触れた際に正確な反転シグナルを提供します。 * 通貨ペア: すべての通貨ペアで動作 * 推奨時間枠: D1 / W1 / MN * 設定可能な外部変数:   * TimeFrame – 計算期間   * HalfLength – 平均の平滑化   * BandsDeviations – バンドの標準偏差   * CenterShift, UpperShift, LowerShift – ラインの微調整   * ShowArrows, ArrowGap – 矢印の表示とオフセット制御 * クリーンなインターフェースとシンプルなビジュアルで、複雑さを避けつつ正確性を求めるトレーダーのために設計されています。
Trade History Drawer is an indicator for MetaTrader 4. It shows trades on the chart and draws them in customized colors. Furthermore, the indicator shows a trade summary and saves a CSV history file for either one selected pair or all pairs. Inputs General Settings Number Trades : Number of trades to be drawn on the chart, if -1 then all trades Magic Number : Only trades with this magic number, if -1 then ignore Line Style : Line Style Line Thickness : Line Thickness Arrow Size : Arrow Size
Volume Profile Sniper v11.1は、包括的な市場分析ツールです 取引への専門的なアプローチ ボリュームプロファイルスナイパー v11.1は、市場状況の包括的な評価に基づいて明確な信号を提供し、一つの指標に15以上の主要なフィルタを組み合わせ 主な特長 ボリューム不均衡分析-アルゴリズムは、各キャンドルの買い手と売り手のシェアを計算し、当事者の1つの優位性を通知します(50%から90%までの設定可能なしきい値)。 マルチレベル信号フィルタリング-インジケータは考慮されます: トレンド指標(9/21) 買われ過ぎ/売られ過ぎゾーンを除くRSI キャンドルパターン(ピンバー、吸収、ハンマー) サポート/抵抗レベル(自動検出) 主要なプレーヤーの活動を識別するためのボリュームスパイク クラシックと増幅されたRSIの相違 ボラティリティ評価のためのATR 傾向の強さを決定するためのADX 価格アクション(内部バーと外部バー) 複数の時間枠の確認 市場構造(高値/安値) セッションフィルタ(アジア、ロンドン、ニューヨークセッション) ニュースの
MACD indicator in MetaTrader 4/5 looks different than MACD does in most other charting software. That is because the MetaTrader 4/5 version of MACD displays the MACD line as a histogram when it is traditionally displayed as a line. Additionally, the MetaTrader 4/5 version computes the Signal line using an SMA, while according to MACD definition it is supposed to be an EMA. The MetaTrader 4/5 version also does not compute a true MACD Histogram (the difference between the MACD/Signal lines). This
FREE
Free informative Indicator-helper. It'll be usefull for traders who trade many symbols or using grid systems (Averaging or Martingale). Indicator counts drawdown as percent and currency separate. It has a number of settings: Count deposite drawdown according equity value and send e-mail or notifications to user if DD more than set; Sending e-mail when max open orders reached; Shows price and remaining pips amount before MarginCall on current chart and Account generally; Display summary trade lot
FREE
Noize Absorption Index - is the manual trading system that measures the difference of pressure between bears forces and bulls forces. Green line - is a noize free index that showing curent situation. Zero value of index shows totally choppy/flat market.Values above zero level shows how powerfull bullish wave is and values below zero measures bearish forces.Up arrow appears on bearish market when it's ready to reverse, dn arrow appears on weak bullish market, as a result of reverse expectation. S
This is a new strategy for SUPPLY DEMAND areas It is based on a calculation using the tick volume to detect the big price action in market for both bear /bull actions this smart volume action candles are used to determine the supply and demand areas prices in between main supply and demand lines indicate sideway market  up arrows will be shown when prices moves above the main supply and the secondary supply lines Down arrows will be shown when prices moves below the main demand and the secondary
Arrow Indicator (Buy/Sell Alerts) – Simple Yet Powerful Tool!             Product Version: 1.01           Indicator Type: Trend Reversal Signals           Timeframes Supported: All (Recommended: H1, H4, D1)           Key Features: Buy Signal: Green upward arrow () appears below the candle  Sell Signal : Red downward arrow () appears above the candle Accurate Trend Reversal Detection – Based on tried and tested SMA strategy. ️ Clean Chart View – Minimalist, non-i
FREE
このプロダクトを購入した人は以下も購入しています
Neuro Poseidon is a new indicator by Daria Rezueva. It combines precise trading signals with adaptive TP/SL levels - creating best possible trades as a result! Message me and get  Neuro Poseidon Assistant  as a gift to automize your trading process! What makes it stand out? 1. Proven profitability on all assets and timeframes 2. Only confirmed BUY and SELL signals present on the chart 3. Adaptive TP & SL levels generated by the software for each trade 4. Easy to understand - suitable for all
Gann Made Easy は、ミスター・ギャンの理論を使用した取引の最良の原則に基づいた、プロフェッショナルで使いやすい外国為替取引システムです。 W・D・ガン。このインジケーターは、ストップロスとテイクプロフィットレベルを含む正確な買いと売りのシグナルを提供します。 PUSH通知を利用して外出先でも取引可能です。 ご購入後、取引方法の説明と優れた追加インジケーターを無料で入手するには、私にご連絡ください! おそらく、ギャンの取引手法についてはすでに何度も聞いたことがあるでしょう。通常、ギャンの理論は初心者のトレーダーだけでなく、すでにある程度の取引経験がある人にとっても非常に複雑なものです。なぜなら、ギャンの取引手法は理論的にはそれほど簡単に適用できるものではないからです。私はその知識を磨き、最良の原則を私の外国為替インジケーターに組み込むために数年を費やしました。 このインジケーターは非常に簡単に適用できます。必要なのは、それをチャートに添付し、簡単な取引推奨事項に従うだけです。このインジケーターは常に市場分析の仕事を行い、取引の機会を探します。適切なエントリーポイントを検出す
M1 SNIPER は使いやすいトレーディングインジケーターシステムです。M1時間足向けに設計された矢印インジケーターです。M1時間足でのスキャルピングのためのスタンドアロンシステムとして、また既存のトレーディングシステムの一部としても使用できます。このトレーディングシステムはM1時間足での取引に特化して設計されていますが、他の時間足でも使用できます。元々、この手法はXAUUSDとBTCUSDの取引用に設計しましたが、他の市場においても役立つと考えています。 インジケーターのシグナルは、トレンドの方向と逆方向に取引できます。インジケーターのシグナルを利用して両方向に取引するのに役立つ特別な取引テクニックをご紹介します。この手法は、特別な動的なサポートとレジスタンスの価格帯を利用することに基づいています。 ご購入後、M1 SNIPER矢印インジケーターをすぐにダウンロードできます。さらに、M1 SNIPERツールのすべてのユーザーに、以下のスクリーンショットに表示されているApollo Dynamic SRインジケーターを無料で提供しています。この2つのインジケーターを組み合わせることで
Trend Catcher ind
Ramil Minniakhmetov
5 (2)
トレンドキャッチャーインジケーター トレンドキャッチャーインジケーターは、開発者独自の適応型トレンド分析指標を組み合わせることで、市場価格の動きを分析します。短期的なノイズを除去し、根底にあるモメンタムの強さ、ボラティリティの拡大、価格構造の挙動に焦点を当てることで、真の市場方向性を特定します。また、移動平均線、RSI、ボラティリティフィルターなどの平滑化およびトレンドフィルタリング機能を備えたカスタマイズ指標も使用します。 実際の運用状況のモニタリングやその他の製品については、こちらをご覧ください: https://www.mql5.com/en/users/mechanic/seller ご注意ください。私はTelegramでEAや設定を販売していません。詐欺です。すべての設定はブログで無料で公開しています。 重要!ご購入後すぐにご連絡ください。手順とボーナスをお送りします!
このインジケーターは実践的なトレードに最適な自動波動分析のインジケーターです! 場合... 注:   Tang Lun (Tang Zhong Shuo Zen) の命名規則の影響で、私は波のグレーディングに西洋の名前を使用することに慣れていません。基本的な波を ペン 、二次波のバンドを セグメント と名付けました。同時に、 セグメント にはトレンドの方向が指定されます (この命名方法は将来のノートで使用されます。最初に言っておきます)。ただし、アルゴリズムは曲がりくねった理論とはほとんど関係がないため、付けるべきではありません。これは、私の市場分析 によって要約された、絶えず変化する複雑な運用ルール を反映しています。 バンドは標準化され、人によって異なることがないよう定義されており、市場参入を厳密に分析する上で重要な役割を果たす人為的な干渉の描画方法が排除されています。 このインジケーターを使用することは、取引インターフェイスの美しさを改善することと同等であり、元の K ライン取引を放棄し、取引の新しいレベルに連れて行きます。また、宣伝の観点から顧客の認識も向上します。 イ
Scalper Inside PRO Scalper Inside PRO は、MetaTrader 4 向けの短期トレンドおよびスキャルピング用インジケーターです。独自アルゴリズムを用いて、市場の方向性と主要なターゲットレベルを素早く検出します。エントリー、イグジット、複数の利確ターゲットを自動計算し、詳細なパフォーマンス統計を表示することで、さまざまな銘柄やストラテジーがどのように機能してきたかを確認できます。これにより、現在のマーケットコンディションに最も適した取引銘柄を選択するのに役立ちます。さらに、Scalper Inside PRO には、お使いの矢印インジケーターを簡単に接続でき、その統計と過去のパフォーマンスを素早く評価できます。 本インジケーターは、あらゆる銘柄と時間足で動作し(短期トレードには M5 を推奨)、複数の内蔵ストラテジーを備えています。そのため、単体のスキャルピングツールとしても、トレーディングシステム内の強力な分析コンポーネントとしても活用できます。 主な機能 独自アルゴリズム(Next‑Generation Trend Detection Algor
Trend Breakout Arrows Indicator The Trend Breakout Arrows Indicator is a momentum-based signal tool designed to identify potential bullish and bearish breakout opportunities. It displays clear arrow signals directly on the price chart, helping traders quickly recognize possible trend changes and continuation setups. Up Arrow (Buy Signal) A magenta up arrow appears below a candle when bullish momentum begins to strengthen. This signal indicates that buying pressure may be overtaking selling press
PRO Renko Systemは、特別にRENKOチャートを取引するために設計された高精度の取引システムです。 これは、様々な取引商品に適用することができる普遍的なシステムです。 システムは効果的に正確な逆転信号へのアクセスを与えるいわゆる市場の騒音を中和する。 表示器は非常に使いやすく、信号の生成に責任がある1つの変数だけがあります。 あなたは簡単にお好みの任意の取引ツールとレンコバーのサイズにツールを適応させることができます。 私はいつもあなたが私のソフトウェアで収益性の高い取引を支援するために余分なサポートを提供する準備ができています! 私はあなたに幸せで収益性の高い取引をしたいです! ご購入後にご連絡ください! 私はあなたに私のレンコチャートジェネレータを送信します。 私はまた、私の個人的な推奨事項やシステムの他のモジュールを無料で共有します!
Current event:  https://c.mql5.com/1/326/A2SR2025_NoMusic.gif A. A2SR とは何ですか ?   * 先行テクニカル指標です (塗り直しなし、ラグなし)。 -- ガイダンス : -- https://www.mql5.com/en/blogs/post/734748/page4#comment_16532516 -- そして https://www.mql5.com/en/users/yohana/blog A2SR には、サポート (需要) とレジスタンス (供給) のレベルを決定する特別な手法があります。 ネットで見かける通常の方法とは異なり、A2SR は実際の SR レベルを決定する独自のコンセプトを持っています。 元の手法はインターネットから取得されたものではなく、インターネット上で公開されたこともありません。 A2SR は、取引スタイルに応じて SR レベルを自動選択します。 時間枠を変更しても、SR レベルはその位置にとどまります。 実際のSRは、使用する時間枠から取得されるわけではないため. A2SR
Advanced Supply Demand
Bernhard Schweigert
4.91 (300)
現在30%オフ 初心者にもエキスパートトレーダーにも最適なソリューション このインジケーターは独自の機能と新しい公式を多数内蔵しており、ユニークで高品質かつ手頃な取引ツールです。このアップデートでは、2つの時間枠ゾーンを表示できるようになります。より長いTFだけでなく、チャートTFとより長いTF(ネストゾーンを表示)の両方を表示できます。すべてのSupply Demandトレーダーの皆さんのお気に召すはずです。:) 重要情報の公開 Advanced Supply Demandの可能性を最大化するには、 https://www.mql5.com/ja/blogs/post/720245 にアクセスしてください。   エントリーまたはターゲットの正確なトリガーポイントを正確に特定できれば取引がどのように改善されるか想像してみてください。新しい基盤となるアルゴリズムに基づいて構築されているため、買い手と売り手の間の潜在的な不均衡をさらに簡単に特定できます。これは、最も強い需要と供給のゾーンと、過去のパフォーマンス(古いゾーンを表示)がグラフィカルに表現されるためです。これらの機能は、最適な
MetaBands M4
Vahidreza Heidar Gholami
3.5 (6)
MetaBandsは、強力でユニークなアルゴリズムを使用してチャンネルを描画し、トレンドを検出して、トレーダーに取引の入出ポイントを提供することができます。チャンネル指標に加えて、強力なトレンド指標でもあります。入力パラメータを使用して新しいチャンネルを作成するために、異なるタイプのチャンネルを統合することができます。MetaBandsは、市場のイベントについてユーザーに通知するために、すべてのタイプのアラートを使用します。 特徴 ほとんどのチャンネルアルゴリズムをサポート 強力なトレンド検出アルゴリズム 異なるタイプのチャンネルを統合する能力 マルチタイムフレームおよびマルチカレンシー(シグナルマトリックス) すべてのタイプのアラート機能(サウンド、画面フラッシャー、プッシュ通知、メール、ポップアップ、矢印) 再描画しない トレンド検出 MetaBandsは、チャネル内を振動する青いラインを使用してトレンドを検出します。ラインがチャネルの上部バンドに達すると、下降トレンドの開始を示し、下部バンドに達すると上昇トレンドの開始を示します。青いラインが中心ラインに近づくと、市場はコンソリ
Genesis Matrix Pro is a professional multi-timeframe trend detection indicator designed to help traders identify high-quality market alignment with clarity and structure. It combines 12 different technical indicators into one visual alignment matrix, allowing traders to quickly see when market conditions are bullish, bearish, or neutral. A signal is generated only when the selected strategies are aligned, helping reduce noise and improve decision-making. PLEASE CONTACT ME AFTER PURCHASE TO GET
この製品は 2026 年の市場向けに更新され、最新の MT5 ビルドに最適化されています。 価格更新のお知らせ: Smart Trend Trading System は現在 $99 で提供されています。 次の 30 件の購入 後、価格は $199 に上がります。 特別オファー: Smart Trend Trading System を購入後、私にプライベートメッセージを送ることで、 Smart Universal EA を無料 で受け取り、Smart Trend のシグナルを自動売買に変えることができます。 Smart Trend Trading System は、リペイントなし、再描画なし、遅延なしの完全なトレーディングシステムです。よりクリーンなシグナル、より明確なトレンド方向、そしてより整理された取引方法を求めるトレーダー向けに作られています。 Online course , manual and download presets . このシステムは、トレンド検出、反転ゾーン、Smart Cloud、トレーリングストップロジック、サポートとレジスタンス、ローソク足の色分け、ア
Dynamic Forex28 Navigator - 次世代の Forex 取引ツール。 現在 49% オフ。 Dynamic Forex28 Navigator は、長年人気のインジケーターを進化させたもので、3 つの機能を 1 つにまとめています。 Advanced Currency Strength28 インジケーター (レビュー 695 件)  + Advanced Currency IMPULSE with ALERT (レビュー 520 件) + CS28 コンボ シグナル (ボーナス)。 インジケーターの詳細 https://www.mql5.com/en/blogs/post/758844 次世代の Strength インジケーターが提供するもの  オリジナルで気に入っていたすべての機能が、新機能と精度の向上によって強化されました。 主な機能: 独自の通貨強度計算式。 すべての時間枠でスムーズかつ正確な強度ライン。 トレンドの特定と正確なエントリーに最適です。 ダイナミックマーケットフィボナッチレベル (マーケットフィボナッチ)。 このインジケーターに固有
BTMM State Engine Pro is a MetaTrader 4 indicator for traders who use the Beat The Market Maker approach: Asian session context, kill zone timing, level progression, peak formation detection, and a multi-pair scanner from a single chart. It combines cycle state logic with a built-in scanner dashboard so you do not need the same tool on many charts at once. What it does Draws the Asian session range; session times can follow broker server offset or be set in inputs. Tracks level progression (L
IQ FX Gann Levels a precision trading indicator based on W.D. Gann’s square root methods . It plots real-time, non-repainting support and resistance levels to help traders confidently spot intraday and scalping opportunities with high accuracy. William Delbert Gann (W.D. Gann) was an exceptional market analyst, whose trading technique was based on a complex blend of mathematics, geometry, astrology, and ancient mathematics which proved to be extremely accurate. Setup & Guide:  Download  MT5 Ver
スイングトレーディング は、トレンドの方向のスイングと可能な反転スイングを検出するように設計された最初のインジケーターです。トレーディングの文献で広く説明されているベースラインスイングトレーディングアプローチを使用します。インディケータは、いくつかの価格と時間のベクトルを調査して、全体的なトレンドの方向を追跡し、市場が売られ過ぎまたは買われ過ぎて修正の準備ができている状況を検出します。 [ インストールガイド | 更新ガイド | トラブルシューティング | よくある質問 | すべての製品 ] むち打ちを起こさずに市場スイングの利益 インジケーターは常にトレンドの方向を表示します 色付きの価格帯は機会のベースラインを表します 色付きのダッシュは、可能な反転スイングを表します この指標は、独自の品質とパフォーマンスを分析します 複数時間枠のダッシュボードを実装します カスタマイズ可能なトレンドおよびスイング期間 電子メール/サウンド/プッシュアラートを実装します インジケータは再描画またはバックペインティングではありません Swing Tradingとは Swing Tradingは
Price & Time Market Structure Indicator A professional market structure tool that analyzes waves through both price and time — not price alone. Main Description NeoWave PRO is a professional market structure indicator for MetaTrader 4 designed for traders who want to move beyond traditional one-dimensional wave tools such as ZigZag, swing indicators, and basic high/low systems. Most wave indicators analyze only one thing: Price. But a real market wave is not only a price movement. A true wave de
GOLD Impulse with Alert
Bernhard Schweigert
4.67 (12)
このインディケータは、当社の2つの製品 Advanced Currency IMPULSE with ALERT  +   Currency Strength Exotics . のスーパーコンビネーションです。 このインジケーターは全ての時間枠で作動し、8つの主要通貨と1つのシンボルの強弱のインパルスをグラフで表示します。 このインジケータは、金、エキゾチックペア、商品、インデックス、先物など、あらゆるシンボルの通貨強度の加速度を表示することに特化されています。金、銀、原油、DAX、US30、MXN、TRY、CNHなどの通貨強度の加速度(インパルスまたは速度)を表示するために、任意のシンボルを9行目に追加できる、この種の最初のものです。 新しいアルゴリズムに基づいて構築され、潜在的な取引の特定と確認がさらに容易になりました。これは、通貨の強さや弱さが加速しているかどうかをグラフィカルに表示し、その加速の速度を測定するためです。加速すると物事は明らかに速く進みますが、これはFX市場でも同じです。つまり、反対方向に加速している通貨をペアリングすれば、潜在的に利益を生む取引を特定
「 Dynamic Scalper System 」インジケーターは、トレンド波の中でスキャルピング取引を行う手法のために設計されています。 主要通貨ペアと金でテスト済みで、他の取引商品との互換性があります。 トレンドに沿った短期的なポジションオープンのシグナルを提供し、追加の価格変動サポートも提供します。 インジケーターの原理 大きな矢印はトレンドの方向を決定します。 トレンド波の中では、小さな矢印の形でスキャルピングシグナルを生成するアルゴリズムが機能します。 赤い矢印は強気方向、青い矢印は弱気方向です。 トレンドの方向には敏感な価格変動ラインが描かれ、小さな矢印のシグナルと連動します。 シグナルは次のように機能します。適切なタイミングでラインが現れるとエントリーシグナルが形成され、ラインが開いている間はポジションが保持され、完了すると取引が終了します。 推奨される動作時間枠はM1~H4です。 矢印は現在のローソク足に形成され、次のローソク足が開いている場合は、前のローソク足の矢印は再描画されません。 入力パラメータ Trend Wave Period - トレンド方向
MT5版もご用意しています https://www.mql5.com/ja/market/product/170916 M30/H1/H4スイング版もあります M5/M15では取りきれない大きな波を狙いたい方へ。 Gold Signal Swing Pro(M30/H1/H4対応)を販売中。 1トレードで$20〜$80+の値幅を狙う。 https://www.mql5.com/en/market/product/177643 KURAMA GOLD SIGNAL PRO(MT4版)— 7層フィルター・自動TP/SL・品質スコア搭載 XAUUSD完全トレードシステム リペイントなし。リドローなし。ラグなし。すべてのサインは確定後に変わりません。見たままが結果です。 特典:買い切りライセンスをご購入いただいた方に、AI Zone Radar($59相当)+PDFマニュアルを無料プレゼント。購入後にMQL5でメッセージをお送りください
123パターン は、最も人気のある強力で柔軟なチャートパターンの1つです。このパターンは、3つの価格ポイントで構成されています。ボトム、ピークまたはバレー、および38.2%〜71.8%のフィボナッチリトレースメントです。パターンは、価格が最後のピークまたは谷、インディケーターが矢印をプロットし、アラートを上昇させ、取引を行うことができる瞬間を超えたときに有効と見なされます。 [ インストールガイド | 更新ガイド | トラブルシューティング | よくある質問 | すべての製品 ] クリアな取引シグナル カスタマイズ可能な色とサイズ パフォーマンス統計を実装します カスタマイズ可能なフィボナッチリトレースメントレベル 適切なストップロスおよび利益レベルを表示します インジケーターを使用して、継続パターンまたは反転パターンを見つけることができます 再描画および非再描画ではありません 電子メール/音声/視覚アラートを実装します 123パターン は、継続パターンまたは反転パターンとして現れます。物事を簡単にするために、このインジケーターを使用して、検索するパターンのタイプを選択できるため
Enigmera
Ivan Stefanov
5 (8)
ENIGMERA: 市場の中心 重要:MQL5.comのデモはStrategy Testerで実行されており、Enigmeraの機能を完全には反映していない場合があります。詳細については、説明、スクリーンショット、ビデオをご確認ください。質問があれば、遠慮なくメッセージを送ってください! インジケーターのコードは完全に書き直されました。バージョン3.0は新機能を追加し、インジケーターの開始以来蓄積されたバグを修正しました。 紹介 このインジケーターとトレーディングシステムは、金融市場への注目すべきアプローチです。ENIGMERAはフラクタルサイクルを使用して、サポートとレジスタンスのレベルを正確に計算します。真の蓄積フェーズを示し、方向と目標を提供します。トレンドでも修正でも機能するシステムです。 動作方法 インジケーターのほとんどの機能は、チャートの左側にあるボタンで制御され、市場の状況に迅速に対応できるようになっています。 ボタン ON/OFF – インジケーター全体を表示または非表示にします。 Channel – サポートチャネルを有効にし、許容範囲の偏差を示します。 Dev
地震計マーケット クエイク検出器。 Description in English : https://www.mql5.com/en/market/product/113869?source=Site+Market+Product+Page#description How to use the Seismograph : https://www.mql5.com/en/market/product/113869#!tab=comments&page=2&comment=52806941 Create an EA : https://www.mql5.com/en/market/product/113869#!tab=comments&page=3&comment=52816509 どのような取引方法であれ、流動性の低い市場への参入は避けたいものです。 地震計は、市場が上昇する前に市場に参入する適切なタイミングに役立ちます。 しかし、忙しいはずの市場時間帯にエントリーするようにしたにもかかわらず、流動性の低い市場に閉じ込められてしまう人が多いのが実情です。 数時間待った後、
Scalper Vault は、スキャルピングを成功させるために必要なすべてを提供するプロフェッショナルなスキャルピング システムです。このインジケーターは、外国為替およびバイナリー オプションのトレーダーが使用できる完全な取引システムです。推奨される時間枠は M5 です。 システムは、トレンドの方向に正確な矢印シグナルを提供します。また、トップとボトムのシグナルとギャン マーケット レベルも提供します。 インジケーターは、プッシュ通知を含むすべてのタイプのアラートを提供します。 インジケータの購入後にご連絡ください。私の個人的な取引の推奨事項と素晴らしいボーナス指標を無料で共有します! 幸せで有益な取引をお祈りします!
Introduction to Fractal Pattern Scanner Fractal Indicator refers to the technical indicator that makes use of the fractal geometry found in the financial market. Fractal Pattern Scanner is the advanced Fractal Indicator that brings the latest trading technology after the extensive research and development work in the fractal geometry in the financial market. The most important feature in Fractal Pattern Scanner is the ability to measure the turning point probability as well as the trend probabi
トレンドラインプロ   市場の真の方向転換点を理解するのに役立ちます。この指標は、真のトレンド反転と主要プレーヤーが再び参入するポイントを示します。 分かりますか     BOSライン   複雑な設定や不要なノイズなしに、より長い時間足でのトレンドの変化と重要なレベルを把握できます。シグナルは再描画されず、バーが閉じた後もチャート上に残ります。 VERSION MT 5     -     RFI LEVELS PRO インジケーター と組み合わせることで、その潜在能力を最大限に発揮します。 インジケーターが示す内容: 本当の変化   トレンド(BOSライン) 一度シグナルが現れたら、それは有効です!これは、リペイント機能を持つインジケーターとの重要な違いです。リペイント機能を持つインジケーターは、シグナルを発した後、それを変更し、資金の損失につながる可能性があります。これにより、より高い確率と精度で市場に参入できます。また、矢印が現れた後、目標値(利益確定)に達するか、反転シグナルが現れるまで、ローソク足の色を変更する機能もあります。 繰り返しエントリ       主要プレーヤーの
The Propfolio Master Suite is the ultimate all-in-one analytical workstation for professional traders. Combining the power of the Beat The Market Maker (BTMM) methodology, Smart Money Concepts (SND/Liquidity), and Advanced Volume Profile, this suite replaces multiple different indicators with one optimized engine. Monitor up to 14 pairs simultaneously from a single chart, instantly identify market cycles, and seamlessly map institutional footprints with the click of a button. The Command Center
このインジケーターは、反転ポイントと価格戻りゾーンを正確に表示します。     主要プレーヤー 。新たなトレンドが形成される場所を把握し、最大限の精度で意思決定を行い、すべての取引をコントロールします。 TREND LINES PRO インジケーターと組み合わせることで、その潜在能力を最大限に発揮します。 VERSION MT5 インジケーターが示す内容: 新しいトレンドの始まりに活性化する反転構造と反転レベル。 リスクと報酬の比率を最小限に抑えた利益 確定 と 損失停止の レベルの表示     RR 1:2   。 インテリジェントな削減ロジックによるストップロス。 指定されたインジケーターから 2 つのトレンド タイプの反転パターンを表示します。 指標: トレンドを追う   TREND LINES PRO   (世界的なトレンドの変化) TREND PRO   (クイックトレンド変更) シンプルで効果的   スキャナー   リアルタイムトレンド(新機能)。 マルチタイムフレームのインストゥルメント フィルタリング。 画面   利益     LOGIC AI信号の後。 当日プラス方
現在40%オフ! 初心者やエキスパートトレーダーに最適なソリューション! このインジケータは、独自の機能と秘密の数式を組み込んだ、ユニークで高品質かつ手頃な価格のトレーディングツールです。たった1枚のチャートで28の通貨ペアのアラートを表示します。新しいトレンドやスキャルピングチャンスの引き金となるポイントを正確に把握することができるので、あなたのトレードがどのように改善されるか想像してみてください! 新しい基本的なアルゴリズムに基づいて構築されているため、潜在的な取引の特定と確認がより簡単になります。これは、通貨の強さや弱さが加速しているかどうかをグラフィカルに表示し、その加速のスピードを測定するためです。加速すると物事は明らかに速く進みますが、これはFX市場でも同じです。つまり、反対方向に加速している通貨をペアにすれば、利益を生む可能性のある取引を特定することができるのです。 通貨の勢いを示す縦の線と矢印は、あなたの取引の指針となるでしょう。 ダイナミックマーケットフィボナッチ23レベルはアラートトリガーとして使用され、市場の動きに適応します。もしインパルスが黄色のトリガ
作者のその他のプロダクト
This is a simple utility which will put Automatic Stop Loss and Take Profit. It also has Trailing Stop Loss and Break Even features. The input value of the Stop Loss and Take Profit is in Pips. Whenever you open a trade it will put stop loss and take profit in pips automatically. *If you need a more practical stop loss and take profit for your trades then you may like this ATR based stop loss utility,  Here! Inputs: 1. SL and Trailing SL - This is the Stop Loss value in Pips. Also used as Traili
This is a simple utility which will put Automatic Stop Loss and Take Profit. It also has Trailing Stop Loss and Break Even features. The input value of the Stop Loss and Take Profit is in Pips. Whenever you open a trade it will put stop loss and take profit in pips automatically. *If you need a more practical stop loss and take profit for your trades then you may like this ATR based stop loss utility,   Here! Inputs: 1. SL and Trailing SL - This is the Stop Loss value in Pips. Also used as Trai
The indicator is based on the concept of price channels, which are formed by plotting the highest high and lowest low prices over a specified period of time. The Donchian Channel Indicator consists of three lines: an upper channel line, a lower channel line, and a middle channel line. The upper channel line represents the highest high over a specified period, while the lower channel line represents the lowest low. The middle channel line is the average of the two and can be used as a reference f
FREE
Trade BTN
Prafull Manohar Nikam
T his is an ON CHART trade management panel. In other words, ON CHART Lot Size, Buy, Sell, Stop Loss, Take Profit, Close Buy, Close Sell and Close All buttons! *IMPORTANT NOTE: Input settings are NOT usable. You can change or insert Stop Loss and Take Profit values only on the chart panel. (See the below video!) This one is MT5 version! BUTTONS List: 1. Lot Size - (0.01) is default click on it and insert the lot size with which you want to open a trade. 2. Stop Loss - (0.0) is default click on
FREE
Easy to use EA designed to auto trade. Works in every market condition. It uses reliable levels of MACD indicator combined with unique logic to perform fully automatic trading operations. *For MT4 version please go here! *If you don't like automated system and only need an alert system to help you in trading. Please check this arrow with alert system  here! FEATURES: Dangerous methods like martingale, hedge, grid or scalping are NOT used. Each position has Stop Loss and Take Profit. Positional
FREE
M ulti Cross Alert! on your smartphone. Use multiple indicators to get a crossover signal on chart as well as on MetaTrader app. You can use all crossovers at the same time but it is not recommended cause your chart will look messy. Instead use combination of two indicators which will be better. IMP NOTE:- More indicators will be added in future updates. Any suggestions regarding indicators are welcome!   Indicators List: 1. MA (Cross) 2. RSI (OB/OS) 3. MACD Lines (Main Line & Signal Line Cross)
FREE
Trade BTN 4
Prafull Manohar Nikam
This is an ON CHART trade management panel. In other words, ON CHART Lot Size, Buy, Sell, Stop Loss, Take Profit, Close Buy, Close Sell and Close All buttons! *IMPORTANT NOTE: Input settings are NOT usable. You can change or insert Stop Loss and Take Profit values only on the chart panel. (See the below video!) This one is MT4 version! BUTTONS List: 1. Lot Size - (0.01) is default click on it and insert the lot size with which you want to open a trade. 2. Stop Loss - (0.0) is default click on i
FREE
The indicator is based on the concept of price channels, which are formed by plotting the highest high and lowest low prices over a specified period of time. The Donchian Channel Indicator consists of three lines: an upper channel line, a lower channel line, and a middle channel line. The upper channel line represents the highest high over a specified period, while the lower channel line represents the lowest low. The middle channel line is the average of the two and can be used as a reference f
FREE
S imple arrow with alert on chart. This is NOT an entry indicator but a direction indicator. It uses MACD signal line to show you possible future direction of a trend. Please use it with other filters or confirmations to trade properly. Recommended for scalping and short term trades. Made for EURUSD M5 but it should work on every major pair on M5 timeframe. For MT4 version please go here! *If you need fully automated trading system. Please check this EA  here! FEATURES: Very simple directional i
FREE
S imple arrow with alert on chart. This is NOT an entry indicator but a direction indicator. It uses MACD signal line to show you possible future direction of a trend. Please use it with other filters or confirmations to trade properly. Recommended for scalping and short term trades. Made for EURUSD M5 but it should work on every major pair on M5 timeframe. For MT5 version please go here! *If you need a fully automated trading system. Please check this EA here! FEATURES: Very simple directional
FREE
Easy to use EA designed to auto trade. Works in every market condition. It uses reliable levels of MACD indicator combined with unique logic to perform fully automatic trading operations. *For MT5 version please go   here! *If you don't like automated system and only need an alert system to help you in trading. Please check this arrow with alert system  here! FEATURES: Dangerous methods like martingale, hedge, grid or scalping are NOT used. Each position has Stop Loss and Take Profit. Positiona
FREE
M ulti Cross Alert! on your smartphone. Use multiple indicators to get a crossover signal on chart as well as on MetaTrader app. You can use all crossovers at the same time but it is not recommended cause your chart will look messy. Instead use combination of two indicators which will be better. IMP NOTE:- More indicators will be added in future updates. Any suggestions regarding indicators are welcome!   Indicators List: 1. MA (Cross) 2. RSI (OB/OS) 3. MACD Lines (Main Line & Signal Line Cross)
FREE
S imple scalping EA which uses martingale lot system. Scalping happens on candlestick pattern and candle size in pips. This is a full automatic trading system which has auto money management option too. FEATURES: 1. Martingale 2. NO Grid 3. Scalping 4. Hard Stop Loss 5. Easy Take Profit 6. Uses Candlestick Pattern Important Note : - As name suggests it is a Martingale System. Always better to use minimal/proper martingale settings and proper trading capital otherwise it can easily blow your acco
Count MACD 4
Prafull Manohar Nikam
Easy to use EA capable of full automatic trading. NO Martingale (Original Strategy), NO Grid, High Win Rate, Low Drawdown EA. It uses multiple signal confirmation of MACD indicator to open a trade. (Ideal Buy-Sell Count i.e. BS Count = 3)! *Important:   1. Do not use Auto Stop Out (keep it false!) if you want to get better results from this expert advisor. Because (BS Count=3) has relatively high win rate so you don't need to worry about drawdowns. 2. Do not use Martingale & Visible SL-TP. (Not
EMA Scalper 4
Prafull Manohar Nikam
V ery simple EA uses the famous trend scalping i.e. EMA Crossover scalping to open trades with martingale lot system. It includes 03 EMA i.e. Exponential Moving Averages to decide which direction to trade. It also checks distance of a fast moving average from the trend moving average. After all these conditions get fulfilled it opens a position. Single position at a time with hard stop loss and take profit. Features: 1. Martingale 2. Uses trend indicators 3. Automatic Trading 4. Hard Stop Loss
Bolli Plus 4
Prafull Manohar Nikam
T his EA trades with trend so it has high win percentage. Uses trend indicators like Bollinger Bands and Moving Averages. This is NO Martingale system but it uses lots multiplier to increase the gains. You can easily disable the lots multiplier by changing it to 1.   Features: 1. NO Martingale 2. NO Grid 3. High Win Rate Strategy. 4. Low Drawdown. 5. Uses STOP OUT Percent instead of usual Stop Loss. 6. But uses the usual Take Profit in pips.   Account Requirements: 1. Minimum Balance - 1000 USD
BB Scalper 4
Prafull Manohar Nikam
This is a trend scalping EA because it uses trend indicators like Bollinger Bands and Moving Average. Easy to use forex expert advisor designed for EURUSD H1 but fully capable of trading other forex pairs and other timeframes too.  Features: 1. NO Grid 2. NO Martingale 3. Smart Lot Sizing 4. Auto Take Profit in Money 5. Auto Stop Out at % of Balance 6. Minimal Inputs 7. Can trade 100 USD Account too. 8. High Win Rate 9. Positive Equity Curve Account Requirements: *Broker - Any *Account type - He
This is a simple arrow system based on MACD indicators Main/Base line and MACD Levels. It gives you alerts when MACD's Main Line crosses above/below certain level. Which type of alerts available? 1. It paints on chart Up/Down Arrows. 2. Popup message and sound alert in trading terminal window. 3. Push notification or Alert on your android and ios mobile phones (requires MT4 or MT5 app installed!)
This is a simple arrow system based on Engulfing Candlestick Pattern. It gives you alerts on your smartphone when there is an engulfing candlestick pattern happens. Which type of alerts available? 1. It paints on chart Up/Down Arrows. 2. Popup message and sound alert in trading terminal window. 3. Push notification or Alert on your Android and IOS mobile phones (requires MT4 or MT5 app installed!) *Note: Use it on higher timeframes like H4 (4 hours), D1 (1 Day) then find trade opportunities on s
Base MACD 4
Prafull Manohar Nikam
This is a modern MACD indicator based on regular MACD indicator. It also has alert system included. This indicator gives you alerts when base line of MACD indicator crosses above or below Zero level so you can look for Buy or Sell opportunity. Available Alerts: 1.          Audible Alerts on Chart / Trading Terminal window. 2.          Alerts on your email. 3.          Alerts on your mobile phone. Type of Alerts Explained: 1. Audible_Chart_Alerts   - Audible alerts and Popup message on your compu
If you are using naked eyes to find candlestick patterns on your chart it's a good thing but it requires your time and attention and still you miss some patterns here and there. Don't worry! This indicator will help you to find "Harami Candlestick Pattern" on your chart very easily. *Note:   Default inputs are set for EURUSD H1 (1 hour) timeframe. This is an alert system which gives you alerts whenever harami candlestick pattern happens. Types of alerts it can give you are: 1. Audible Alerts   -
This indicator uses candlesticks with large real bodies to predict possible market structure shift. Displacement is a very powerful move in price action resulting in strong selling or buying pressure. Generally speaking, displacement will appear as a single or a group of candles that are all positioned in the same direction. These candles typically have large real bodies and very short wicks, suggesting very little disagreement between buyers and sellers. Often, a displacement will occur just af
This is a simple utility which will put automatic Stop Loss and Take Profit on every new trade based on ATR values. It also has Stop Loss Trailing and Break Even function. Whenever you open a trade, it will put ATR times Stop Loss and Take Profit automatically. Stop loss and take profit are two important tools used by traders to manage risk and set profit targets in financial markets. The Average True Range (ATR) indicator can be a valuable tool in helping traders determine appropriate levels fo
This is a simple EA which works on the EMA crossover strategy. It uses fixed pips to put hard Stop Loss and Take Profit levels on every trade. Warning! This is a martingale system which may or may not wipe your trading account. If you want to take the risk anyway then must use it with proper money and risk management. NOTE: Martingale is good for compounding the account in less time. In other words, “Grow it or Blow it!” POINTS: 1. Martingale System 2. Works in all markets. 3. Very Risky! 4. Ha
Simple alert system which will alert you on your mobile terminal, email and on the chart whenever RSI crosses below the overbought level or above the oversold level. Use this alert system, so you don’t have to watch the chart all day for the RSI levels to break. INPUTS: 1.        RSI Period- (Default is 14). Number of candles the RSI indicator will look back for the calculations. 2.        OB Level- (Default is 70). This is the Overbought level or Upper level for the RSI indicator. 3.        OS
This trading robot is strictly made for 10K Capital Trading Account and EURUSD H1. DO NOT use it on smaller accounts, because it has minimum free margin limit i.e. Free Margin > 500 (this value is in "actual money" not in "percentage"!) This is a Simple Grid Trading System which works on ADX indicator's volatility and with High Winrate. IMPORTANT: Default input settings are the bare minimum settings (not ideal) instead use the recommended settings (OR find your own best settings) provided in th
This is a simple trading robot which works on the EMA crossover strategy. It uses ATR indicator based hard Stop Loss and Take Profit levels on every trade. Also uses very risky Martingale Lot System. As mentioned early, this is a martingale system which may or may not wipe your trading account. You must use it with proper input settings and proper money-risk management. Symbol: EURUSD Timeframe: H1 ACCOUNT REQUIREMENTS: Minimum balance             =    $1000 Minimum leverage            =     1
H1 Hedge EA 4
Prafull Manohar Nikam
This is a very simple EA which uses distance from EMA Crossover strategy to open automatic trades. It has NO stop loss but has the take profit in money feature. This is an optional martingale system, it has a lot multiplier option if you want to use it to increase the successive trade volume. Don't trust the description, just download the demo today and test it yourself to know more about this trading robot.  (Backtest on longer periods like 5-10-20 years with 99-100% tick quality). Recommended:
Warning! This is a Martingale Trading System. This EA uses the Bollinger Bands indicator to open automatic trades on your account. If price crosses the upper/lower Bollinger band with certain distance (in pips), it opens an initial trade. After that initial trade, if price moves certain distance (in pips) from the initial trade, EA will open next trade with Martingale Lot and so on. Not recommended to use it on trading accounts smaller than 10K. Even on 10K+ account you have to use it with caut
If you prefer manual trading and open multiple trades then this utility is just made for you. This is a simple utility which will close all your open trades at TP1, TP2 and TP3 by the given input percentage. NOTE: - This utility is helpful for multiple trades only (not for a single trade). You can set three Take Profit levels/targets at three Percentages to close trades partially. Inputs Explained: 1. TP 1 Pips - here you can set the first Take Profit Target in Pips for all trades combined. 2. 
フィルタ:
レビューなし
レビューに返信