Multi Time frame
- インディケータ
- バージョン: 1.0
- アクティベーション: 20

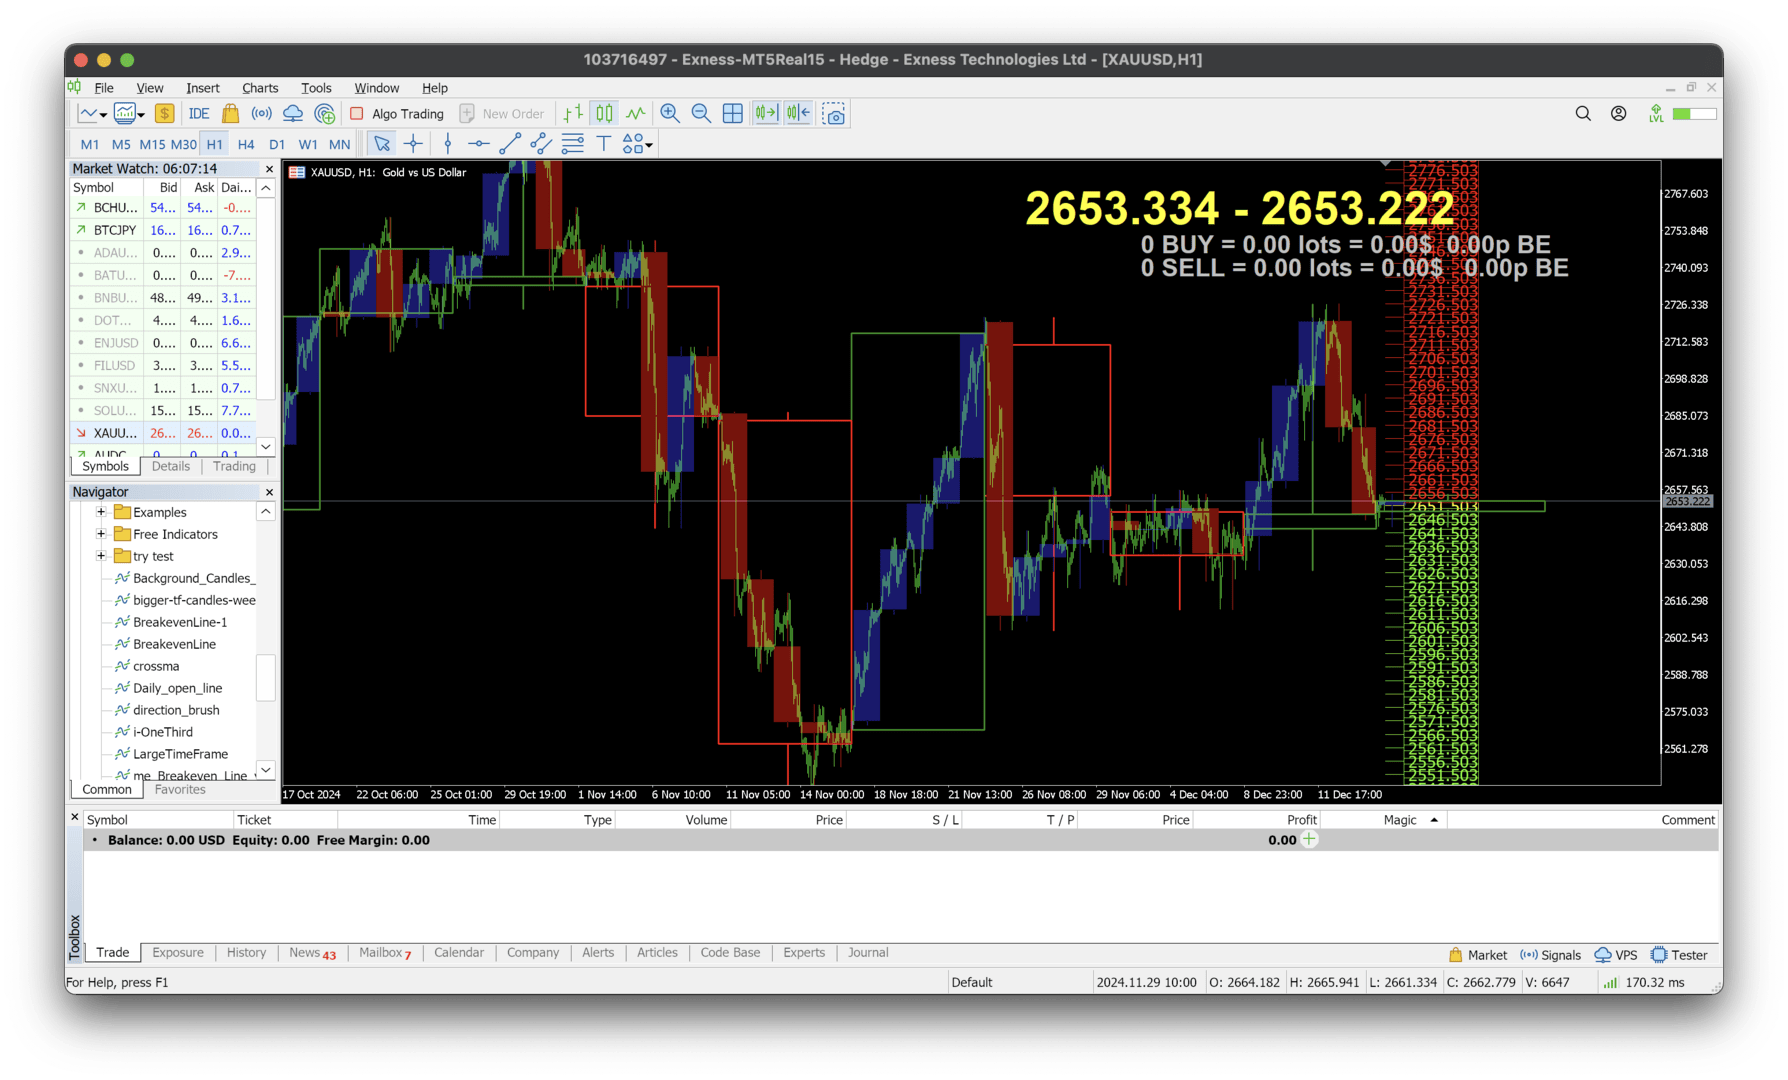
Multi TimeFrame Candle Indicator
Description:
Tired of switching between charts to analyze multiple timeframes? The Multi TimeFrame Candle Indicator solves this problem by displaying candlestick data from any higher time frame directly on your current chart. Gain a broader market context and make more informed trading decisions without the clutter.
Key Features:
-
View Any Timeframe: Easily display candles from any larger time period (e.g., see H1 candles on your M15 chart).
-
Customizable Appearance: Fully customize the color, and style of the higher timeframe candles to match your trading style.
-
Visual Clarity: Enhances trend identification, helps spot key support/resistance levels, and confirms breakout signals.
-
User-Friendly: Easy to install and configure with simple inputs.
How to Use:
-
Attach the indicator to any chart.
-
In the settings, select your desired LargeTimeFrame .
-
Adjust the colors and size to your preference.
-
Start your analysis!
Support:
Got questions or need help? Please contact me directly through the private messaging system here on MQL5. I'm glad to assist you.
Your Feedback:
If you find this indicator useful, please consider leaving a positive rating and review. It helps immensely!