G Labs MagicLines MT4

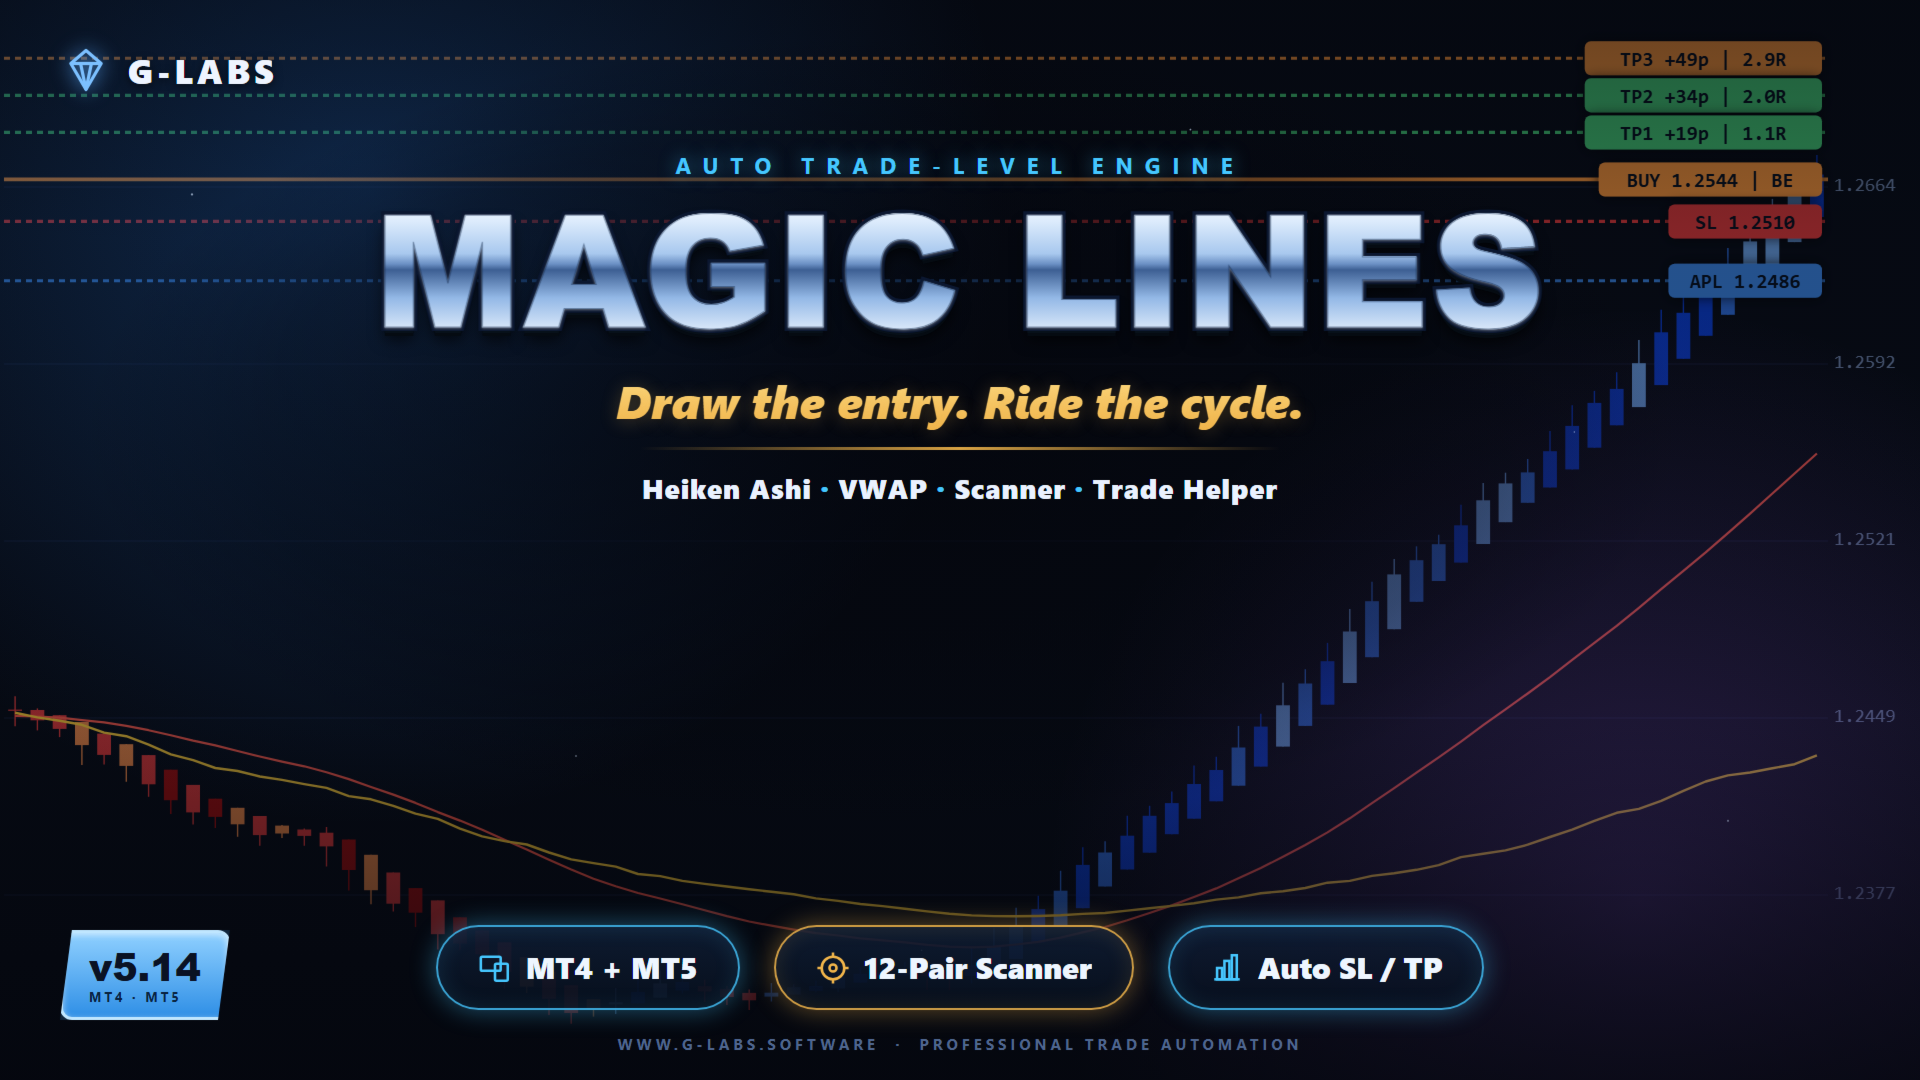
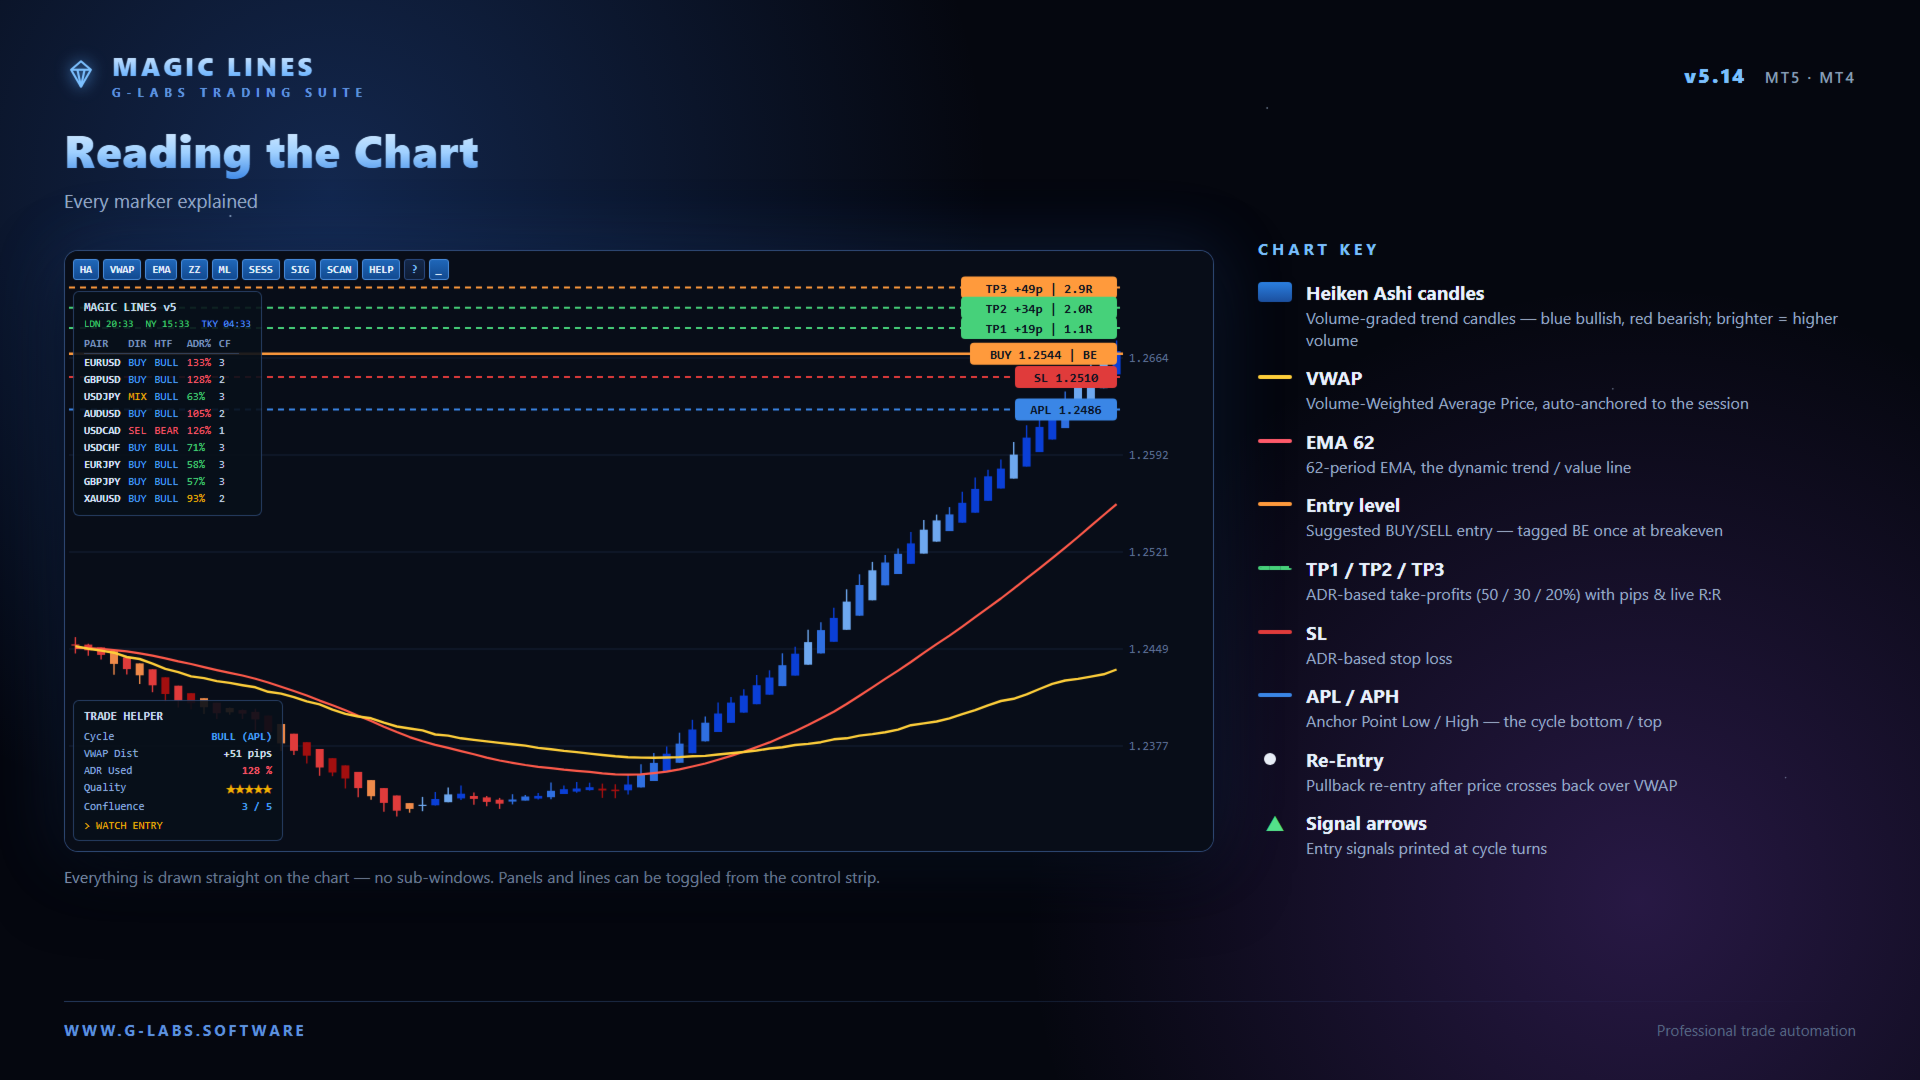
G-Labs MagicLines by G-Labs — multi-currency cycle and trend dashboard for MetaTrader 4. Heikin-Ashi cycle detection, trend-filtered MagicLine, VWAP MagicLine, multi-pair scanner, Trade Helper panel, and entry suggestions with stop loss and take profit levels from one chart.

MagicLines combines three analysis layers on each symbol. Heikin-Ashi cycle logic marks whether a pair is in an up or down cycle and records the structural anchor (swing high or low) where the cycle began. A trend-filtered MagicLine provides directional bias — signals only appear in that direction. A separate VWAP MagicLine acts as a dynamic reference for pullbacks, re-entries, and continuation trades. When all three layers align with higher-timeframe direction, the indicator can suggest entry, stop loss, and take profit levels.

What it does

Detects up and down cycles and assigns anchor points (Average Price High or Low) at the swing that started the move.

Tracks days elapsed since the anchor formed on the current timeframe, H4, and daily.

Measures distance from the anchor in average daily range multiples.

Shows whether price has touched a MagicLine and whether a re-entry opportunity is forming.

Displays today’s range in pips alongside average daily range context.

Draws entry, stop loss, re-entry, and three adjustable take profit targets (ML1, ML2, ML3) on the chart when conditions are met.

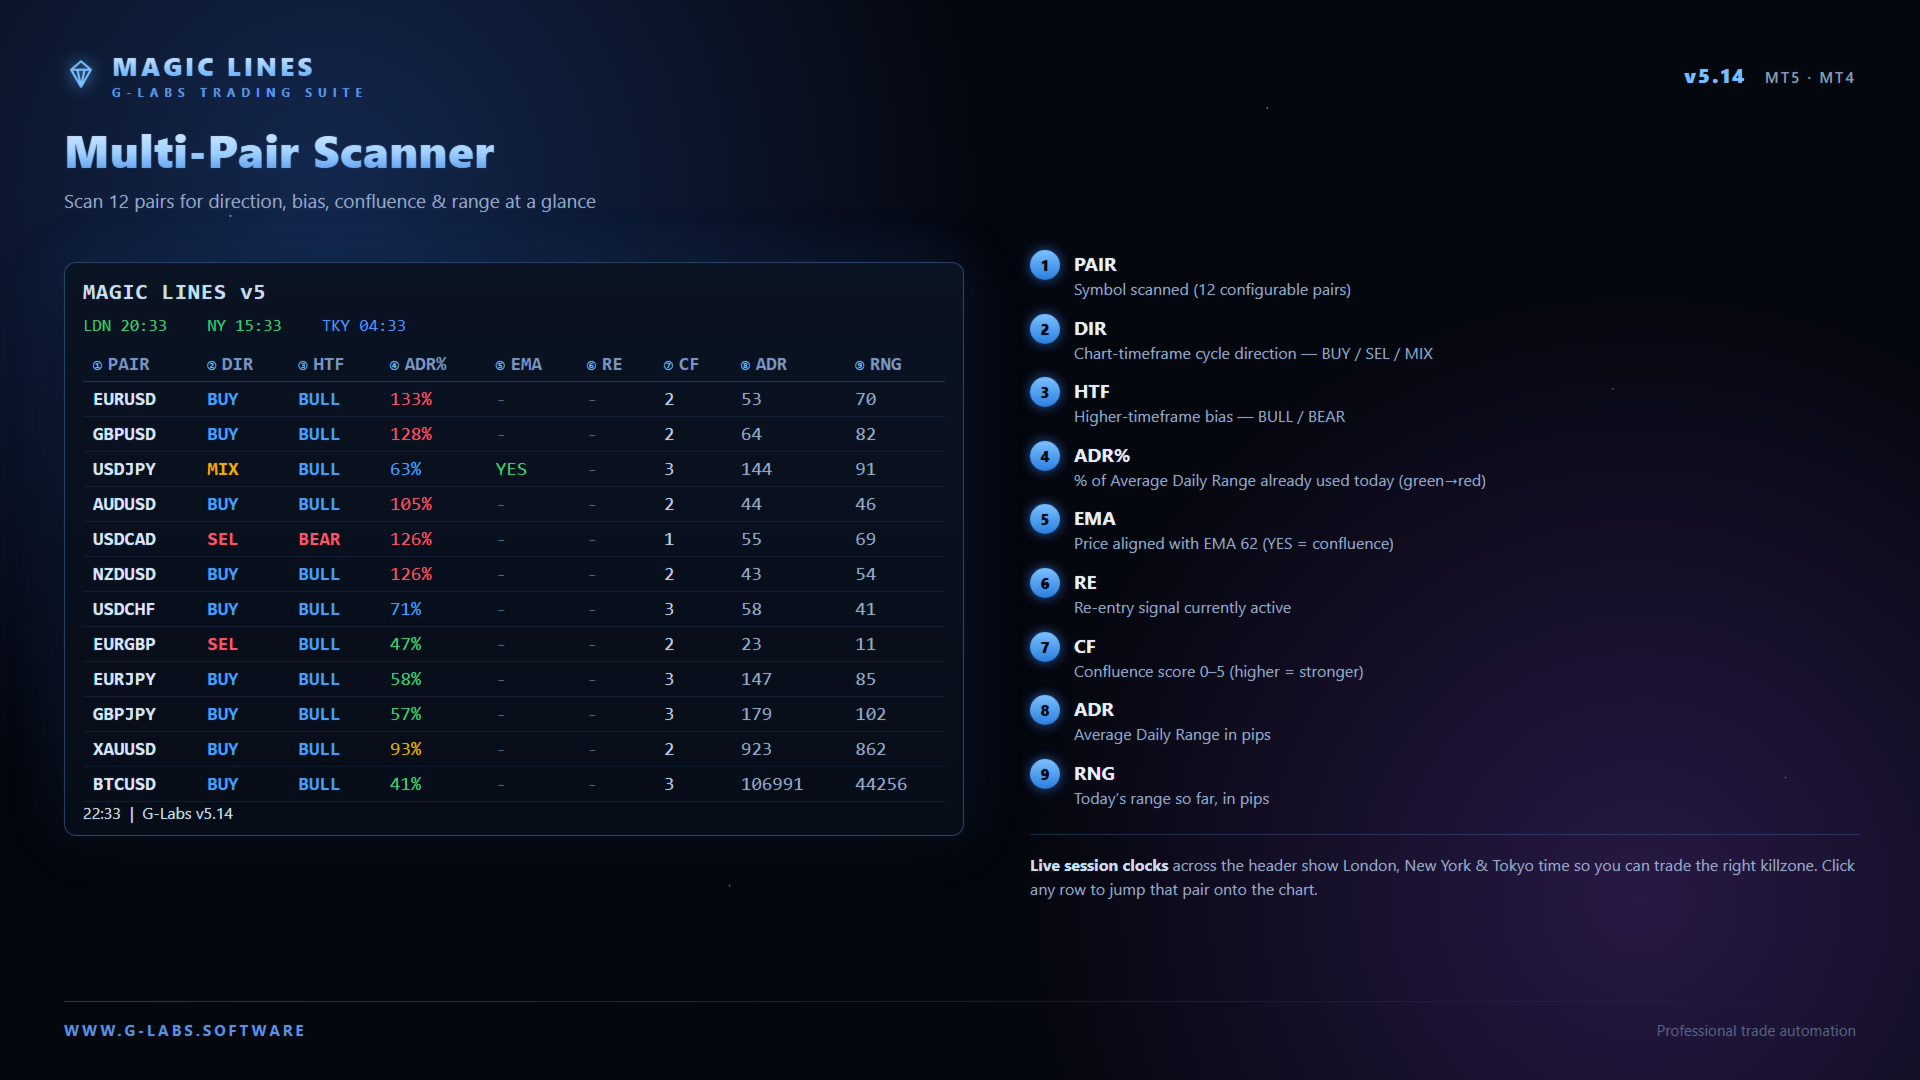
Scanner dashboard

Monitors a configurable multi-pair watchlist from one panel.

Columns include symbol, cycle direction, higher-timeframe bias, average daily range percentage, EMA touch, re-entry status, confluence score, range in pips, and today’s range.

Click a row to switch the chart to that symbol where the terminal allows.

Scanner alerts can run even when the panel is hidden.

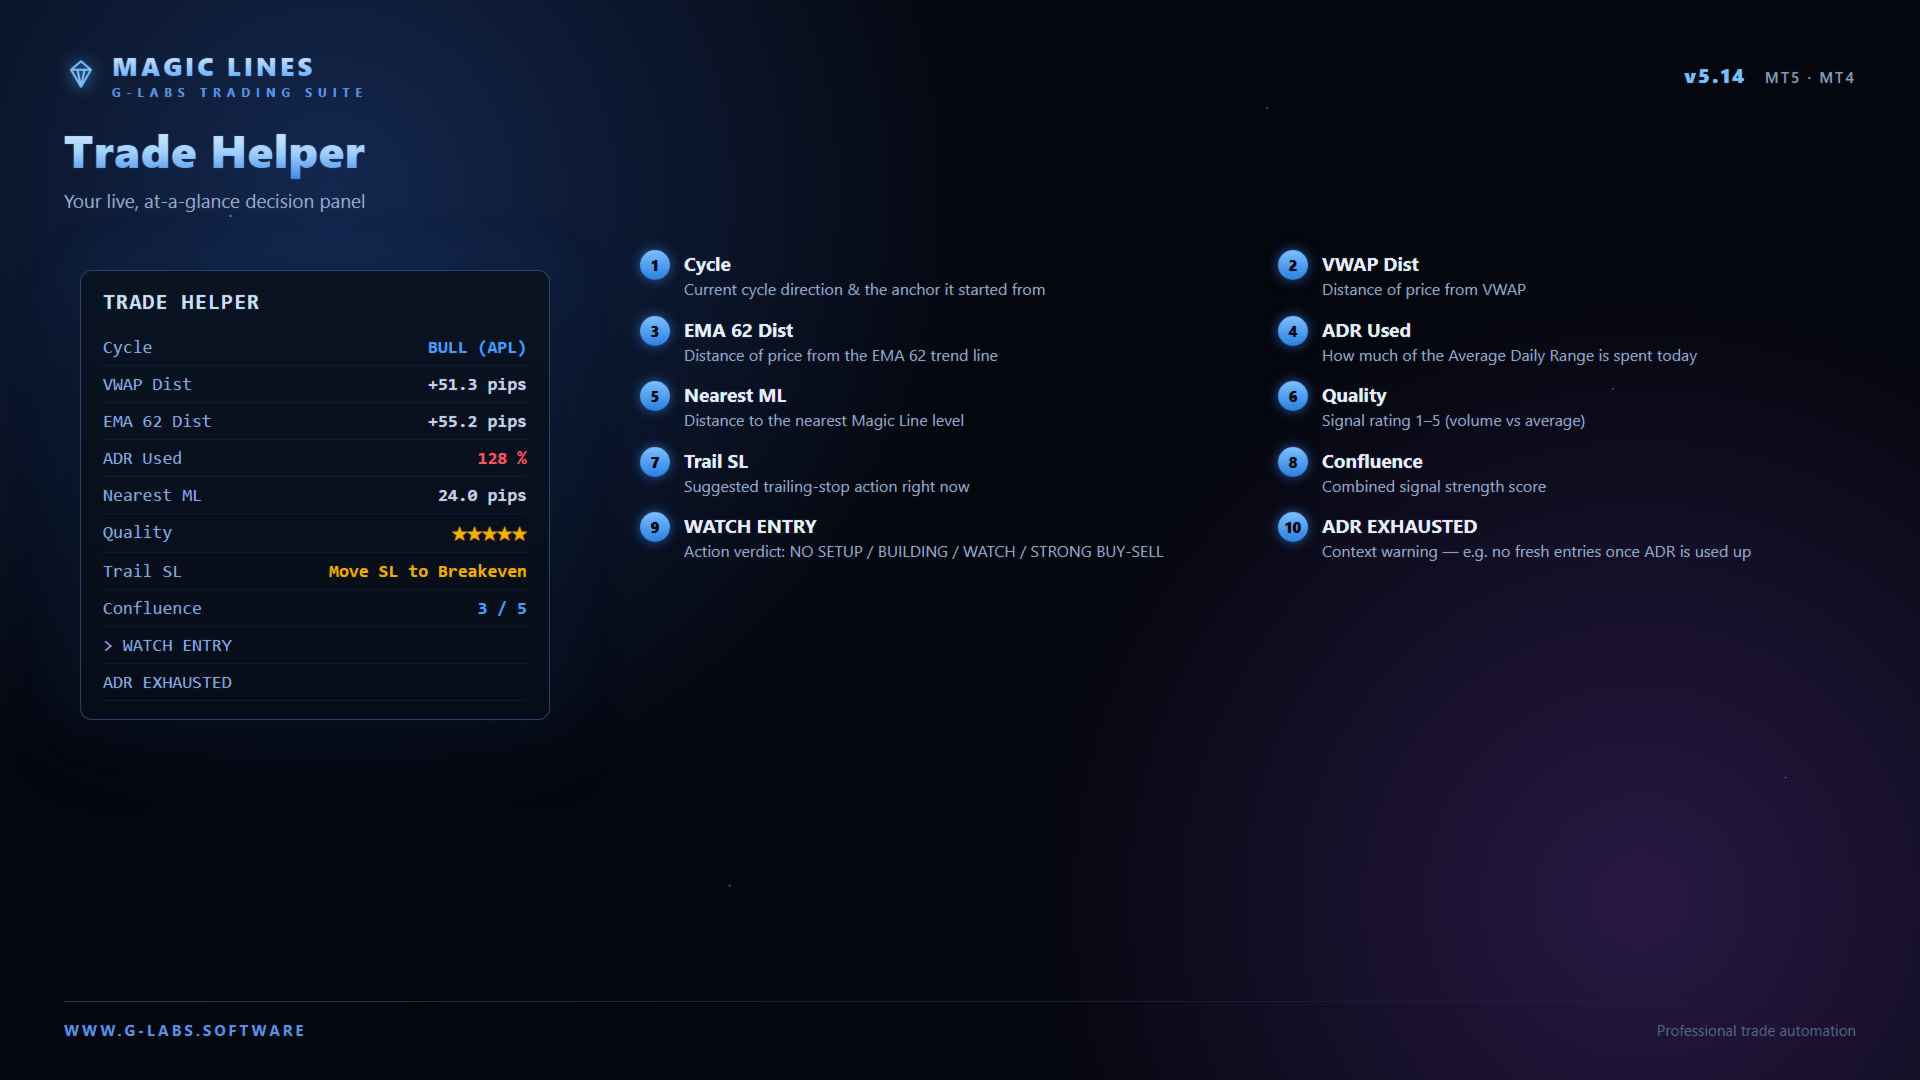
Trade Helper

Real-time panel with cycle direction, VWAP and EMA distance, average daily range usage, confluence score, signal quality, and action guidance.

Optional legend explains abbreviations and colours.

On-chart features

Heikin-Ashi volume candles for momentum direction.

VWAP with automatic session anchoring.

EMA 62 trend filter.

ZigZag swing reference markers.

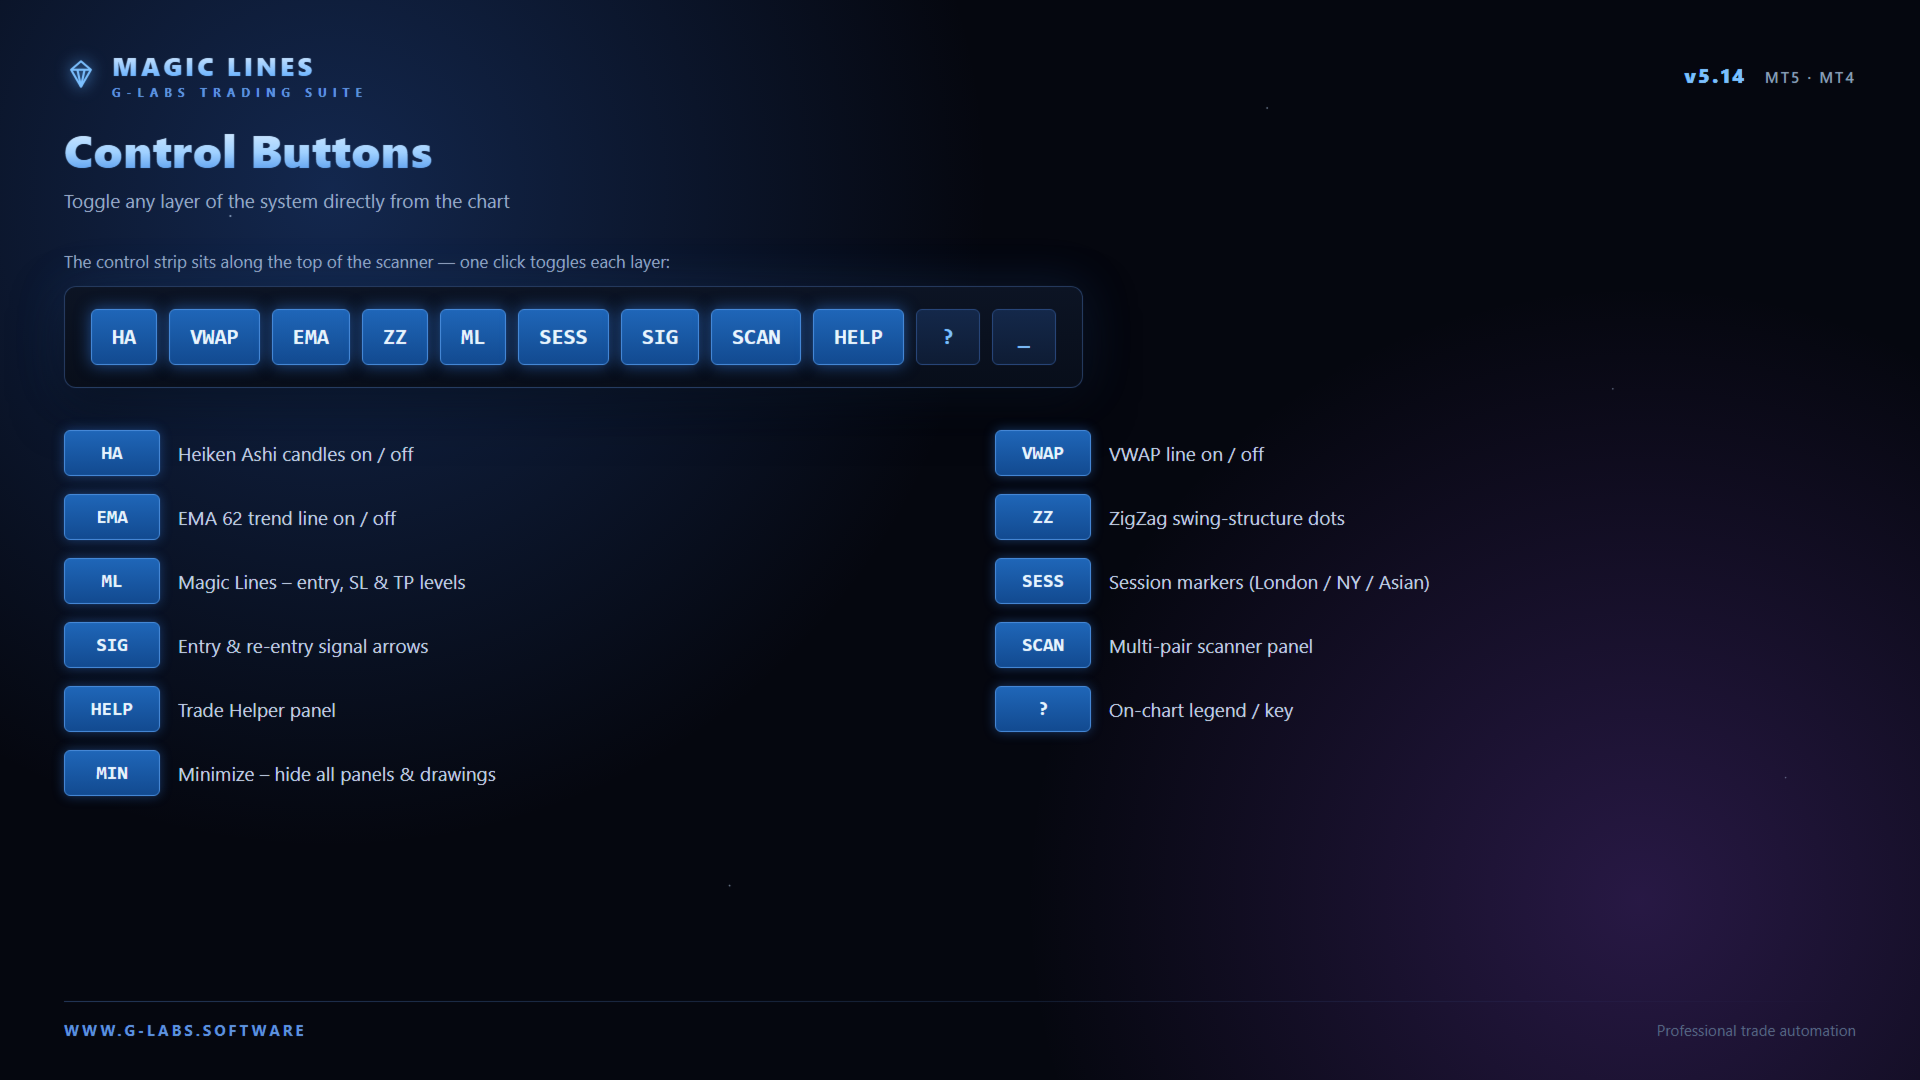
Toolbar toggles to show or hide candles, lines, signals, scanner, sessions, and helper panels.

Session markers for London, New York, and Asian sessions with configurable timezone.

Alerts

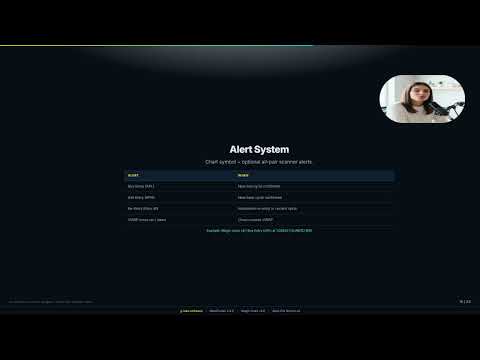
Popup and push notifications for cycle changes, entry, re-entry, VWAP cross, EMA touch, and scanner events across configured symbols.

Alert deduplication persists across chart changes and terminal restarts.

Alert types and sounds are configurable in inputs.

Quick start

Attach to any chart (M15 or H1 recommended).

Ensure scanner symbol names match your broker Market Watch list, including suffixes.

Click a dashboard row to switch pairs.

Adjust take profit targets, average daily range multipliers, and risk parameters in the indicator settings.

Requirements

MetaTrader 4 build 1350 or later.

Works on forex, metals, indices, and crypto where your broker provides data.

Analysis and signal tool only — does not place or manage trades automatically.

Past signal behaviour does not predict future results.

A MetaTrader 5 build is also available on the seller profile under G-Labs MagicLines.

G-Labs MagicLines is an analytical tool. It does not provide financial advice. Trading involves substantial risk of loss. Always use proper risk management.

Full MetaTrader 4 release with feature parity to MagicLines MT5 v5.14.


Alert deduplication persisted across chart changes, timeframe switches, and terminal restarts.


Scanner alerts remain active when the scanner panel is hidden.


Session timezone option for London, New York, and Asian markers (UK, GMT, or broker server time).


Optional hide Magic Lines after stop loss hit or after all take-profit targets are reached.


Trade Helper panel, multi-pair scanner, EA signal file output, and minimize toolbar.

Please note: MQL5 adds a demo version to all Market products by default. The demo runs on a single symbol and single timeframe on one chart. This product’s scanner reads multiple currency pairs and multiple timeframes at the same time, so the scanner and scanner-driven features are not compatible with the demo build and will not display or run. In the demo you will typically see basic chart objects only, such as EMAs and session overlays — that is expected behaviour, not a fault with the product. The full multi-pair scanner, dashboard, and all scanner logic are included in the purchased licence and are shown in the product video on the Screenshots tab. Analytical indicator only; it does not place trades for you. Past signal behaviour does not guarantee future results.

おすすめのプロダクト
Here   our more valuable tools SMC Trend Trading   ,  Easy SMC Trading  ,  Institutional SMC Architect Volume Analysis Tools  ,  Volume flow Profile  ,  Market volume profile  , FVG with Volume  , Liquidity Heatmap Profile  ,  Volume Spread Analysis The Market Profile & Volume Profile Indicator is a powerful technical analysis tool designed to visualize market activity and price distribution over specific timeframes. Unlike standard technical indicators that focus solely on price over time, th
Market Profile Heat indicator  — is a classic Market Profile implementation that can show the price density over time, outlining the most important price levels, value area, and control value of a given trading session. This indicator can be attached to timeframes between M1 and D1 and will show the Market Profile for daily, weekly, monthly, or even intraday sessions. Lower timeframes offer higher precision. Higher timeframes are recommended for better visibility. It is also possible to use a fr
Demarker pullback system - is the manual trading system for choppy markets. It show 2 colored histogram.  When histogram is blue - market is quite bullish, when histogram ir orange - market is more bearish. Up arrow is plotted when histogram is in oversold zone but blue color. Down arrow is plotted when histogram is in overbought zone but orange color. These patterns shows false breakout and possible soon reverse(price is overbought but shows bearish signs and price is oversold but shows bullis
Volume Profile Sniper v11.1は、包括的な市場分析ツールです 取引への専門的なアプローチ ボリュームプロファイルスナイパー v11.1は、市場状況の包括的な評価に基づいて明確な信号を提供し、一つの指標に15以上の主要なフィルタを組み合わせ 主な特長 ボリューム不均衡分析-アルゴリズムは、各キャンドルの買い手と売り手のシェアを計算し、当事者の1つの優位性を通知します(50%から90%までの設定可能なしきい値)。 マルチレベル信号フィルタリング-インジケータは考慮されます: トレンド指標(9/21) 買われ過ぎ/売られ過ぎゾーンを除くRSI キャンドルパターン(ピンバー、吸収、ハンマー) サポート/抵抗レベル(自動検出) 主要なプレーヤーの活動を識別するためのボリュームスパイク クラシックと増幅されたRSIの相違 ボラティリティ評価のためのATR 傾向の強さを決定するためのADX 価格アクション(内部バーと外部バー) 複数の時間枠の確認 市場構造(高値/安値) セッションフィルタ(アジア、ロンドン、ニューヨークセッション) ニュースの
The "MR Volume Profile 4" indicator is a charting tool that displays trading volume at different price levels rather than time intervals. A key concept in volume profile is the point of control (POC)—the price level with the highest volume traded during the session or time range. While tools like VWAP or OBV provide volume trends, the "MR Volume Profile 4" indicator offers granular detail about where the most market activity occurs at specific price levels. This makes it a more precise tool for


インディケータは現在のクオートを作成し、これを過去のものと比較して、これに基づいて価格変動予測を行います。インジケータには、目的の日付にすばやく移動するためのテキスト フィールドがあります。 オプション: シンボル - インジケーターが表示するシンボルの選択; SymbolPeriod - 指標がデータを取る期間の選択; IndicatorColor - インジケータの色; HorisontalShift - 指定されたバー数だけインディケータによって描画されたクオートのシフト; Inverse - true は引用符を逆にします。false - 元のビュー。 ChartVerticalShiftStep - チャートを垂直方向にシフトします (キーボードの上下矢印)。 次は日付を入力できるテキストフィールドの設定で、「Enter」を押すとすぐにジャンプできます。
Stop Switching Between Charts. Monitor Them All. Multi Chart Moving Average Alert  gives you a powerful dashboard to monitor Moving Average conditions across up to 20 open charts from a single window . Instead of checking every currency pair and timeframe manually, see the market status at a glance and get alerted when your selected MA conditions occur. KEY FEATURES Monitor Up to 20 Charts Track multiple symbols from one dashboard. Two Independent Timeframes Monitor two selected tim
Was: $249  Now: $99   Market Profile defines a number of day types that can help the trader to determine market behaviour. A key feature is the Value Area, representing the range of price action where 70% of trading took place. Understanding the Value Area can give traders valuable insight into market direction and establish the higher odds trade. It is an excellent addition to any system you may be using. Blahtech Limited presents their Market Profile indicator for the MetaTrader community. Ins
Was: $299  Now: $99   Supply Demand uses previous price action to identify potential imbalances between buyers and sellers. The key is to identify the better odds zones, not just the untouched ones. Blahtech Supply Demand indicator delivers functionality previously unavailable on any trading platform. This 4-in-1 indicator not only highlights the higher probability zones using a multi-criteria strength engine, but also combines it with multi-timeframe trend analysis, previously confirmed swings
A technical indicator that calculates its readings on trading volumes. In the form of a histogram, it shows the accumulation of the strength of the movement of the trading instrument. It has independent calculation systems for bullish and bearish directions. Works on any trading instruments and time frames. Can complement any trading system. The indicator does not redraw its values, the signals appear on the current candle. It is easy to use and does not load the chart, does not require addition
Volume indicator Effect Volume , in the Forex market volumes are unique (tick). This volume indicator demonstrates the level of financial and emotional involvement. When the indicator forms a new top, it indicates that buyers are stronger than sellers over a certain period of time. If the indicator decreases, this indicates that the bears are stronger. Why is it impossible to track normal volumes in Forex? The fact is that this is an over-the-counter market. Consequently, it is practically imp
VTB High Watermark Drawdown Lock EA for MT4 Advanced Equity Protection & Drawdown Management System VTB High Watermark Drawdown Lock is a professional risk management Expert Advisor designed to protect trading accounts, funded accounts, and proprietary trading challenges from excessive drawdown. Unlike traditional drawdown protection systems that calculate risk from the initial account balance, this EA uses a dynamic High Watermark (HWM) model that continuously protects both your original capita
IX Power MT4
Daniel Stein
4.82 (11)
IX Power: 指数、商品、暗号資産、外国為替市場の洞察を発見 概要 IX Power は、指数、商品、暗号資産、外国為替市場の強弱を分析するための多用途ツールです。 FX Power が全ての利用可能な通貨ペアデータを活用して外為ペアで最高の精度を提供する一方、 IX Power は基礎資産の市場データにのみ焦点を当てています。この特性により、 IX Power は非外為市場に最適であり、単純な外為分析にも信頼性の高いツールです。どのチャートでもスムーズに機能し、取引判断を向上させるための明確で実行可能な洞察を提供します。 1. IX Power がトレーダーにとって価値がある理由 複数市場での強弱分析 • IX Power は指数、商品、暗号資産、外為シンボルの強弱を計算し、それぞれの市場に合わせた洞察を提供します。 • US30、WTI、ゴールド、ビットコイン、または通貨ペアなどの資産を監視して取引機会を発見できます。 幅広い市場に適応 • 外為取引では、 FX Power が関連する全ての通貨ペアを分析することで比類のない精度を提供します。 • IX Power
TPO Profile MT4
Kyra Nickaline Watson-gordon
5 (1)
Definition : TPO is a Time Price Opportunity. Instead of using bars or candles with an Open, High, Low, and Close price, each "bar" in a Market Profile is represented by horizontal bars against the price It is called Market Profile terminology. In other words time-price-opportunity (TPO) profiles are histograms of how much time was spent at each price within the span of the profile. By using a TPO chart, you are able to analyze the amount of trading activity, based on time, for each price level
Gold Trend   - これは優れた株価テクニカル指標です。指標のアルゴリズムは、資産の値動きを分析し、ボラティリティと潜在的なエントリーゾーンを反映しています。 最高の指標シグナル: - 売りの場合 = 赤のヒストグラム + 赤のショートポインター + 同じ方向に黄色のシグナル矢印 + 赤色のトレンド方向矢印。 - 買いの場合 = 青のヒストグラム + 青のロングポインター + 同じ方向の水色のシグナル矢印 + 青色のトレンド方向矢印。 インジケータの利点 1. このインディケータは、高い精度でシグナルを発信します。 2. 確定した矢印シグナルは、トレンドが変化したときにのみ再描画されます。 3. どのブローカーのMetaTrader 4取引プラットフォームでも取引できます。 4. あらゆる資産(通貨、金属、暗号通貨、株式、指数など)を取引できます。 5. M15-H1タイムフレーム(中期取引)で取引するのがよい。 6. 各トレーダーがインディケータを自分用に簡単にカスタマイズできるよう、インディケータ設定で個々のパラメータ(TF、色など)を変更できます。 7.
このインジケーターは、離散ハートレー変換に基づいています。この変換を使用すると、財務時系列を処理するときにさまざまなアプローチを適用できます。このインジケーターの特徴は、その読み取り値がチャート上の1つのポイントではなく、インジケーター期間のすべてのポイントを参照していることです。 時系列を処理する場合、インジケーターを使用すると、時系列のさまざまな要素を選択できます。フィルタリングの最初の可能性は、このアプローチに基づいています。不要な高周波成分はすべて単に破棄されます。最初の図は、この方法の可能性を示しています。CutOffパラメーターを選択すると、元の時系列の詳細を選択できます(赤い線-主要な情報のみが残りますCutOff = 0、黄色-主要な最低周波数期間CutOff = 1 、青-最も高周波のノイズはすべて破棄されますCutOff = 4)。ただし、これが唯一の可能性ではありません。ノイズ成分は、追加のフィルタリングで抑制できます。 このインジケーターには両方のオプションが実装されています。そのパラメータは次のとおりです。 iPeriod-インジケーター期間 Shift-現
BoxChart MT4
Evgeny Shevtsov
4.4 (5)
The market is unfair if only because 10% of participants manage 90% of funds. An ordinary trader has slim changes to stand against these "vultures". This problem can be solved. You just need to be among these 10%, learn to predict their intentions and move with them. Volume is the only preemptive factor that faultlessly works on any timeframe and symbol. First, the volume appears and is accumulated, and only then the price moves. The price moves from one volume to another. Areas of volume accumu
Here   our more valuable tools SMC Trend Trading   ,  Easy SMC Trading  ,  Institutional SMC Architect Volume Analysis Tools  ,  Volume flow Profile  ,  Market volume profile  , FVG with Volume  , Liquidity Heatmap Profile  ,  Volume Spread Analysis Trend Identification: Look for the color change. When candles turn Green , look for Buy opportunities. When they turn Red , look for Sell opportunities. Entry: Enter on the break of the trend line or on the pullback to the line. Stop Loss: Use the
The Supply and Demand Zone Indicator is a powerful and easy-to-use tool designed to help traders identify critical supply and demand zones on the chart. These zones can provide valuable insight into potential market reversals, breakouts, and important price levels where buyers or sellers are likely to take control. The best   FREE Trade Manager . If you want to create your own Hedging or Grid strategies without any coding make sure to check out the   ManHedger Key Features: Automatic Zone Detect
FREE
Calculate 28 pairs buy and sell volume real-time. This Indicator is good for all trader. It will increase the accuracy and decision making of placing orders. It shows the strength and weakness of every currency. It's a great help to you. CurrencyStrength28pairs - The indicator calculates the price and the buy and sell volume of every currency pair. Show you the results on the board in real time. and averaged all currency pairs to show the strength of the current currency. Features Result on the
Introducing Trend Zones: Your Ultimate Tool for Precise Market Entry and Exit Points. Trend Zones is a revolutionary MetaTrader 4 indicator designed to provide traders with clear buy and sell zones based on trend reversals and price action. Built upon advanced algorithms and non-repainting technology, this indicator offers unparalleled accuracy in identifying optimal entry and exit points in the forex market. Key Features: 1. Non-Repainting Signals: Trend Zones delivers non-repainting signals,
Volume Profile Rectangle 概要 インタラクティブな 出来高プロファイル指標 で、選択したエリア内の各価格レベルにおける取引量の水平方向分布を表示します。自動的に移動可能な長方形を作成し、買い優勢と売り優勢の出来高分布を色付きバーで視覚化します。 機能概要: 水平出来高の表示 :各価格レベルの出来高分布を水平バーとして表示 強気/弱気分析 :強気(買い)優勢を緑、弱気(売り)優勢を赤で表示 インタラクティブな長方形 :選択範囲の長方形を動かすと自動で再計算・更新 自動生成 :起動時にデフォルトの長方形を自動作成し、すぐに使用可能 動作原理: エリア選択 :長方形(自動または手動で作成)で分析範囲(時間+価格)を指定 出来高分布 :価格範囲を複数のレベルに分割(解像度設定可能)し、選択されたローソク足の出来高を分配 スマートカラーリング :各価格レベルで買いと売りのどちらが優勢かを判定 動的表示 :チャートの移動、ズーム、スクロール時にバーが自動的に再描画 オプションフィルター :ローソク足の実体またはヒゲを基準にフィルタリング可能(垂直フィルター) 主な設定: 長
Program Overview: This program is a trading tool designed to monitor and analyze the 7 major currency pairs. It is a variant of a similar program used for tracking stock indices, but this version focuses on the seven major currency pairs. The program helps in identifying and calculating significant price movements (gaps) between the high and low prices of these currency pairs over a specified time frame. It then provides insights through comments and alerts based on the calculated gaps. Major Cu
Blahtech VWAP
Blahtech Limited
5 (3)
Was: $69    Now: $49   Blahtech VWAP - Volume Weighted Average Price (VWAP) is the ratio of price to total volume. It provides an average price over a specified time interval.  Links [  Install  |  Update  |  Documentation   ] Feature Highlights Configurable VWAP Line Sessions, intervals, anchored or continuous Previous day settlement line Standard Deviation bands Alerts at bar close or real time Automatic Broker or Tick volumes Significantly reduced CPU usage Input Parameters Expert Advisor
TITAN AI Volume Profile PRO MT4 is an advanced technical indicator designed for professional market analysis, volume profile distribution, and graphical data visualization in MetaTrader 4. Key Features: - Dynamic Volume Profile calculation based on price action and tick volume. - Automatic High Value Area (VAH), Low Value Area (VAL), and Point of Control (POC) detection. - High Volume Nodes (HVN) and Low Volume Nodes (LVN) highlighting. - Integrated Economic Calendar with news alerts. - Built-
Money Flow Profile MT5 HERE   Here   our more valuable tools SMC Trend Trading   ,  Easy SMC Trading  ,  Institutional SMC Architect Volume Analysis Tools  ,  Volume flow Profile  ,  Market volume profile  , FVG with Volume  , Liquidity Heatmap Profile  ,  Volume Spread Analysis This Master Edition is engineered for clarity and speed, featuring a unique Auto-Theme Sync system that instantly beautifies your chart layout upon loading. Key Features: True Money Flow Calculation: Goes beyond stand
MA Cross 448 Scanner Scan 64 pairs x 7 timeframes for MA crossovers — all from a single chart.  |  User Manual ------------------------------------------------------------------------ 1. Overview ------------------------------------------------------------------------ MA Cross 448 Scanner is a MetaTrader 4 indicator that monitors moving average crossovers across 64 currency pairs and 7 timeframes simultaneously, displaying all results in a single panel. Drop it onto any chart and it instantly
Knowledge of the strength and weakness of each currency is vital for every forex trader. Our   Currency Strength Meter indicator   measures the strength of eight major currencies (USD, EUR, GBP, CHF, JPY, CAD, AUD, NZD) by using the Relative Strength Index indicator, also known as RSI. The Currency Strength Meter indicator shows you, simply and quickly, when a currency is oversold, overbought, or in "normal area". This way, you can identify which currency is the strongest and the weakest. Our
Descption: The Volume Profile displays detailed informations of historical trading activities at certain price levels (Market Profile). So you can locate the areas with the best prices in the market and get an advantage about other market participants. Features: Customizable Volume Profile / Market Profile Shows the "fair" Value Area with 70% of all Volume Shows critical low volume zones Shows VPOC, VAL and VAH Points Works on all timeframes Also available for MT5 ( https://www.mql5.com/en/mark
Time Bubble ***Specialized for GBPJPY 1H time frame*** (tested for two years with success rates about 82%) Time Circle's smart algorithm detects the price circles with time . give strong signals at the right time as result of combine the price and time. our team spent months to develop this indicator specially for GBPJPY ..with high success rates about 82% win trades over two years .tested from December 2016 to November 2018. *** in last two years total signals 1012 with 829 Wins and 183 Lo
このプロダクトを購入した人は以下も購入しています
SR Liquidity は、市場の流動性が集中し、価格が最も強く反応する「隠れたゾーン」を可視化するために設計されたトレーディング指標です。こうした流動性の高いエリアは強力なサポート(支持)およびレジスタンス(抵抗)レベルとして機能し、市場が反転する可能性が最も高いポイントを明確に示してくれます。 単なる一般的なサポートラインやレジスタンスラインを描画するのではなく、「SR Liquidity」は実際の価格変動を分析し、売りと買いの圧力が集中するゾーンを特定します。これらは、市場の真の動きを牽引する「流動性のプール(溜まり場)」そのものです。それらをチャート上に直接可視化することで、価格が実際に反応する前に、その動きを予測することが可能になります。つまり、このインジケーターは価格の方向性が変わる可能性を予測するのです。生のプライスアクションを、市場の重要な水準(転換点となり得るポイント)を示す、明確で実用的なロードマップへと変換してくれます。 このインジケーターは、FX、株価指数、貴金属、仮想通貨など、あらゆる銘柄や時間足で使用可能です。 ご購入後、取引手順や無料の優れた追加インジケ
Trend SniperX MT4
Sarvarbek Abduvoxobov
5 (2)
Trend Sniper X は、トレーダーがトレンドの方向性と潜在的な反転ポイントを明確かつ正確に特定できるように設計された、MetaTrader 5 用のマルチタイムフレーム・トレンドフォロー指標です。 MT5版はこちら: https://www.mql5.com/en/market/product/181101 価格情報: 現在の価格はプロモーション価格であり、今後のアップデートや新機能の追加に伴い変更される場合があります。 Code2Profit チャンネル マルチタイムフレーム分析で市場をマスターしよう! Trend Sniper Xで勝率を最大化する方法:ルールとセッションのコツ 技術仕様 プラットフォーム MetaTrader 5 インジケータータイプ マルチタイムフレーム・トレンドインジケーター 動作タイムフレーム すべてのチャート時間足(上位足M1~MN1を独立して選択可能) 主要対象銘柄 為替(Forex)、ゴールド(XAUUSD)、その他のCFD 推奨口座 すべての口座タイプ ビジュアル表示 トレンドカラーローソク足(買い/売り/弱い/変化)+ 買い/売りシグナル
M1 Sniper
Oleg Rodin
4.97 (29)
M1 SNIPER は使いやすいトレーディングインジケーターシステムです。M1時間足向けに設計された矢印インジケーターです。M1時間足でのスキャルピングのためのスタンドアロンシステムとして、また既存のトレーディングシステムの一部としても使用できます。このトレーディングシステムはM1時間足での取引に特化して設計されていますが、他の時間足でも使用できます。元々、この手法はXAUUSDとBTCUSDの取引用に設計しましたが、他の市場においても役立つと考えています。 インジケーターのシグナルは、トレンドの方向と逆方向に取引できます。インジケーターのシグナルを利用して両方向に取引するのに役立つ特別な取引テクニックをご紹介します。この手法は、特別な動的なサポートとレジスタンスの価格帯を利用することに基づいています。 ご購入後、M1 SNIPER矢印インジケーターをすぐにダウンロードできます。さらに、M1 SNIPERツールのすべてのユーザーに、以下のスクリーンショットに表示されているApollo Dynamic SRインジケーターを無料で提供しています。この2つのインジケーターを組み合わせることで
ご紹介     Quantum Breakout PRO は 、ブレイクアウト ゾーンの取引方法を変革する画期的な MQL5 インジケーターです。 13年以上の取引経験を持つ経験豊富なトレーダーのチームによって開発された Quantum Breakout PROは 、革新的でダイナミックなブレイクアウトゾーン戦略により、あなたの取引の旅を新たな高みに押し上げるように設計されています。 クォンタム ブレイクアウト インジケーターは、5 つの利益ターゲット ゾーンを備えたブレイクアウト ゾーン上のシグナル矢印と、ブレイクアウト ボックスに基づいたストップロスの提案を提供します。 初心者トレーダーにもプロのトレーダーにも適しています。 量子EAチャネル:       ここをクリック MT5バージョン:   ここをクリック 重要!購入後、インストールマニュアルを受け取るためにプライベートメッセージを送ってください。 推奨事項: 時間枠: M15 通貨ペア: GBPJPY、EURJPY、USDJPY、NZDUSD、XAUUSD アカウントの種類: ECN、Raw、またはスプレッドが非
現在30%OFF! 初心者やエキスパートトレーダーのためのベストソリューション! このダッシュボードソフトウェアは、28の通貨ペアで動作しています。それは私達の主要な指標(高度な通貨の強さ28と高度な通貨インパルス)の2に基づいています。それは全体の外国為替市場の大きい概観を与えます。それは、すべての(9)時間枠で28の外国為替ペアのための高度な通貨の強さの値、通貨の動きの速度と信号を示しています。チャート上で1つのインディケータを使用して市場全体を観察し、トレンドやスキャルピングの機会をピンポイントで見つけることができたら、あなたのトレードがどのように改善されるか想像してみてください。 このインディケータには、強い通貨と弱い通貨の識別、潜在的な取引の識別と確認がより簡単になるような機能が搭載されています。このインディケータは、通貨の強さや弱さが増加しているか減少しているか、また、すべての時間枠でどのように機能しているかをグラフィカルに表示します。 新機能として、現在の市場環境の変化に適応するダイナミックなマーケットフィボナッチレベルが追加され、すでに当社のAdvanced
Neuro Poseidon is a new indicator by Daria Rezueva. It combines precise trading signals with adaptive TP/SL levels - creating best possible trades as a result! Message me and get  Neuro Poseidon Assistant  as a gift to automize your trading process! What makes it stand out? 1. Proven profitability on all assets and timeframes 2. Only confirmed BUY and SELL signals present on the chart 3. Adaptive TP & SL levels generated by the software for each trade 4. Easy to understand - suitable for all
通貨強さウィザードは、取引を成功させるためのオールインワン ソリューションを提供する非常に強力な指標です。このインジケーターは、複数の時間枠のすべての通貨のデータを使用して、このまたはその外国為替ペアのパワーを計算します。このデータは、使いやすい通貨インデックスと通貨パワーラインの形式で表され、特定の通貨のパワーを確認するために使用できます。 必要なのは、取引したいチャートにインジケーターを接続することだけです。インジケーターは、取引する通貨の実際の強さを示します。このインジケーターは、トレンドに合わせて取引するときに有利に利用できる売買高の圧力の極値も示します。このインジケーターには、フィボナッチに基づく可能なターゲットも表示されます。 このインジケーターは、PUSH 通知を含むあらゆるタイプのアラートを提供します。 購入後ご連絡下さい。私の取引のヒントをあなたと共有し、素晴らしいボーナスインジケーターを無料で提供します! 幸せで有益な取引をお祈りします。
All-in-One Trade Indicator (AOTI) は、14種類の通貨ペアの日次目標レベルを自動的に算出し、あらゆる取引銘柄に対応するテクニカル分析ツールを1つのウィンドウに統合します。トレンド判定のための Double Channel、Price Channel、MA Bands、Climax Bars 検出機能、フィボナッチレベル、サポート・レジスタンスのマイクロレベル、矢印による反転シグナルを搭載しています。MetaTrader 4 プラットフォームで動作します。 日次レベルは、EURUSD、EURJPY、GBPUSD、USDCHF、EURGBP、EURCAD、EURAUD、AUDJPY、GBPAUD、GBPCAD、GBPCHF、GBPJPY、AUDUSD、および USDJPY に対して算出されます。その他のすべてのモジュールは、あらゆる取引銘柄で使用できます。 購入後、無料の AOTI-EA-Assistant を受け取るには、私に直接ご連絡ください。これは補助型の Expert Advisor(EA)であり、AOTI の日次レベルに基づく Simplest L
Price & Time Market Structure Indicator A professional market structure tool that analyzes waves through both price and time — not price alone. Main Description NeoWave PRO is a professional market structure indicator for MetaTrader 4 designed for traders who want to move beyond traditional one-dimensional wave tools such as ZigZag, swing indicators, and basic high/low systems. Most wave indicators analyze only one thing: Price. But a real market wave is not only a price movement. A true wave de
このインジケーターは、反転ポイントと価格戻りゾーンを正確に表示します。     主要プレーヤー 。新たなトレンドが形成される場所を把握し、最大限の精度で意思決定を行い、すべての取引をコントロールします。 TREND LINES PRO インジケーターと組み合わせることで、その潜在能力を最大限に発揮します。 VERSION MT5 インジケーターが示す内容: 新しいトレンドの始まりに活性化する反転構造と反転レベル。 リスクと報酬の比率を最小限に抑えた利益 確定 と 損失停止の レベルの表示     RR 1:2   。 インテリジェントな削減ロジックによるストップロス。 指定されたインジケーターから 2 つのトレンド タイプの反転パターンを表示します。 指標: トレンドを追う   TREND LINES PRO   (世界的なトレンドの変化) TREND PRO   (クイックトレンド変更) シンプルで効果的   スキャナー   リアルタイムトレンド(新機能)。 マルチタイムフレームのインストゥルメント フィルタリング。 画面   利益     LOGIC AI信号の後。 当日プラス方
トレンドトレーディング は、タイミングのプルバックとブレイクアウトにより、市場で起こっているトレンドから可能な限り利益を得るように設計された指標です。確立されたトレンドの中で価格が何をしているかを分析することにより、取引の機会を見つけます。 [ インストールガイド | 更新ガイド | トラブルシューティング | よくある質問 | すべての製品 ] 自信を持って効率的に金融市場を取引する むち打ちにならずに確立されたトレンドから利益を得る 収益性の高いプルバック、ブレイクアウト、早期の逆転を認識する この指標は、独自の品質とパフォーマンスを分析します 複数時間枠のダッシュボードを実装します インジケーターは再描画されていません 電子メール/音声/視覚アラートを実装します 確立されたトレンドは多くの取引機会を提供しますが、ほとんどのトレンド指標はそれらを完全に無視しています。インジケーターの解釈はかなり簡単です: (1) トレンドの変化 (2) トレンドの方向への後退 (3) トレンドの方向へのブレイクアウト 赤いダッシュ は下降トレンド中の修正です 青いダッシュ は上昇トレンド中
現在20%OFF! 初心者やエキスパートトレーダーに最適なソリューションです。 このインディケータは、エキゾチックペア・コモディティ・インデックス・先物など、あらゆるシンボルの通貨の強さを表示することに特化したインディケータです。金、銀、原油、DAX、US30、MXN、TRY、CNHなどの通貨の強さを表示するために、9行目にどのシンボルでも追加することができます。独自の機能を多数搭載し、新しい計算式を採用したため、ユニークで高品質、かつ手頃な価格のトレーディングツールとなっています。新しいトレンドやスキャルピングチャンスのトリガーポイントを正確に把握することができるため、あなたのトレードがどのように改善されるか想像してみてください。 ユーザーマニュアル:ここをクリック   https://www.mql5.com/en/blogs/post/708876 すべての時間枠に対応します。あなたはすぐにトレンドを見ることができるようになります! 新しいアルゴリズムに基づいて設計されているため、潜在的な取引の特定と確認がより簡単になります。これは、8つの主要通貨と1つのシンボルの強弱
KURAMA GOLD SIGNAL PRO MT4版 ゴールドのサインに、目で見えるトレード計画を。 ゴールドのサインが出た。利確はどこか。損切りはどこか。エントリー前に何を確認すべきか。 KURAMA GOLD SIGNAL PROは、その判断材料をチャートに集約します。XAUUSDのM5、M15向けに、売買サイン、自動計算TP/SL、3段階のサイン評価、注意すべき相場条件を知らせるMARKETパネルを搭載。 セットアップ、決済目安、相場の注意点を一か所で確認。情報を集める手間を減らし、トレードの判断に集中できます。 買い切り購入者限定特典 AI Zone Radar MT5版と完全PDFマニュアルを無料プレゼント。 ご購入後にMQL5でメッセージをお送りください。買い切り購入が対象です。レンタルは対象外です。 AI Zone Radarを見る サインから、具体的なトレード計画へ SMA 13、21、75、100へのタッチを使ったセットアップを検出。各サインに売買方向と対象MAを表示するため、浅い押し目、戻りと深い調整を区別して確認できます。 チャートとパネルには、次の情報を表示し
Dynamic Forex28 Navigator - 次世代の Forex 取引ツール。 現在 49% オフ。 Dynamic Forex28 Navigator は、長年人気のインジケーターを進化させたもので、3 つの機能を 1 つにまとめています。 Advanced Currency Strength28 インジケーター (レビュー 695 件)  + Advanced Currency IMPULSE with ALERT (レビュー 520 件) + CS28 コンボ シグナル (ボーナス)。 インジケーターの詳細 https://www.mql5.com/en/blogs/post/758844 次世代の Strength インジケーターが提供するもの  オリジナルで気に入っていたすべての機能が、新機能と精度の向上によって強化されました。 主な機能: 独自の通貨強度計算式。 すべての時間枠でスムーズかつ正確な強度ライン。 トレンドの特定と正確なエントリーに最適です。 ダイナミックマーケットフィボナッチレベル (マーケットフィボナッチ)。 このインジケーターに固有
Binary Options Support Resistance Indicator This indicator is designed for binary options trading and effectively shows retracements from support and resistance levels. Signals appear on the current candle. A red arrow pointing downwards indicates a potential selling opportunity, while a blue arrow pointing upwards suggests buying opportunities. All that needs adjustment is the color of the signal arrows. It is recommended to use it on the M1-M5 timeframes as signals are frequent on these timef
Scalper Inside PRO は日中トレンドの分析を助け、エントリー前にトレードを組み立てられるインジケーターです。中核となるのは、相場をより正確に読むための3つの専用ストラテジー。シグナルが出た瞬間に方向を自動で判断し、主要な価格帯を計算するので、想定エントリーポイント、予想ストップロス、複数の利確レベルを前もって確認できます。詳細なパフォーマンス統計が、各銘柄とストラテジーが過去にどう機能したかを示し、今の相場に合った資産選びを助けます。単体のスキャルピングツールとしても、あなたのシステムの一部としても、自作 EA のベースとしても使えます。MetaTrader 4 プラットフォームで動作します。 インジケーターはエントリー、3つの利確レベル - TP1、TP2、TP3、そして任意のストップロスをチャート上に直接表示します。自作の矢印インジケーターを接続し、その統計と収益性を検証することも可能です。 ご購入後は直接ご連絡ください。専用のボーナス add-ons、実トレードでの活用に関する追加情報、そしてご自身のトレードシステムや EA への正しい接続のサポートをお渡しします
Beast Super Signal
Florian Zuercher
4.73 (89)
収益性の高い取引機会を簡単に特定するのに役立つ強力な外国為替取引インジケーターをお探しですか?ビースト スーパー シグナル以外に探す必要はありません。 この使いやすいトレンドベースのインジケーターは、市場の状況を継続的に監視し、新しいトレンドを検索したり、既存のトレンドに飛びついたりします。ビースト スーパー シグナルは、すべての内部戦略が一致し、互いに 100% 合流したときに売買シグナルを発するため、追加の確認は不要です。シグナル矢印アラートを受け取ったら、単に売買します。 購入後、プライベート VIP グループに追加されるようにメッセージを送ってください! (完全な製品購入のみ)。 購入後、最新の最適化されたセット ファイルについてメッセージを送ってください。 MT5バージョンは こちらから入手できます。 Beast Super Signal EA は こちらから 入手できます。 コメント セクションをチェックして、最新の結果を確認してください。 ビースト スーパー シグナルは、1:1、1:2、または 1:3 のリスクと報酬の比率に基づいて、エントリー価格、ストッ
OrderFlow Absorption – MT4用プロフェッショナル・デルタ&アブソープションシグナルインジケーター OrderFlow Absorptionで本物のオーダーフロー分析の力を解き放ちましょう。MetaTrader 4向けの究極のデルタヒストグラム&アブソープションシグナルインジケーターです。あらゆる価格変動の裏側で何が起きているのかを知りたいトレーダーのために設計されており、市場を動かす隠れた買い/売り圧力や吸収イベントを明らかにします。 特徴 デルタヒストグラムの可視化:   買い圧力・売り圧力を色分けされたヒストグラムで即座に表示。 アブソープションシグナル検出:   高度なロジックで強気・弱気の吸収イベントを特定し、反転の兆しを早期に通知。 チャートマーカー:   吸収シグナルをチャート上に直接マークし、視覚的に分かりやすく表示。 ポップアップアラート:   新しい吸収シグナルが出現した際にリアルタイムで通知。 カスタマイズ可能な閾値:   弱いシグナルを除外し、高確率のセットアップに集中。 リソース管理:   大きなチャートでも高速に動作する効率的な計算。
Cycle Sniper
Elmira Memish
4.39 (36)
Please contact us after your purchase and we will send you the complimentary indicators to complete the system Cycle Sniper is not a holy grail but when you use it in a system which is explained in the videos, you will feel the difference. If you are not willing to focus on the charts designed with Cycle Sniper and other free tools we provide, we recommend not buying this indicator. We recommend watching the videos about the indiactor and system before purchasing. Videos, settings  and descri
Super Signal – Skyblade Edition プロ仕様のノンリペイント / ノーラグ・トレンドシグナルシステム。卓越した勝率を実現 | MT4 / MT5 対応 1分足、5分足、15分足などの低い時間足で最も効果を発揮します。 主な特徴: Super Signal – Skyblade Edition は、トレンド取引に特化したスマートなシグナルシステムです。マルチレイヤーのフィルターロジックを用いて、明確な方向性と実際のモメンタムに支えられた強力なトレンドのみを検出します。 このシステムは 天井や底を予測するものではありません 。次の3つの条件がすべて満たされた場合にのみシグナルを発生させます: 明確なトレンド方向 モメンタムの増加 健全なボラティリティ構造 市場セッションに基づく流動性分析と組み合わせることで、シグナルの精度とタイミングがさらに向上します。 シグナルの特性: すべての矢印シグナルは 100% 非リペイント / 遅延なし 一度出現したシグナルは固定され、点滅・消失しません チャート上の矢印、情報パネル、ポップアップ通知、音声アラート、プッシュ通知
BTMM State Engine Pro by G-Labs — Beat The Market Maker indicator for MetaTrader 4. Asian session range, London and New York kill zones, level progression (L1/L2/L3), peak formation detection (PFH/PFL), entry signals, and a multi-pair scanner from one chart. Stop scanning charts one pair at a time. The State Engine tracks the BTMM daily cycle automatically — Asian box, room boundaries, level blocks, peak formations, and filtered entries — while the scanner dashboard shows level, peak status,
I have been trading for some time now and always find it a difficulty remembering the timing of the various market opening hours at the other part of the world (especially, when it comes to daylight saving), but could not find any decent indicator online that could help. And it is for this reason that gives birth to this indicator, which I have spent much time, effort and thinking. As many already know that opening of a certain marketplace, depending on which currency pair, has an impact on the
発見が困難で頻度が少ないため、分岐は最も信頼できる取引シナリオの1つです。このインジケーターは、お気に入りのオシレーターを使用して、通常の隠れた分岐点を自動的に見つけてスキャンします。 [ インストールガイド | 更新ガイド | トラブルシューティング | よくある質問 | すべての製品 ] 取引が簡単 通常の隠れた発散を見つけます 多くのよく知られている発振器をサポート ブレイクアウトに基づいて取引シグナルを実装します 適切なストップロスおよび利益レベルを表示します 設定可能なオシレーターパラメーター カスタマイズ可能な色とサイズ バー単位でサイズ別に分岐をフィルタリング パフォーマンス統計を実装します 電子メール/音声/視覚アラートを実装します 幅広い市場の見通しを提供するために、異なるオシレーターを使用して、干渉なしで同じチャートにインジケーターを何度もロードできます。このインジケーターは、次のオシレーターをサポートしています。 RSI CCI MACD オスマ 確率的 勢い 素晴らしい発振器 加速器発振器 ウィリアムズパーセントレンジ 相対活力指数 特に外国為替市場では、
Presenting one-of-a-kind Gann Indicator for XAUUSD IQ Gold Gann Levels is a non-repainting, precision tool designed exclusively for XAUUSD intraday trading. It uses W.D. Gann’s square root method to plot real-time support and resistance levels, helping traders spot high-probability entries with confidence and clarity. William Delbert Gann (W.D. Gann) was an exceptional market analyst whose trading technique was based on a complex blend of mathematics, geometry, astrology, and ancient calculation
The elite (V3) multi-indicator suite from JoaquinTrading specifically geared towards Forex & binary options, including regulated exchanges such Nadex, Cantor Exchange, and other binary option brokers. The Probability Tool Suite Elite will provide the given win/loss outcome probabilities of up to 10 strike levels, a specific expiration duration, based on a combination of up to 16 indicators, rules, or conditions and derivative behavior (i.e. expiry, touch, touch & retrace).  Using this indicato
Miraculous Indicator – ガン・スクエア・オブ・ナインに基づく100%非リペイントのFXおよびバイナリーツール この動画では、FXおよびバイナリーオプションのトレーダー向けに特別に開発された、非常に正確で強力な取引ツールである Miraculous Indicator を紹介しています。このインジケーターがユニークなのは、伝説的な ガン・スクエア・オブ・ナイン と ガンの振動の法則 に基づいている点で、現代の取引で利用できる最も正確な予測ツールの一つとなっています。 Miraculous Indicatorは 完全に非リペイント であり、ローソク足が確定した後にシグナルが変化したり消えたりすることはありません。つまり、見たものがそのまま利用できます。これにより、トレーダーは自信を持ってエントリーおよびエグジットを行うための信頼性と一貫性のある根拠を得ることができます。 主な特徴: ガン・スクエア・オブ・ナインとガン理論に基づいて構築 100%非リペイントのシグナルシステム すべての時間枠(M1、M5、H1、H4、日足、週足)で機能 FXおよびバイナリーオプション取引
FullScalping は、あらゆる市場で 継続的なスキャルピングエントリー を生成するように特別に設計された 再描画なし、後方描画なし のインジケーターです。絶え間ないアクションを求める積極的なトレーダーに最適です! 独占情報とアップデートを入手するには、チャンネルに参加してください: https://www.mql5.com/en/channels/forexnewadvisor ほぼすべてのローソク足 でシグナルを出し、トレンドを確認するか、重要なリトレースメントをシグナルします。常にあなたを導くレーダーのようなものです。 どのように機能しますか?非常にシンプルです: 赤い矢印 売り 取引に入る。 青い矢印 買い 取引に入る。 常に一般的なトレンドの方向に取引し、 取引ごとに15〜20ピップ を積極的にターゲットにし、急激な市場の反転の前に素早く退出します。 シグナルは 継続的 なので、取引機会が尽きることはありません。目標は以下を使用して 集中的なスキャルピング を実行することです: 高ロット 低スプレッド(左下隅に表示) 最後のトレンド変化の近くに配置された
このインジケーターは実践的なトレードに最適な自動波動分析のインジケーターです! 場合... 注:   Tang Lun (Tang Zhong Shuo Zen) の命名規則の影響で、私は波のグレーディングに西洋の名前を使用することに慣れていません。基本的な波を ペン 、二次波のバンドを セグメント と名付けました。同時に、 セグメント にはトレンドの方向が指定されます (この命名方法は将来のノートで使用されます。最初に言っておきます)。ただし、アルゴリズムは曲がりくねった理論とはほとんど関係がないため、付けるべきではありません。これは、私の市場分析 によって要約された、絶えず変化する複雑な運用ルール を反映しています。 バンドは標準化され、人によって異なることがないよう定義されており、市場参入を厳密に分析する上で重要な役割を果たす人為的な干渉の描画方法が排除されています。 このインジケーターを使用することは、取引インターフェイスの美しさを改善することと同等であり、元の K ライン取引を放棄し、取引の新しいレベルに連れて行きます。また、宣伝の観点から顧客の認識も向上します。 イ
ORB Seeker
Marcela Goncalves De Oliveira
4 (1)
期間限定の割引価格! たったの 149 ドル! ご購入後、ボーナスとしてORB Seeker EAと個人最適化セットファイルをお受け取りいただくため、私にご連絡ください。 クリーンなセッションブレイクアウトを自信を持ってキャッチしましょう! ORB Seekerは、正確性、シンプルさ、柔軟性、そして明確なチャート構造を求めるトレーダー向けに開発された、プロ仕様のオープニングレンジブレイクアウト(ORB)インジケーターです。 このシステムは、あらゆる銘柄のプレマーケットまたはカスタムセッションのレンジを自動的にプロットし、エントリー、ストップロス、テイクプロフィット、およびオプションの50%部分TPレベルを含む明確なブレイクアウトシグナルを提供します。すべての計算結果はリアルタイムでチャート上に表示されます。 ロンドン市場オープン、ニューヨーク市場セッション、アジア市場セッション、または独自のカスタム市場時間帯で取引できます。ORB Seekerは選択したセッション時間帯に合わせて調整されるため、市場レンジ、ブレイクアウトレベル、トレードレベルの位置を正確に把握できます。 ご購入いた
Hidden - Delta - Flow is a professional trading system designed to detect hidden changes in market structure through comprehensive analysis of Hidden Divergence and Delta CVD Divergence, enhanced by normalized volume, an adaptive TP/SL model, and verifiable performance statistics. Instead of simply displaying price direction, the system analyzes the relationship between price movement and internal volume activity, allowing it to identify situations where the external price structure begins t
作者のその他のプロダクト
BTMM State Engine Pro by G-Labs — Beat The Market Maker indicator for MetaTrader 5. Asian session range, London and New York kill zones, level progression (L1/L2/L3), peak formation detection (PFH/PFL), entry signals, and a multi-pair scanner from one chart. Stop scanning charts one pair at a time. The State Engine tracks the BTMM daily cycle automatically — Asian box, room boundaries, level blocks, peak formations, and filtered entries — while the scanner dashboard shows level, peak status, d
Smart Market Structure Pro by G-Labs — ICT and Smart Money Concepts toolkit with built-in multi-symbol scanner for MetaTrader 5. Break of structure, change of character, order blocks, fair value gaps, liquidity sweeps, premium and discount zones, ICT sessions, confluence scoring, AI trade ideas, and a traffic-light scanner across up to 30 pairs and four timeframes from one chart. Map SMC and ICT on the active chart while the built-in scanner monitors your full watchlist. Each cell shows BUY, S
BTMM State Engine Pro by G-Labs — Beat The Market Maker indicator for MetaTrader 4. Asian session range, London and New York kill zones, level progression (L1/L2/L3), peak formation detection (PFH/PFL), entry signals, and a multi-pair scanner from one chart. Stop scanning charts one pair at a time. The State Engine tracks the BTMM daily cycle automatically — Asian box, room boundaries, level blocks, peak formations, and filtered entries — while the scanner dashboard shows level, peak status,
Smart Market Structure Pro by G-Labs — ICT and Smart Money Concepts toolkit with built-in multi-symbol scanner for MetaTrader 5. Break of structure, change of character, order blocks, fair value gaps, liquidity sweeps, premium and discount zones, ICT sessions, confluence scoring, AI trade ideas, and a traffic-light scanner across up to 30 pairs and four timeframes from one chart. Map SMC and ICT on the active chart while the built-in scanner monitors your full watchlist. Each cell shows BUY, SE
Connix MT5
Garry James Goodchild
5 (1)
Connix SMC Scanner by G-Labs — ICT and Smart Money Concepts multi-pair dashboard for MetaTrader 5. Order blocks, fair value gaps, break of structure, change of character, VWAP, premium and discount range, and multi-timeframe scanner from one chart. Connix scans multiple symbols across configurable timeframes and shows market structure status in an interactive table while drawing the same structures on the active chart. It is an analytical toolkit — you control every setting; it does not place
Advanced Market Maker Dashboard by G-Labs — Beat The Market Maker multi-pair scanner for MetaTrader 5. Seventeen-column ADR dashboard with price formation, breaker blocks, TDI SharkFin, RSI divergence, stop hunt, daily candle confirmation, currency strength, and chart overlays from one panel. The full BTMM workflow dashboard for traders who have outgrown a basic scanner. Monitor 28 or more pairs in real time: trend direction, peak formation side (PFH/PFL), ADR expansion in MAX and real-time co
Advanced Market Maker Dashboard by G-Labs — Beat The Market Maker multi-pair scanner for MetaTrader 4. Seventeen-column ADR dashboard with price formation, breaker blocks, TDI SharkFin, RSI divergence, stop hunt, daily candle confirmation, currency strength, and chart overlays from one panel. The full BTMM workflow dashboard for traders who have outgrown a basic scanner. Monitor 28 or more pairs in real time: trend direction, peak formation side (PFH/PFL), ADR expansion in MAX and real-time col
G-Labs Trade Manager by G-Labs — on-chart trade panel for MetaTrader 5. Risk-based lot sizing, visual entry stop and take profit lines, position management, news filter, currency strength, statistics, and OCO breakout tools. One panel for planning, executing, and managing manual trades. Set risk before you click buy or sell, drag stop loss and take profit on the chart, manage open positions and pending orders, and track performance — you stay in control of every decision. Trading utility, not a
G-Labs IC Breaker by G-Labs — ICT source and breaker order blocks for MetaTrader 4. Multi-timeframe structural zones, breaker invalidation on close, retest alerts, and per-timeframe colour control on one chart. Marks where opposing liquidity rested before a move and what happens when structure breaks. Source order blocks draw as outlined rectangles from the first opposite-colour candle after a structural break. When price closes through the tracked extreme, the zone flips to a filled breaker bl
Connix Multi-Timeframe SMC Dashboard by G-Labs — ICT and Smart Money Concepts scanner for MetaTrader 4. Order blocks, fair value gaps, BOS, CHoCH, VWAP, and premium-discount range across 29+ pairs from one chart. Monitor market structure on your full watchlist without flipping charts — the Connix dashboard shows OB, FVG, structure breaks, VWAP status, and range position per symbol and timeframe while drawing the same zones on the active chart. Connix scans multiple symbols across configurable
G-Labs Market Maker Dashboard — Beat The Market Maker multi-pair scanner for MetaTrader 4. Peak Formation context (PFH/PFL), ADR cycle expansion, Asian session range, stop-hunt proximity, daily range versus ADR, and M15 RSI from one panel. Monitor your full watchlist without opening a chart for every pair. The dashboard scans symbols in real time and shows where each one sits in a BTMM-style daily workflow: peak formation side, movement in average daily range multiples, Asian range behaviour, s
G-Labs Trade Manager by G-Labs — on-chart trade panel for MetaTrader 4. Risk-based lot sizing, visual entry stop and take profit lines, position management, currency strength, statistics, and OCO breakout tools. One panel for planning, executing, and managing manual trades. Set risk before you click buy or sell, drag stop loss and take profit on the chart, manage open positions and pending orders, and track performance — you stay in control of every decision. Trading utility, not a black-box si
G-Labs Market Maker Dashboard — Beat The Market Maker multi-pair scanner for MetaTrader 5. Peak Formation context (PFH/PFL), ADR cycle expansion, Asian session range, stop-hunt proximity, daily range versus ADR, and M15 RSI from one panel. Monitor your full watchlist without opening a chart for every pair. The dashboard scans symbols in real time and shows where each one sits in a BTMM-style daily workflow: peak formation side, movement in average daily range multiples, Asian range behaviour, s
G-Labs MagicLines — multi-currency cycle and trend dashboard for MetaTrader 5. Heikin-Ashi cycle detection, trend-filtered MagicLine, VWAP MagicLine, multi-pair scanner, Trade Helper panel, and entry suggestions with stop loss and take profit levels from one chart. MagicLines combines three analysis layers on each symbol. Heikin-Ashi cycle logic marks whether a pair is in an up or down cycle and records the structural anchor (swing high or low) where the cycle began. A trend-filtered MagicLine
G-Labs IC Breaker by G-Labs — ICT source and breaker order blocks for MetaTrader 5. Multi-timeframe structural zones, breaker invalidation on close, retest alerts, and per-timeframe colour control on one chart. Marks where opposing liquidity rested before a move and what happens when structure breaks. Source order blocks draw as outlined rectangles from the first opposite-colour candle after a structural break. When price closes through the tracked extreme, the zone flips to a filled breaker bl
フィルタ:
レビューなし
レビューに返信