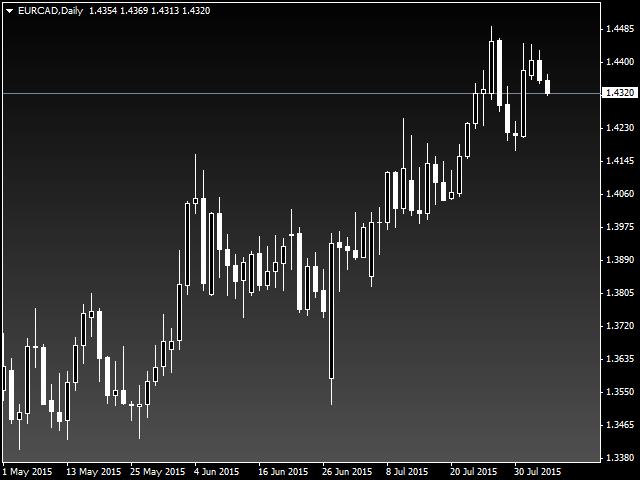
Original background

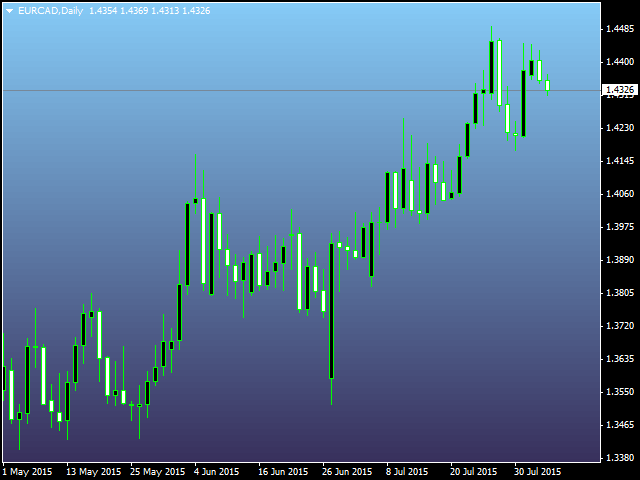
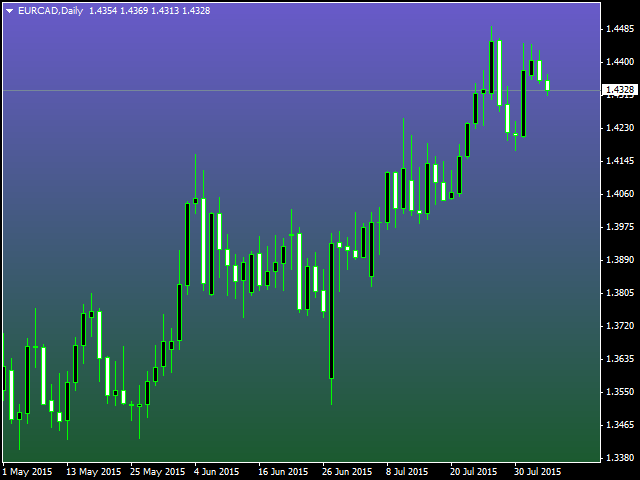
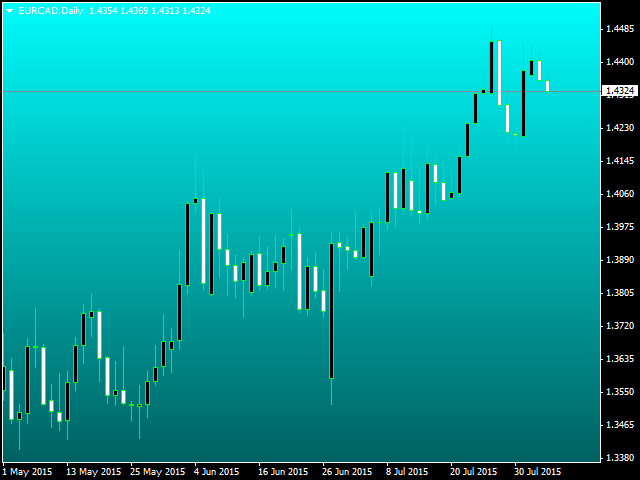
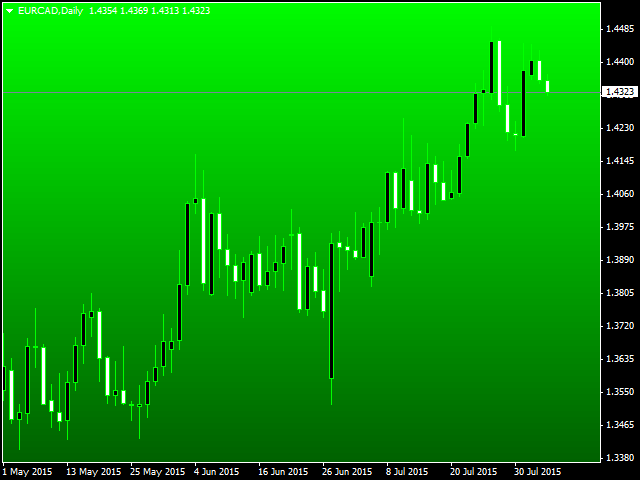
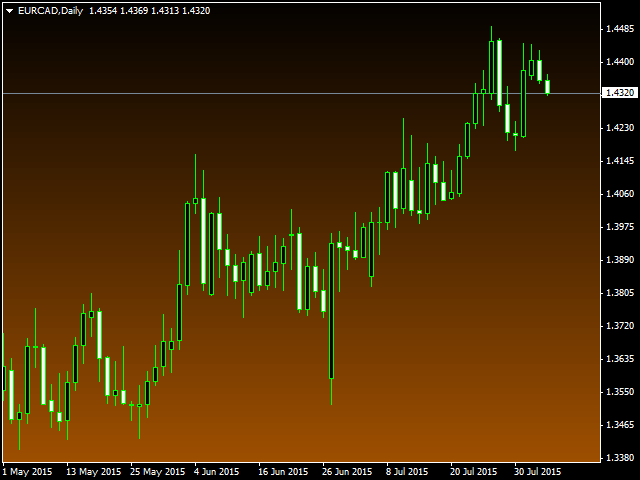
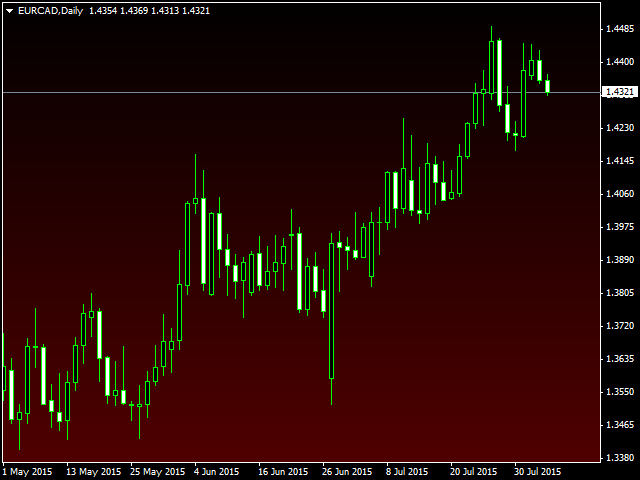
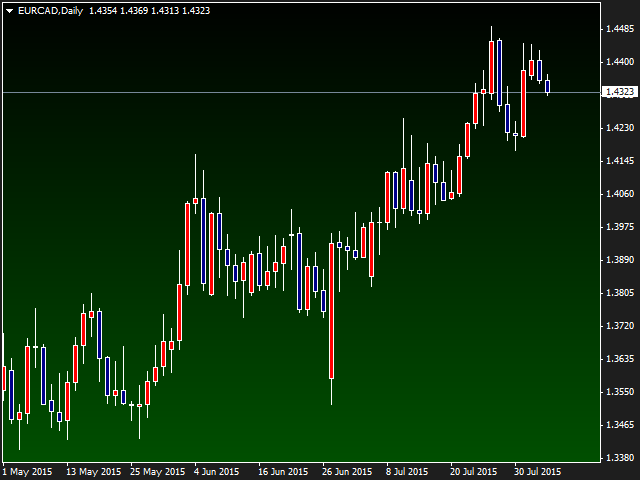
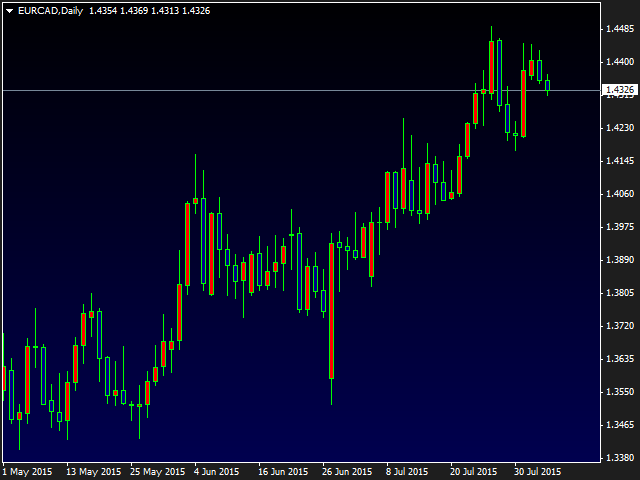
It is widely known that colors affect the emotional state of a human, especially if this human is a trader. Psychologists recommend that you follow your instincts and select the color of your environment that is most comfortable to you. In order to reduce emotional stress, impact of colors on a person should be considered. The optimal range of the most beneficial colors includes green, yellow-green and green-blue ones.

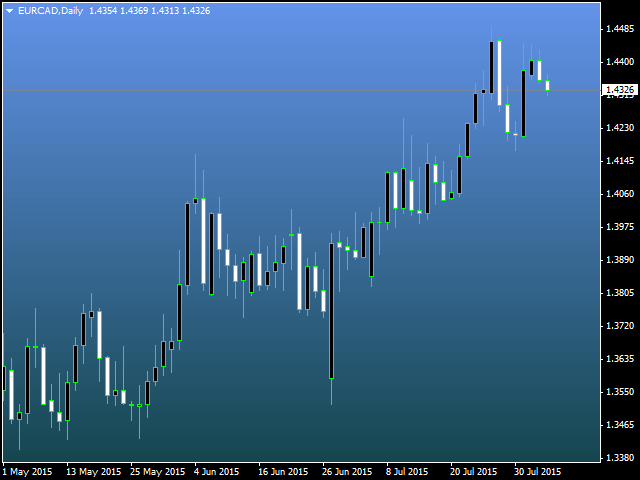
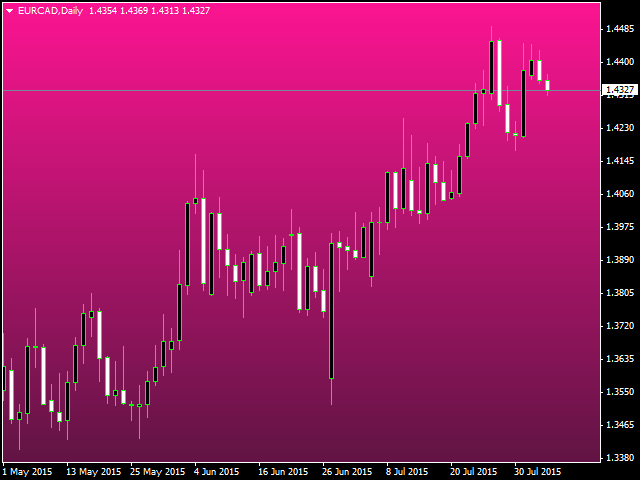
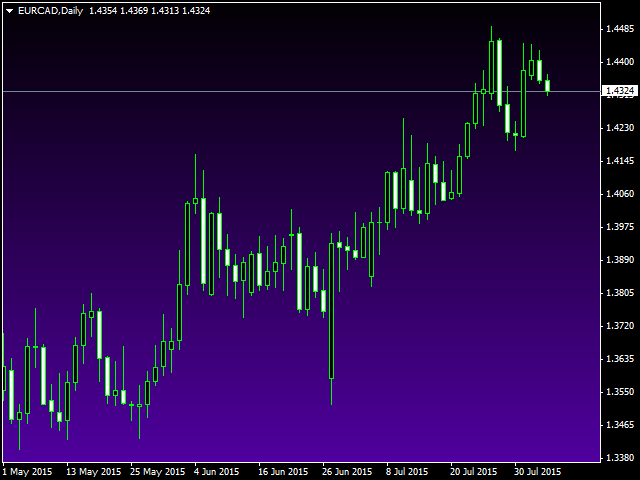
This indicator allows you to manage your emotional state and health. Choose a color (program) you currently need. It is simple: set the sunset (default) or sunrise mode and select a color palette. You can use both primary colors and custom sets. The option for replacing all chart background primary colors allows you to paint over all symbol chart windows. Set a background in the main background parameter, so that its initial parameters remain intact after deleting the indicator.

I hope, you will like the broad selection the product provides. Your feedback is appreciated.


Parameters

  • Sunrise mode (true) or sunset - sunrise (true) or sunset mode;
  • Replacement of the main colors of the background - change the main background colors (enable if you want to change the color of the bottom windows);
  • The basic background - main background (set after removing the indicator);
  • Background color of the screen - screen background color to be transformed.
おすすめのプロダクト
Free automatic Fibonacci is an indicator that automatically plots a Fibonacci retracement based on the number of bars you select on the BarsToScan setting in the indicator. The Fibonacci is automatically updated in real time as new highest and lowest values appears amongst the selected bars. You can select which level values to be displayed in the indicator settings. You can also select the color of the levels thus enabling the trader to be able to attach the indicator several times with differe
FREE
The VR Orders History script is designed to upload a trade report to a csv file. This format is intended for additional analysis of trading history in programs such as EXCEL, Openoffice, and Libreoffice. Thanks to the script, it is now much easier for a trader to analyze their trading history. The program facilitates the analysis of the trading history for the MetaTrader 5 terminal. The trader sees structured trading. The entire report is based on the following principle: Position > Order on the
FREE
Follow The Line
Oliver Gideon Amofa Appiah
3.94 (16)
FOLLOW THE LINE GET THE FULL VERSION HERE: https://www.mql5.com/en/market/product/36024 This indicator obeys the popular maxim that: "THE TREND IS YOUR FRIEND" It paints a GREEN line for BUY and also paints a RED line for SELL.  It gives alarms and alerts of all kinds. IT DOES NOT REPAINT and can be used for all currency pairs and timeframes. Yes, as easy and simple as that. Even a newbie can use it to make great and reliable trades. NB: For best results, get my other premium indicators for more
FREE
The indicator calculates the current spread for each tick using the formula Spread=(ASK-BID)/Point. Schedule of changes in the boundaries spread over the timeframe displayed in a separate window from the date of accession of the indicator. Two lines corresponding to the minimum and maximum spread values are displayed. The indicator window is self-adjusted according to the minimum and maximum values from the moment of launch. The minimum and maximum values for the entire period of the indicator o
FREE
SA Assistant is an intuitive tool without complicated settings, designed to facilitate the trading operations in the MetaTrader 4 terminal. SA Assistant is not designed for working in the strategy tester. The demo version works only on the USDCAD pair. Please test the EA on a demo account before using it on a live account. The SA Assistant EA is visually divided into 4 blocks: 1. "Information" - displays in real time: trading account balance leverage spread of the instrument the EA is attached
FREE
The indicator displays signals according to the strategy of Bill Williams on the chart. Demo version of the indicator has the same features as the paid, except that it can work only on a demo account . Signal "First Wise Man" is formed when there is a divergent bar with angulation.  Bullish divergent bar - with lower minimum and closing price in the upper half. Bearish divergent bar - higher maximum and the closing price at the bottom half. Angulation is formed when all three lines of Alligator
FREE
PZ The Zone
PZ TRADING SLU
4.33 (3)
This indicator displays buy or sell signals according to Bill Williams' definition of the Trading Zone. [ Installation Guide | Update Guide | Troubleshooting | FAQ | All Products ] Easy to use and understand Avoid trading flat markets Deterministic indicator with clear rules The indicator is non-repainting It implements alerts of all kinds It has straightforward trading implications. A blue arrow is a buy signal A red arrow is a sell signal According to Bill Williams trading in the zone helps to
FREE
#property copyright "小天" #property link      " https://www.mql5.com " #property version   "2.01" #property strict #property description "test" input int hlength=85; input int vlength=25; input int DX=-340; input int DY=-80; input string InpDirectoryName="Data"; // directory name input double lots_default=1; input int    pc_times_default=2; input double deposit_minimal=1; input double floating_loss_percent=0.1; input double margin_occupied=0.2;   input int    tradingnumber=1;//控制买卖交易数量  input
FREE
The Cossover MA Histogram indicator is a simple tool showing the trend based on crossover of moving averages. Simply specify two mobving averages and addicional parameters like MA method and Applied price. When fast MA is above slow MA the histogram is green, indicating an uptrend. When MA fast is below MA slow the histogram is red, indicating an downtrend.
FREE
+ 2 bonus strategies! Alerts! I recommend watching my advisor -   Night Zen EA The indicator combines the most popular moving average strategies: Simple moving average crossover. Moving average crossover relative to the position of the slower moving average. 2 bonus strategies : The crossing of the fast moving average with the calculation of the opening prices of the slow moving average with the calculation of the closing prices taking into account the slower moving average. (The settings for th
FREE
Smart RSI MT4
Mostafa Saad Saeed Shawara
製品名 Smart RSI (MT4) – SmartView シリーズ 短い説明 MetaTrader プラットフォームで独特なユーザー体験を提供する RSI インジケーター。以前は利用できなかった高度な機能を提供し、ダブルクリックで設定を開く、削除せずにインジケーターを非表示/表示する、インジケーターウィンドウをチャート全体のサイズで表示するなどの機能を備えています。SmartView Indicators シリーズの残りの部分とシームレスに連携するように設計されています。 概要 SmartView シリーズは、革新的な機能を通じて MetaTrader プラットフォーム上のインジケーターに独特で特徴的なユーザー体験を提供し、インジケーター管理をより速く、より簡単にします。各インジケーターには、チャート上のスマートコントロールパネルが装備されており、基本情報を表示し、すべての重要な機能への迅速なアクセスを提供します。 以前は利用できなかった独自の機能 SmartView シリーズは、インジケーターでの作業をより簡単で迅速にする高度な機能を提供します: ダブルクリックで設定を開く:
FREE
Power Trend Free - the indicator shows the trend strength in the selected period. Input Parameters The indicator has three input parameters: Period - a positive number greater than one, it shows the number of candlesticks used for calculations. If you enter one or zero, there will be no error, but the indicator will not be drawn. Applied Price - the standard "Apply to:" set meaning data used for the indicator calculation: Close - Close prices; Open - Open prices; High - High prices; Low - Low p
FREE
For those who like trend the Force will be a very useful indicator. This is because it is based on the famouse ADX, which measure the strenght of a trend, but without its 3 confusing lines. Force has its very simple interpretation: if the histogram is above zero level the trend is up, otherwise it is down. You can use it to find divergences too, which is very profitable. If you have any doubt or suggestion, please, contact me. Enjoy! MT5 version:  https://www.mql5.com/en/market/product/41928 T
FREE
Stat Monitor is a good information indicator. Benefits of the indicator: The indicator provides useful information - the current spread, the cost of one lot of the symbol, trading leverage and the recommended lot size for trading. You can use the indicator on the MetaTrader 4 trading platform of any broker. The indicator provides useful information. Version of the Stat Monitor indicator for MetaTrader 5 I wish you all good luck in trading and stable profit!
FREE
MASi Three Screens is based on the trading strategy by Dr. Alexander Elder. This indicator is a collection of algorithms. Algorithms are based on the analysis of charts of several timeframes. You can apply any of the provided algorithms. List of versions of algorithms:     ThreeScreens v1.0 - A simple implementation, with analysis of the MACD line;     ThreeScreens v1.1 - A simple implementation, with analysis of the MACD histogram;     ThreeScreens v1.2 - Combines the first two algorithms in
FREE
THIS FREE INDICATOR ALLOWS YOU TO SET THE TIMEFRAME OF THE MA YOU WANT ON YOUR CHART For example, it's very useful if you want to trade the H4 200 SMA using a lower timeframe chart, to identify price reactions such as reversals, Wyckoff schematics, etc. ***Please comment, rate and share it to your friends if you like it*** ------------------------------------------------------------------------- Moving averages are popular technical indicators used to identify trends, support and resistance leve
FREE
Basic Harmonic Pattern
Mehran Sepah Mansoor
4.58 (59)
このインディケータは、相場の反転ポイントを予測する最もポピュラーなハーモニックパターンを識別します。これらのハーモニックパターンは、外国為替市場で常に繰り返され ている価格形成であり、将来起こりうる値動きを示唆します。/   MT5無料バージョン さらに、このインジケーターには、市場エントリーシグナルと、様々な利食いと損切りが組み込まれています。ハーモニック・パターン・インディケータは、それ自体で売買シグナルを発 信することができますが、他のテクニカル・インディケータを使用してこれらの シグナルを確認することをお勧めします。例えば、RSIやMACDなどのオシレーターを使用して、トレンドの方向性やモメンタ ムの強さを確認してから売買を行うことを検討するとよいでしょう。 このインディケータのダッシュボードスキャナ: ( Basic Harmonic Patterns Dashboard ) 含まれるハーモニックパターン ガートレー バタフライ バット カニ サメ サイファー ABCD 主な入力 Max allowed deviation (%): このパラメータは、調和的パタ
FREE
Classic ZigZag formula. But no lags and repaints. You can see on screenshots that it shows values between peaks and it is useful to test strategies based on indicator. Because sometimes people find a good idea about it but don't understand that repainting indicators have some things to keep in mind. The parameters are the same as original ZigZag indicator: Depth, Deviation and Backstep.
FREE
Constructor is a convenient tool for creating, (building strategies) testing and applying trading strategies and ideas, as well as testing and using separate indicators and their groups. Constructor includes opening, closing, deal tracking, averaging and recovery modules, as well as various trading options with and without averaging and martingale. You are able to connect up to 10 different external indicators. Find the detailed instructions in the attached pdf file. Trading settings averaging
FREE
AutoClusterEdge – Nguồn điện có cấu trúc. Phục hồi chiến lược. AutoClusterEdge là một hệ thống tự động dịch hoàn toàn được thiết kế cho các giao dịch dựa trên hệ thống mạng. Hệ thống tích hợp Chỉ số sức mạnh tương đối (RSI), Đường trung bình động (MA) và Phạm vi biến động thực trung bình (ATR) để khởi tạo và quản lý các cụm giao dịch, điều chỉnh mô-đun thế một cách hoạt động bằng cách sử dụng chuỗi Fibonacci và thực hiện lệnh thoát chiến lược có điều kiện. Hệ thống này đặc biệt phù hợp với nhữn
FREE
MACD indicator in MetaTrader 4/5 looks different than MACD does in most other charting software. That is because the MetaTrader 4/5 version of MACD displays the MACD line as a histogram when it is traditionally displayed as a line. Additionally, the MetaTrader 4/5 version computes the Signal line using an SMA, while according to MACD definition it is supposed to be an EMA. The MetaTrader 4/5 version also does not compute a true MACD Histogram (the difference between the MACD/Signal lines). This
FREE
HMA Trend
Pavel Zamoshnikov
4.54 (70)
A trend indicator based on the Hull Moving Average (HMA) with two periods. The Hull Moving Average is an improved variant of the moving average, which shows the moment of trend reversal quite accurately. It is often used as a signal filter. Combination of two types of Hull Moving Averages makes a better use of these advantages: HMA with a slow period identifies the trend, while HMA with a fast period determines the short-term movements and signals in the trend direction. Features The movement d
FREE
CCFp (Complex_Common_Frames percent) は、通貨の強弱を判断する指標で、 各通貨ごとの「短期移動平均」と「長期移動平均」の変化率の総計を示しています。 USD、EUR、JPY、CHF、GBP、AUD、CAD、NZDの8つの主要通貨に対して対応しております。 1.グラフの右端に通貨名を表示します。 2.各通貨の表示色を変更できます。 3.移動平均平滑化タイプ(ENUM_MA_METHOD)が選択可能です。 4.価格定数(ENUM_APPLIED_PRICE)が変更可能です。 5.短期移動平均期間(Fast)を変更できます。 6.短期移動平均期間(Slow)を変更できます。 ***28通貨ペアが全て選択されていることが必要です。 ***週足よりも小さい時間足利用を推奨します。
FREE
Velvet RVI is intended for use with the Velvet advanced ordering layer.  It is based on the algorithm for the Relative Vigor Index, provided by Investopedia here . All of the data it displays is accurate and verified against the internal API function iRVI, when it is detected by the ordering layer.  In order to place orders with the Velvet RVI indicator, the ordering layer must be installed and running.  Ordering from the Velvet RVI indicator requires that "Velvet Ordering Layer" ( found here ),
FREE
A ratio between 0 and 1 with the higher values representing a more efficient or trending market,  It is used in the calculation of Perry J. Kaufman Adaptive Moving Average (KAMA), dividing the price change over a period by the absolute sum of the price movements that occurred to achieve that change. The Fractal Efficiency or also known as Efficiency Ratio was first published by Perry J. Kaufman in his book ‘Smarter Trading‘. This is mostly considered a filter for volatile markets none the less
FREE
Didta
Mykhailo Zakervashevych
5 (1)
Indicator Description: DISH X Imbalance (DIDTA/DIDFA) 1. Overview The   DISH X Imbalance   indicator is a sophisticated volume-based technical analysis tool for MetaTrader 4 that analyzes market order flow imbalance to identify potential trend reversals and fair value deviations. The indicator calculates two core values:   DIDTA (Daily Imbalance Delta)   and   DIDFA (Daily Imbalance Delta Fair Value) , providing traders with insights into buying/selling pressure and market valuation. 2. Core Com
FREE
ET1 for MT4 is new and completely free!! ET1 for MT4 v4.20 Updated!! Now use on XAUUSD(Gold)!! The success rate is more than 75% !!! important update: Merge ET9 's breakout strategy Warning!! You can use ET1 completely free, but we do not guarantee ET1 stability, It is recommended that the more powerful ET9 for MT4 version includes the ET1 strategy and guarantees complete and stable returns. The Best Expert Advisor  on   XAUUSD   any timeframes  ET9  for MT4 Updated v4.80 !!  https://www.mql5
FREE
RSI Candle Signal
Jonathan Destailleur
4.5 (2)
RSI Candle Signal Indicator will change bars’ color when set overbought or oversold levels reach. How to Use RSI Candle Signal Uptrend/Downtrends  - RSI may be used to detect trending markets. For example, the RSI may stay above the mid line 50 in an uptrend. Top and Buttoms  - RSI may help in identifying the tops around the overbought readings (usually above 70), and the bottoms around the oversold area (usually below 30). Divergence  - divergence occurs when RSI directional movement is not co
FREE
This product is based on the single indicator TREND MATE. Link: https://www.mql5.com/es/market/product/50082 The aim of this EA is to watch for all pairs in a single panel in order to have a quick view of changes or new uptrends/downtrends. It is possible to watch from your mobile by sending push notifications when changes appear. If you want to have all push notifications for even exit trends you may receive multiple messages.
FREE
Introductory Pricing for one month Brute force trader is specially designed to find the best entry point and exit point with the regular tested and proven indicators. The EA will automatically analyse the market and will follow trends with the right entry exit points. Since the timeframe it is using is 30 minutes, the chances that you are stuck into a long trade is very low. Thought it does not use stoploss but it has the
FREE
このプロダクトを購入した人は以下も購入しています
Local Trade Copier EA MT4
Juvenille Emperor Limited
4.96 (108)
Local Trade Copier EA MT4 による、驚くほど高速な取引コピーを体験してください。1分で簡単にセットアップできるこの取引コピー機は、同じWindowsコンピュータまたはWindows VPS上の複数のMetaTrader端末間で取引をコピーすることができ、0.5秒未満の高速コピースピードを実現します。 初心者であろうとプロのトレーダーであろうと、 Local Trade Copier EA MT4 には、あなたの特定のニーズに合わせてカスタマイズするための幅広いオプションが用意されています。これは、利益の可能性を高めたい人にとって究極のソリューションです。 今すぐ試してみて、これが市場で最も速くて簡単なトレードコピー機である理由を理解してください。 ヒント: デモアカウントで Local Trade Copier EA MT4 デモバージョンをダウンロードして試すことができます: ここ ダウンロードした無料のデモ ファイルを MT4 >> ファイル >> データ フォルダを開く >> MQL4 >> Experts フォルダに貼り付けて、ターミナルを再起動しま
Trade Assistant MT4
Evgeniy Kravchenko
4.42 (193)
取引 ごとのリスクの 計算、新規注文 の 簡単 な 設置、部分的 な 決済機能 を 持 つ 注文管理、 7 種類 のトレーリングストップなど 、便利 な 機能 を 備 えています 。 追加の資料と説明書 インストール手順 - アプリケーションの手順 - デモアカウント用アプリケーションの試用版 ライン機能 チャート上にオープニングライン、ストップロス、テイクプロフィットを表示します。この機能により、新規注文を簡単に設定することができ、注文を出す前にその特徴を確認することができます。   リスク計算 リスク計算機能は、設定されたリスクとストップロス注文のサイズを考慮して、新規注文のボリュームを計算します。ストップロスの大きさを自由に設定できると同時に、設定したリスクを守ることができます。 Lot calc ボタン - リスク 計算 を 有効 / 無効 にします 。 Risk フィールドでは 、必要 なリスクの 値 を 0 から 100 までのパーセンテージまたは 預金通貨 で 設定 します 。 設定」 タブで 、 リスク 計算 の 種類 を 選択 します :「 $ 通貨」、「 % 残
Trade Manager EAへようこそ。これは、取引をより直感的、正確、そして効率的にするために設計された究極の リスク管理ツール です。これは単なるオーダー実行ツールではなく、包括的な取引計画、ポジション管理、リスク管理のためのソリューションです。初心者から上級者、迅速な実行を必要とするスキャルパーまで、Trade Manager EAはあらゆるニーズに対応し、為替、指数、商品、暗号通貨などさまざまな市場で柔軟に対応します。 Trade Manager EAを使用すると、複雑な計算が過去のものになります。市場を分析し、エントリーポイント、ストップロス、テイクプロフィットのレベルをチャート上のラインでマークし、リスクを設定するだけで、Trade Managerが最適なポジションサイズを即座に計算し、SLとTPをピップ、ポイント、口座通貨でリアルタイムに表示します。すべての取引が簡単かつ効果的に管理されます。 主な機能: ポジションサイズ計算機 :定義されたリスクに基づいて取引サイズを瞬時に決定します。 簡単な取引計画 :エントリー、ストップロス、テイクプロフィットを設定するためのド
Exp COPYLOT CLIENT for MT4
Vladislav Andruschenko
4.65 (66)
MetaTrader4のコピー機を取引します。     それは任意の口座からの外国為替取引、ポジション、注文をコピーします。 それは最高の貿易コピー機の1つです     MT4 - MT4、MT5 - MT4     のために     COPYLOT MT4     バージョン(または     MT4 - MT5  MT5 - MT5     のために     COPYLOT MT5     バージョン)。 MT5のバージョン 完全な説明   +DEMO +PDF 購入する方法 インストールする方法     ログファイルの取得方法     テストと最適化の方法     Expforex のすべての製品 のコピー機 バージョン       MetaTrader 5 ターミナル(   МТ5 - МТ5、МТ4 - МТ5   )-   コピーロットクライアントMT5 独自のコピーアルゴリズムにより、すべての取引がマスターアカウントからクライアントアカウントに正確にコピーされます。 また、動作速度が速いことでも知られています。タフなエラー処理。 強力な機能セット。 プログラムは、複数
Copy Cat More Trade Copier MT4 (コピー猫MT4) は単なるローカル取引コピーツールではなく、現代の取引課題に対応するために設計された完全なリスク管理と実行フレームワークです。Propファームのチャレンジから個人の資産管理まで、強力な実行力、資金保護、柔軟な設定、高度な取引処理を組み合わせ、あらゆる状況に適応します。 このコピーツールは Master(送信側) と Slave(受信側) の両モードで動作し、成行注文や指値注文のリアルタイム同期、取引修正、部分決済、Close By 操作をサポートします。デモ口座・リアル口座の両方に対応し、取引用パスワードまたは投資家パスワードでも利用可能です。Persistent Trade Memory 技術により、EA・ターミナル・VPS が再起動しても復元可能です。複数の Master と Slave を同時に管理でき、ブローカー間の違いはプレフィックス/サフィックスの自動調整やシンボルマッピングで処理されます。 マニュアル/設定: Copy Cat Trading Copier マニュアル Copy Cat Mo
Crystal Trade Manager PRO – MT4向け 高度リスク管理・トレードコントロールシステム 無料版: https://www.mql5.com/en/market/product/150632 概要 Crystal Trade Manager PRO(CTM)は、MetaTrader 4 のために設計された、プロフェッショナル向けのリスク管理および取引管理ユーティリティです。 厳密な執行、強力な資金保護、高度な自動化を必要とするトレーダーのために構築されています。 本システムは、リスク管理、エクイティ保護、日次制限、SL/TP の自動設定を行い、プロレベルの高速ワンクリック取引パネルを提供します。 Prop Firm チャレンジ、デイトレード、スキャルピング、資金運用者に最適です。 MT5版も利用可能です。 主な特徴 1. 高度なリスク・ドローダウン保護 日次ドローダウン上限を 1%〜70% の範囲で設定可能。 上限超過時、 全てのポジションを即時クローズ 。 オプションで 全ての保留注文(Pending Orders)を自動削除 。 日次ロックアウトモード:翌日
Tired of complex order placement and manual calculations? Trade Dashboard is your solution. With its user-friendly interface, placing orders becomes effortless, by a single click, you can open trades, set stop loss and take profit levels, manage trade lot size, and calculate risk to reward ratios, allowing you to only focus on your strategy. Say goodbye to manual calculations and streamline your trading experience with Trade Dashboard. Download  Demo Version  right now. You can find  Details of
Trade copier MT4
Alfiya Fazylova
4.58 (33)
Trade Copierは、取引口座間の取引をコピーして同期するように設計された専門的なユーティリティです。 コピーは、同じコンピューターまたはvps にインストールされている、サプライヤーのアカウント/端末から受信者のアカウント/端末に行われます。 購入する前に、デモ アカウントでデモ バージョンをテストできます。 デモ版 こちら 。 詳細な説明は こちら 。 主な機能と利点: MT5ネッティングアカウントを含む、MT4> MT4、MT4> MT5、MT5> MT4のコピーをサポートします。 高いコピー速度(0.5秒未満)。 ベンダーモードと受信者モードは同じ製品内に実装されています。 チャートから直接リアルタイムでコピーを制御できる、簡単で直感的なインターフェイス。 接続が切断されたり、端末が再起動されたりしても、設定と位置が失われることはありません。 コピーするシンボルを選択できます。また、受信者のシンボルを置き換えることもできます(例:EURUSD> USDJPY)。 バックコピーをサポートします。 特定の注文のみのコピーを有効にする機能。 取引開始価格の最大差と最大遅延時間を
The product will copy all telegram signal to MT4   ( which you are member  ) , also it can work as remote copier.  Easy to set up, copy order instant, can work with almost signal formats, image signal, s upport to translate other language to English Work with all type of channel or group, even channel have "Restrict Saving Content", work with  multi channel, multi MT5 Work as remote copier: with signal have ticket number, it will copy exactly via ticket number. Support to backtest signal. How to
News Filter EA: Advanced Algo Trading Assistant News Filter EA is an advanced algo trading assistant designed to enhance your trading experience. By using the   News Filter EA , you can integrate a Forex economic news filter into your existing expert advisor, even if you do not have access to its source code. In addition to the news filter, you can also specify   trading days   and   hours   for your expert. The News Filter EA also includes   risk management   and   equity protection   features
Equity Protect Pro: 安心取引のための総合的な口座保護エキスパート 口座保護、資産保護、ポートフォリオ保護、マルチ戦略保護、利益保護、利益確定、取引セキュリティ、リスク管理プログラム、自動リスク管理、自動決済、条件付き決済、スケジュール決済、動的決済、トレーリングストップロス、ワンクリッククローズ、ワンクリック決済、ワンクリック復元などの機能をお探しなら、Equity Protect Pro が最適なプログラムです。 設定は簡単で、事前設定された条件に達すると、すべてのチャートを閉じることができ、シグナルサブスクリプションのキャンセルもサポートします(これは、すべての取引プログラムも停止することを意味します)。この時点で、新しい注文は生成されなくなり、最終的にすべての注文が閉じられ、予期せぬ損失を効果的に防止し、安心して取引できるようになります。 Equity Protect Pro Demo Version for yo u to test   Equity Protect Pro MT4 Demo.ex4 Equity Protect Pro MT5 Demo.
コピー機->便利で高速なインターフェースインタラクション、ユーザーはすぐに使用できます     ->>>> WindowsコンピュータまたはVPS Windowsでの使用を推奨 特徴: 多様でパーソナライズされたコピー取引設定:1. 異なるシグナルソースに異なるロットモードを設定できます。2. フォワードコピー取引とリバースコピー取引に異なるシグナルソースを設定できます。3. シグナルはコメントで設定できます。4. 契約ロットに応じてロットを調整するかどうか 多様でパーソナライズされたコピー注文設定2:1.品種ごとに異なるロットモードを設定できます2.順方向コピー注文と逆方向コピー注文に異なる品種を設定できます3.コメントでシグナルを設定できます4.契約ロットに応じてロットを調整するかどうか コメントフィルタリング、MAGICフィルタリング、シグナルロットフィルタリング、ローカル製品フィルタリング 勤務時間設定 逆同期SLAVE終了 注文バインド機能: 任意の注文を設定されたシグナルソース注文にバインドできます (テーブルをダブルクリックして編集します) アカウントリスク管理 基本
日ごとおよび週ごとのクローズ取引履歴、現在のオープン取引、および外国為替エクスポージャーを 1 つのチャートで即座に確認できます。ヒートマップを使用して、収益性の高い取引と、取引ポートフォリオ内の現在のドローダウンの位置を特定します。 クイック クローズ ボタン クイック クローズ ボタンを使用すると、1 つのシンボルのすべての取引をクローズしたり、個々の取引を完全にクローズしたり、ボタンをクリックするだけで部分的な利益または損失を取得したりできます。リストで取引を探したり、取引の一部をクローズする方法を考えたりする必要はもうありません。ダッシュボードには、外国為替ペアの取引中に各通貨シンボルの現在のエクスポージャーも表示されるため、主要なニュース イベントの前にエクスポージャーが過剰になっている可能性のある領域を特定するのに役立ちます。ボタンを使用して、ニュースの前にエクスポージャーを即座にすばやく減らすことができます。または、ニュースがすでに発生して利益が出ている場合は、1 回のクリックでその利益をすばやく銀行に預けることができます。 オープン取引ヒートマップ 取引ヒートマッ
Comprehensive on chart trade panel with the unique ability to be controllable from mobile as well. Plus has a library of downloadable configuration, e.g. exit rules, extra panel buttons, pending order setup and more. Please see our product video. Works with all symbols not just currency pairs. Features On chart panel plus controllable from free app for Windows, iPhone and Android Built-in script engine with library of downloadable configuration, e.g. add 'Close All Trades in Profit' button, exit
One tool to protect all your EAs — news filter, equity protection, time filter and more — free demo available Take a Break has evolved from a basic news filter into a comprehensive account protection solution. It pauses your other Expert Advisors during news events or based on custom filters. When trading resumes, it automatically restores your entire chart setup , including all EA settings. Typical use cases: One news filter for all your EAs. Pause trading during news or high volatility — and c
MT4 to Telegram Signal Provider は使いやすく、完全にカスタマイズ可能なツールで、Telegramに信号を送信し、あなたのアカウントを信号提供者に変えることができます。 メッセージのフォーマットは 完全にカスタマイズ可能です! しかし、簡単な使用のために、あらかじめ定義されたテンプレートを選択し、メッセージの特定の部分を有効または無効にすることもできます。 [ デモ ]   [ マニュアル ] [ MT5バージョン ] [ Discordバージョン ] [ Telegramチャンネル ]  New: [ Telegram To MT5 ] セットアップ ステップバイステップの ユーザーガイド が利用可能です。 Telegram APIの知識は必要ありません。開発者が必要なものをすべて提供します。 主要機能 購読者に送信される注文の詳細をカスタマイズする機能 例えばブロンズ、シルバー、ゴールドなど、階層型のサブスクリプションモデルを作成できます。ゴールドサブスクリプションでは、すべての信号が得られますなど。 ID、シンボル、またはコメントによる注文のフ
Ultimate MT4 to Telegram (UMT) sends controlled trades (via symbol, magic, comment) to your telegram channel. It sends open and closed trades, including pending orders and TP/SL modifications, along with chart screenshots, to any telegram channel. Additionally, you can send trade reports of open trades and summary profit/pip reports for day, week, or month. You can customize the design of the trade actions or reports with variables and emoticons.  A beautiful panel allows you to visualize all t
Risk/Reward Toolは、MetaTrader 4でのトレード計画、可視化、執行の方法を革新するために設計されたプロフェッショナルグレードのエキスパートアドバイザーです。精密なリスク管理を重視する裁量トレーダーでも、トレード設定を視覚的にテストする必要のある戦略開発者でも、このツールはエレガントで直感的なインターフェースで必要なすべてを提供します。 基本的なポジション計算機とは異なり、Risk/Reward Toolは視覚的なトレード計画を即時執行機能、リアルタイムの損益モニタリング、包括的なトレード管理機能と組み合わせています。このツールはMT4ストラテジーテスターと完全に互換性があり、実際の資金をリスクにさらすことなくトレード戦略を練習し、アプローチを改善することができます。 ツールの完全なマニュアルはこちら: https://www.mql5.com/en/blogs/post/766244 MT5 version:  https://www.mql5.com/en/market/product/158601 主な機能 視覚的なトレード計画 ドラッグ&ドロップ操作可能
OrderManager をご紹介:MT4用の革新的なユーティリティ 新しく設計されたOrder Managerユーティリティを使用して、MetaTrader 4での取引をプロフェッショナルなものにしましょう。シンプルさと使いやすさに焦点を当てたこのユーティリティは、各取引に関連するリスクを簡単に定義し、視覚化できます。これにより、情報に基づいた意思決定が可能になり、取引戦略を最適化できます。OrderManagerに関する詳細は、マニュアルをご参照ください。 [ マニュアル ] [ MT5 バージョン ] [ Telegram チャンネル ]  New: [ Telegram To MT5 ] 主な特長: リスク管理:取引のリスクを素早く簡単に定義し、より良い意思決定を行い、取引パフォーマンスを向上させます。 視覚表現:オープンなポジションとそれに関連するリスクをグラフィカルに表示し、明瞭かつ簡潔な理解が可能です。 注文変更:数回のクリックで注文を簡単に変更またはクローズし、取引プロセスを効率化し、貴重な時間を節約します。 手のひらの上の最新ニュース:ボタン一つで最新の市場ニュース
利益追跡機能により、MetaTrader 4で総利益/損失に達した時にポジションをクローズします。 仮想ストップ(個別注文) を有効にできます。 買いと売りのポジションを別々に計算してクローズ(別々の買い/売り) します。 すべてのシンボルまたは現在のシンボルのみをクローズして計算(すべてのシンボル) します。 利益追跡(トレーリング・プロフィット) を有効にします。 預金通貨、ポイント、残高の%で総利益または損失をクローズします。 このアプリケーションは、他のEAと一緒に、または手動取引と組み合わせて、任意のアカウントで使用するために設計されています。 MT5 のバージョン 完全な説明 +DEMO +PDF 購入する方法 インストールする方法 ログファイルの取得方法 テストと最適化の方法 Expforex のすべての製品 取引ペアの全てまたは一部の合計バランスが設定された値以上になった時点で、すべてのポジションがクローズされ、注文が削除されます。 このバージョンは、指定された利益レベルでポジションをクローズできるだけでなく、より良い結果を得るために利益を追跡することも可能です。 C
What is it? Think about it, you can send all the orders/positions info to your telegram channel or group to create your community or VIP signals on telegram. Position info means this EA forward all of your new positions open details (Open price, Open time, Position Type, position Symbol and volume), positions changes ( SL or TP modifying or pending price changes) and position close (Close price, profit or loss, position duration time) and also EA Send NEWS alert (Economic calendar event) on you
VirtualTradePad mt4 Extra
Vladislav Andruschenko
4.86 (59)
ワンクリックで取引できるトレーディングパネル。ポジションと注文の操作!チャートまたはキーボードから取引。 手動取引用の取引パネル。チャート(チャートウィンドウ)またはキーボードから取引できます。開閉、リバース、ロックポジションと注文を処理する МetaТrader4のメインオーダーのトレーディングコントロールパネル:売買、売却、売却、売却、売却、閉じる、削除、修正、トレーリングストップ、ストップロス、takeproft MT5のバージョン 完全な説明   +DEMO +PDF 購入する方法 インストールする方法     ログファイルの取得方法     テストと最適化の方法     Expforex のすべての製品 シンボルウィンドウからの取引とキーボードからの取引! あなたはMetaTrader 4ターミナル - バーチャルコントロールパネルVirtualTradePadのためのユニークなプラグインを持っています。 Description on English 注意!  ストラテジーテスターの 取引方法を学びたい場合は、無料の TesterPad ユーティリティをチェックしてくだ
TradePanel MT4
Alfiya Fazylova
4.85 (92)
Trade Panel は、多機能の取引アシスタントです。このアプリケーションには手動取引用の 50 を超える取引機能が含まれており、ほとんどの取引操作を自動化できます。 注意、アプリケーションはストラテジー テスターでは動作しません。購入する前に、デモアカウントでデモ版をテストできます。デモ版 ここ 。 完全な手順 こちら 。 取引。 ワンクリックで取引操作を実行できます: 自動リスク計算を使用して未決の注文とポジションをオープンします。 ワンクリックで複数の注文とポジションをオープンします。 注文グリッドを開きます。 未決の注文とポジションをグループごとにクローズします。 ポジション反転 (買いを閉じて売りを開く、または売りを閉じて買いを開く)。 ポジションをロックします(買いポジションと売りポジションの量を均等にする追加のポジションをオープンします)。 ワンクリックですべてのポジションを部分的にクローズします。 すべてのポジションのテイクプロフィットとストップロスを同じ価格レベルに設定します。 すべてのポジションのストップロスをポジションの損益分岐点レベルに設定します。 注文とポ
Eezeorder 2
Tawanda Tinarwo
5 (2)
NEW VERSION!  NB: IF YOU ARE USING A VERY HIGH RESOLUTION MACHINE AND THE EA DISPLAY LOOKS TOO SMALL, CONTACT ME SO I CAN HELP YOU. Open Multiple Trades on MT4 in 1 click at one price. Enter the Lot size Specify the number of trades you want to open Choose whether you want TP SL or Trailing Stop Once you are done, click Buy or Sell Open Multiple Pending Orders on MT4 in 1 click at one price. Enter the Lot size Specify the gap from the current price, where you want to place the pending order Spe
--------------Welcome to use [MQL5 Signal Analyze Master]------------------  Function: Draw order tracks of MQL5 MT4 and MT5 signal on MT4 chart. [Using guide] 1.Use it as Experts. 2.Download history record from MQL5 signal(MT4 signal or MT5 signal).  3.Paste history record file below "MQL4/Files/" 4.Load [Signal Analyze Master] on the symbol chart what you want to analyze. 5.Paste the history record file name to parameter 'FileName' 6.Select  SignalType  match the history you download on MT4
Local Trade Copier   is an advanced tool designed for efficiently copying trades between accounts in the   local   mode. It allows for lightning-fast order replication from a master account to a slave account. In local mode, trades are copied instantly, while in remote mode, the copying process takes less than 1 second. MT5 Version MT5 Full Version (Local & Remote) MT4 Full Version (Local & Remote) Local mode refers to both MetaTrader platforms being installed on the same system. It fully suppo
MT4 to Discord Signal Provider は、Discord へ直接トレーディングシグナルを送信するために設計された、使いやすく完全にカスタマイズ可能なユーティリティです。このツールは、あなたのトレーディングアカウントを効率的なシグナルプロバイダーに変えます。 スタイルに合わせてメッセージフォーマットをカスタマイズ!利便性を考え、事前にデザインされたテンプレートから選択し、メッセージのどの要素を含めるか除外するかを選択できます。 [ デモ ] [ マニュアル ] [ MT5 バージョン ] [ Telegram バージョン ]  New: [ Telegram To MT5 ] セットアップ 簡単なセットアップのために、私たちの詳細な ユーザーガイド に従ってください。 Discord API の事前知識は必要ありません。必要なツールはすべて提供されます。 主な特徴 購読者の更新のための注文詳細をカスタマイズ。 ブロンズ、シルバー、ゴールドなど、各レベルで異なるシグナルアクセスを提供する階層的サブスクリプションモデルを実装。 注文が実行されたチャートのスクリーン
Custom Alerts:複数市場を監視し、重要なチャンスを見逃さない 概要 Custom Alerts は、複数の銘柄にまたがるトレードチャンスを一元的に監視したいトレーダーのためのダイナミックなソリューションです。FX Power、FX Volume、FX Dynamic、FX Levels、IX Power などの主要ツールと連携し、複数のチャートを切り替える手間なく、重要な市場変動を自動で通知します。ブローカーが提供するすべての資産クラスに対応しており、シンボルを入力する必要はありません。設定で資産クラスを選択するだけで、すぐにアラートを構成できます。 1. Custom Alerts がトレーダーにとって非常に有益な理由 オールインワンの市場監視 • Custom Alerts は、為替、金属、暗号資産、指数、株式(ブローカーが対応している場合)からのシグナルを収集・統合します。 • 複数のチャートを切り替える必要がなくなり、明確で一元化された通知が得られます。 戦略に合わせたアラート構成 • ボリューム急増、通貨強弱の閾値、極端な価格変動など、目的に応じたアラート
Automatic Trailing Stop Based on Take Profit Percentage with Profit Lock EA MT4   Lock in your profits and "let your winners run" past your 100% take profit target with this EA.  This Expert Advisor automatically adjusts your Stop Loss based on up to 4 user-defined Take Profit Target Percentages, locking in your profit.  If price pushes past your 100% take profit target, the EA will automatically trail the price by user-defined pips, so you won't miss that runaway train again.   EA Features The
トレーディングスペシャル – 40%オフ Advanced Trade Manager – より速く、よりスマートに、より安全に手動取引を行うための究極のオールインワンソリューション。 NextGen Trade Manager AIで手動取引を変革しましょう。これは、即時執行、視覚的な取引プランニング、そして強力なリスク管理を1つの直感的なツールに統合した、プロフェッショナルなオンチャートパネルです。チャートを離れることなく、注文執行、リスク管理、そして利益確保をかつてないほど迅速に行うことができます。取引の精度と効率性を高めたいすべてのトレーダーに最適です。 MT4ストラテジーテスターでリスクなしでテスト デモ版をダウンロードして、ペーパートレード機能をご利用ください。本番運用前に、安全なシミュレーション環境で執行の練習、リスク管理ルールのテスト、そして戦略の改良を行うのに最適な方法です。 完全なユーザーマニュアルとステップバイステップガイドについては、 https://www.mql5.com/en/blogs/post/764217 をご覧ください。 主なメリット:
作者のその他のプロダクト
This is an interactive and easy-to-set indicator which allows to form seven equally spaced channels which have your settings simultaneously. All seven channels are enabled by default. But you can easily enable one or another channel using control buttons located in the upper case of the indicator's control panel. You can change a period of the indicator calculation by clicking one of buttons indicating number of the channel in the lower case of the control panel. Two other buttons (one of them i
This EA represents an interactive panel with adjustable parameters destined for installation and deletion of pending orders (orders grid generator). You can place the panel anywhere on the screen or hide it into a dot clicking on the button in the upper left part of the chart (it will be shown after clicking on it for the second time). Number and step of orders, lot size, vertical shift for limit orders - all these things make your work easier. There are functions for restoring according to pend
The purpose of the indicator is drawing an equidistant channel. It is somewhat different from the traditional model. The choice of control parameters is simple and does not require any special description. Enter the calculation interval in hours and the solution to the problem will appear on the screen. Please note that the time involved in calculation of the channel must be greater than the timeframe it will be displayed on. If the parameters you enter are beyond the allowable limits, you will
This indicator is designed for drawing equidistant channels. Two options are available: based on the number of hours in the indicator calculation and by the number of bars. To draw a channel, enter a number 1 or greater. The maximum value is limited by the amount of visible bars. If the parameters you enter are beyond the allowable limits, you will get notified if the indicator restrictions. Please note that the time involved in calculation of the channel must be greater than the timeframe it wi
This is a well-known ZigZag indicator. But it differs by the fact that its plot is based on values of the middle line which is set by a user. It can display Andrews’ Pitchfork and standard or Bobokus Fibo levels. NO REPAINTING. Parameters Period МА — middle line period. Default value is 34. Minimum value is 4. Maximum value is set at your discretion. Used to calculate price - base price to calculate the middle line. The averaging method - method of smoothing the middle line. Turning pitchfork —
The indicator displays the moving average of all periods on one chart. It shows the MA of a one step lower timeframe and all the MAs equal to and higher than it. Parameters Period moving average - Moving Average period (default is 34); Used to calculate price - price used for the MA calculation (default is the average price = (high+low)/2); The averaging method - default is linear-weighted; Moving average shift - MA shift (default is 0). Just enter the MA calculation period and its parameters,
Desk Analytical Table Portfolio Monitoring for Active Traders Overview: The Desk Analytical Table indicator is a professional tool designed for traders managing multiple financial instruments simultaneously. It consolidates key data on open positions, orders, and market statistics into a single window, ensuring seamless portfolio control even during high-intensity trading sessions. Key Features: ️ Multi-Instrument Analysis - Monitor up to 30 assets in real time with quick switching between inst
This is a prototype of the famous Control and management of transactions panel. There are two main differences: Allows to work with all the variety of financial instruments opened by a user and not only with instruments it was attached to; To activate levels of order closure hidden from a broker, it uses not lines but modifiable virtual levels. To enjoy the full functionality of the panel you are advised to have: Desk analytical table . Their combined operation allows to keep the situation under
Inform Panel For ALL Symbols — Advanced Multi-Instrument Trading Management The Inform Panel For ALL Symbols is a sophisticated trading management tool designed to streamline control over all financial instruments in a trader’s portfolio, eliminating the need to attach it to specific charts. Its core innovation lies in using modifiable virtual levels for stop loss (SL) and take profit (TP), allowing discreet order closure hidden from brokers. The panel automatically detects and lists all active
The indicator is based on the two-buffer scheme and does not require any additional settings. It can be used on any financial instrument without any restrictions. The indicator is a known ZigZag, but it does not redraw . The indicator allows to easily detect significant levels on the price chart, as well as demonstrates the ability to determine the probable direction of a price movement. The calculations are based on the candles' Close prices, thus improving the reliability of the levels. Param
The idea of the indicator stems from the necessity to clearly define the borders of support and resistance levels, which helps to plan the opening and closing of positions in the areas that most appropriately determine the process. Look at the breakdowns of the resistance level that confirm the intention of the price to continue the upward movement, after it passed the support level and entered the channel formed by the two levels. The same is for the case when the price enters the channel downw
This indicator is a logical extension of the product at https://www.mql5.com/en/market/product/12526 . The only difference is that price movement is displayed using a histogram with levels, allowing to assess the direction and strength of the movement. How to interpret the signal: 0 - the middle of the channel; above 0.5 - the breakdown of the channel up; below -0.5 - the breakdown of the channel down. Both indicators are displayed in the attached screenshots. Install the indicator and you will
The indicator shows the levels of the past week and day. In addition, it draws a level in percentage. This level is specified relative to the difference between the High and Low of the past month and week. For the daily levels of the past day, the Close levels are additionally displayed. All you need to do is configure the display parameters of the levels to your liking. Parameters Over the past months installations - settings for the last months; PasteMonthsLines - the level display mode is on
This indicator is the logical continuation of the well-known equidistant channel indicator: https://www.mql5.com/en/market/product/8723 . The main purpose of the indicator is the visualization of price levels relative to the parallel channel using Fibo Bobokus levels in a separate window and the price history. This often allows forecasting the future price movement with a sufficiently high degree of probability. The Fibo levels calculation equation is as follows: FiboLevel = (50-(100*((Close[i]-
This simple to use utility allows opening charts from the list of financial instruments by left clicking their names. The chart window is opened using the Default template. The template name can be changed to one of those stored in Charts-Templates section of the terminal. It is possible to customize the background colors of panels and their labels, and also to select the display type for a more comfortable working environment. This is all you need to know in order to see the result quickly. Pa
If you need to quickly evaluate the results of trading on a current financial instrument by hypothetical price movement in the chosen direction and up to a certain level, set the indicator on any chart that contains open positions and move the line to the desired level after it appears together with the results tab. This is all you need to understand what happens to your deposit if the price is at this level without taking into account existing stop loss and take profit. Enable considering pendi
This is an individual tool for analyzing the market situation. It is very simple to use. After attaching the indicator to the chart, you will see three vertical lines named "VLine 1", "VLine 2" and "VLine 3", following in this order from left to right. For the utility to operate correctly, this sequence should always be observed. Please note: at the first start, the lines are not bound to specific price levels on the chart. This should be done by user in accordance with the following rule: if li
This indicator displays a set of moving average lines across all higher timeframes. The indicator can be installed on any financial instrument and any timeframe. For the analysis of the lines, a panel with timeframe values is provided in the lower right corner. Using the panel, you can easily enable/disable the display of the MA line of any higher timeframe. This allows a more thorough analysis of the market situation. The color of the button matches the color of the moving average line. Parame
This indicator is designed for monitoring RSI levels on the current and higher timeframes. The control panel is user friendly and consists of buttons, with which you can control the display of lines as per the names of the buttons. The button color matches the line color. Parameters "___| Settings of the main indicator " RSI Period - averaging period for index calculation (default is 14); RSI Price type - price used for calculations (default is the Close price); "___| Color palette " Text color
Этот индикатор предназначен для контроля уровней CCI на текущем и старших от него таймфреймах. Панель управления проста в понимании и состоит из кнопок, с помощью которых можно управлять отображением линий, соответствующим указанным на наименовании кнопок. Цвет кнопки совпадает с цветом линии. Этот индикатор из серии подобных индикаторов, которые уже успели завоевать популярность: https://www.mql5.com/ru/market/product/30276 и https://www.mql5.com/ru/market/product/30403 Параметры "___| Setti
This is a well-known ZigZag indicator. But it differs by the fact that its plot is based on values of the middle line which is set by a user. It can display Andrews’ Pitchfork and standard or Bobokus Fibo levels. NO REPAINTING. Parameters Period МА — middle line period. Default value is 34. Minimum value is 4. Maximum value is set at your discretion. Used to calculate price — type of price used for the midline calculations. The averaging method — type of smoothing for the middle line. Turning p
The indicator is similar to https://www.mql5.com/en/market/product/12330 . However, it considers the MQL5 platform features. Peaks and bottoms are calculated based solely on external bars. After a swing is formed, the indicator does not redraw providing opportunities for traders working on horizontal level breakthroughs. Traffic can be reduced by changing the amount of calculated bars in the MinBars variable (default value is 500). All you need is to select the output options, so that you can se
The indicator is based on the two-buffer scheme and does not require any additional settings. It can be used on any financial instrument without any restrictions. The indicator is a known ZigZag, but it does not redraw . The indicator allows to easily detect significant levels on the price chart, as well as demonstrates the ability to determine the probable direction of a price movement. The calculations are based on the candles' Close prices, thus improving the reliability of the levels. Param
It is an analogue of the indicator of levels at https://www.mql5.com/en/market/product/24273 for the MetaTrader 5 platform. The indicator shows the levels of the past month, week and day. In addition, it draws a level in percentage relative to the difference between the High and Low of the past month and week. For the daily levels of the past day, the Close levels are additionally displayed. All you need to do is to configure the display parameters of the levels to your liking. In some cases, af
フィルタ:
Miguel Jimenez Cordero
6779
Miguel Jimenez Cordero 2021.02.25 08:12 
 

Good job.

Matthew Todorovski
13132
Matthew Todorovski 2018.06.16 11:12 
 

ユーザーは評価に対して何もコメントを残しませんでした

レビューに返信